. 2021 Oct 7;81(19):4008-4025.e7.
doi: 10.1016/j.molcel.2021.08.016. Epub 2021 Sep 10.

REV1-Polζ maintains the viability of homologous recombination-deficient cancer cells through mutagenic repair of PRIMPOL-dependent ssDNA gaps

Affiliations

REV1-Polζ maintains the viability of homologous recombination-deficient cancer cells through mutagenic repair of PRIMPOL-dependent ssDNA gaps

Angelo Taglialatela et al. Mol Cell. .

Abstract

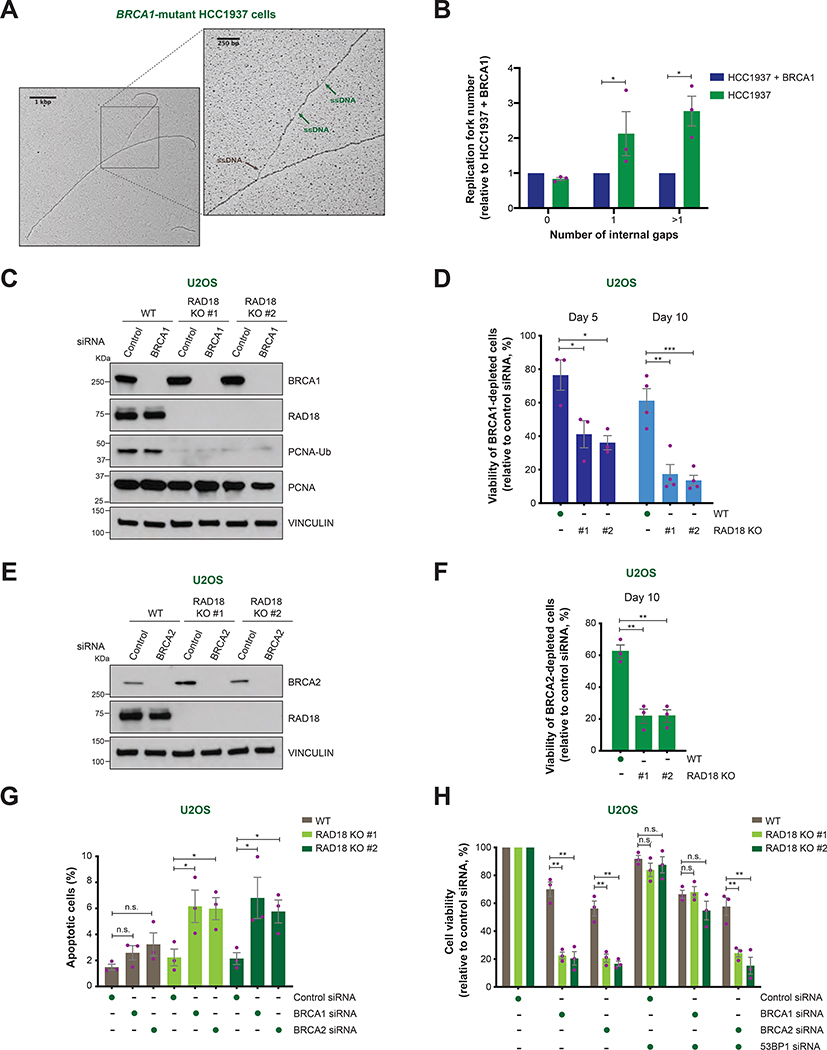
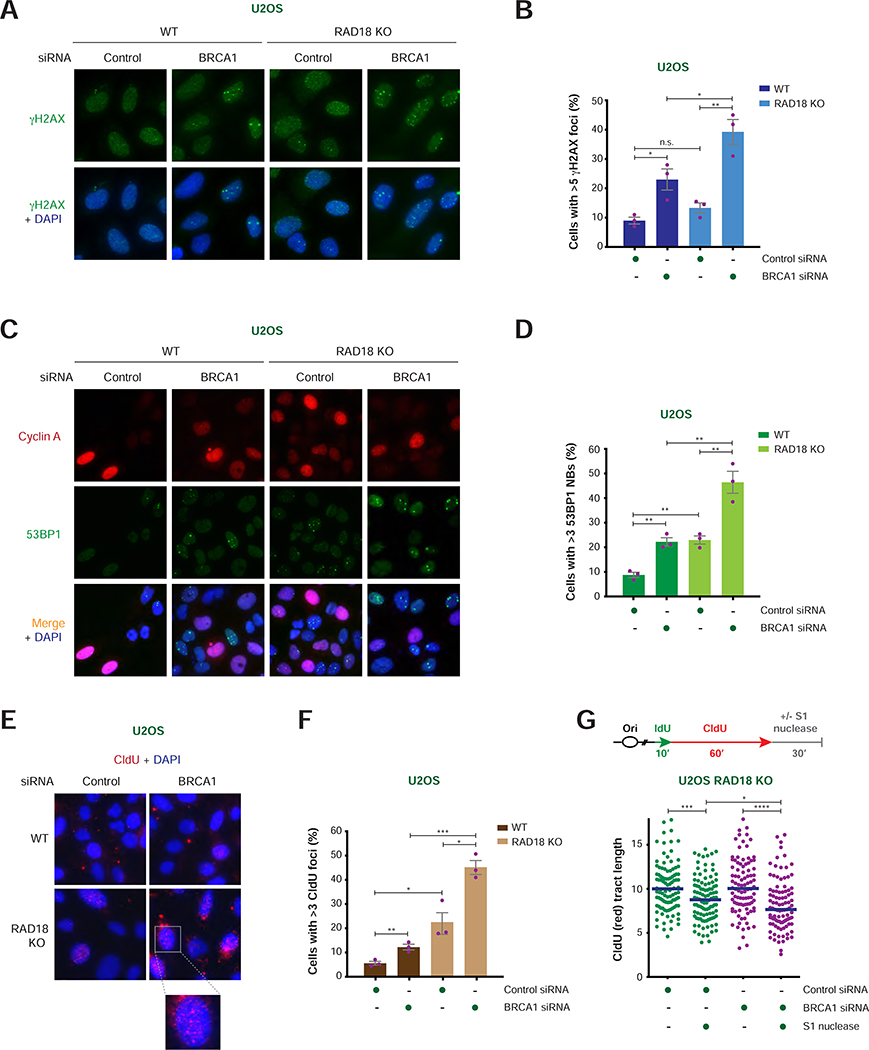
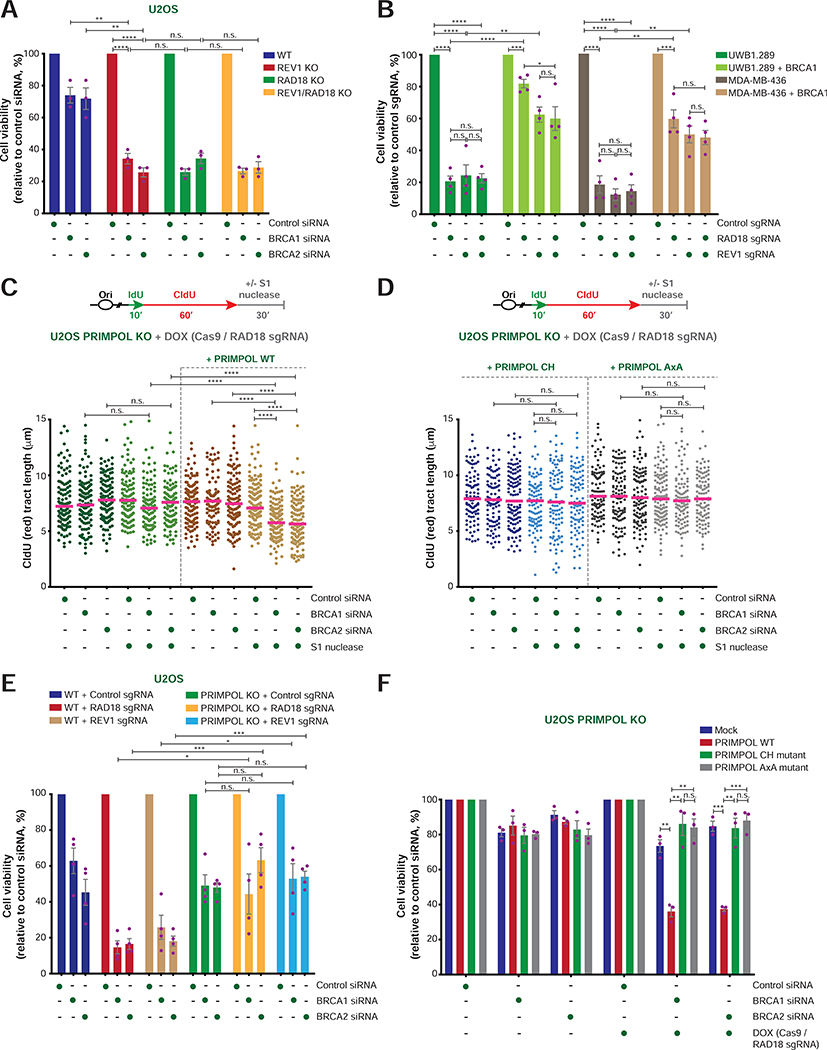
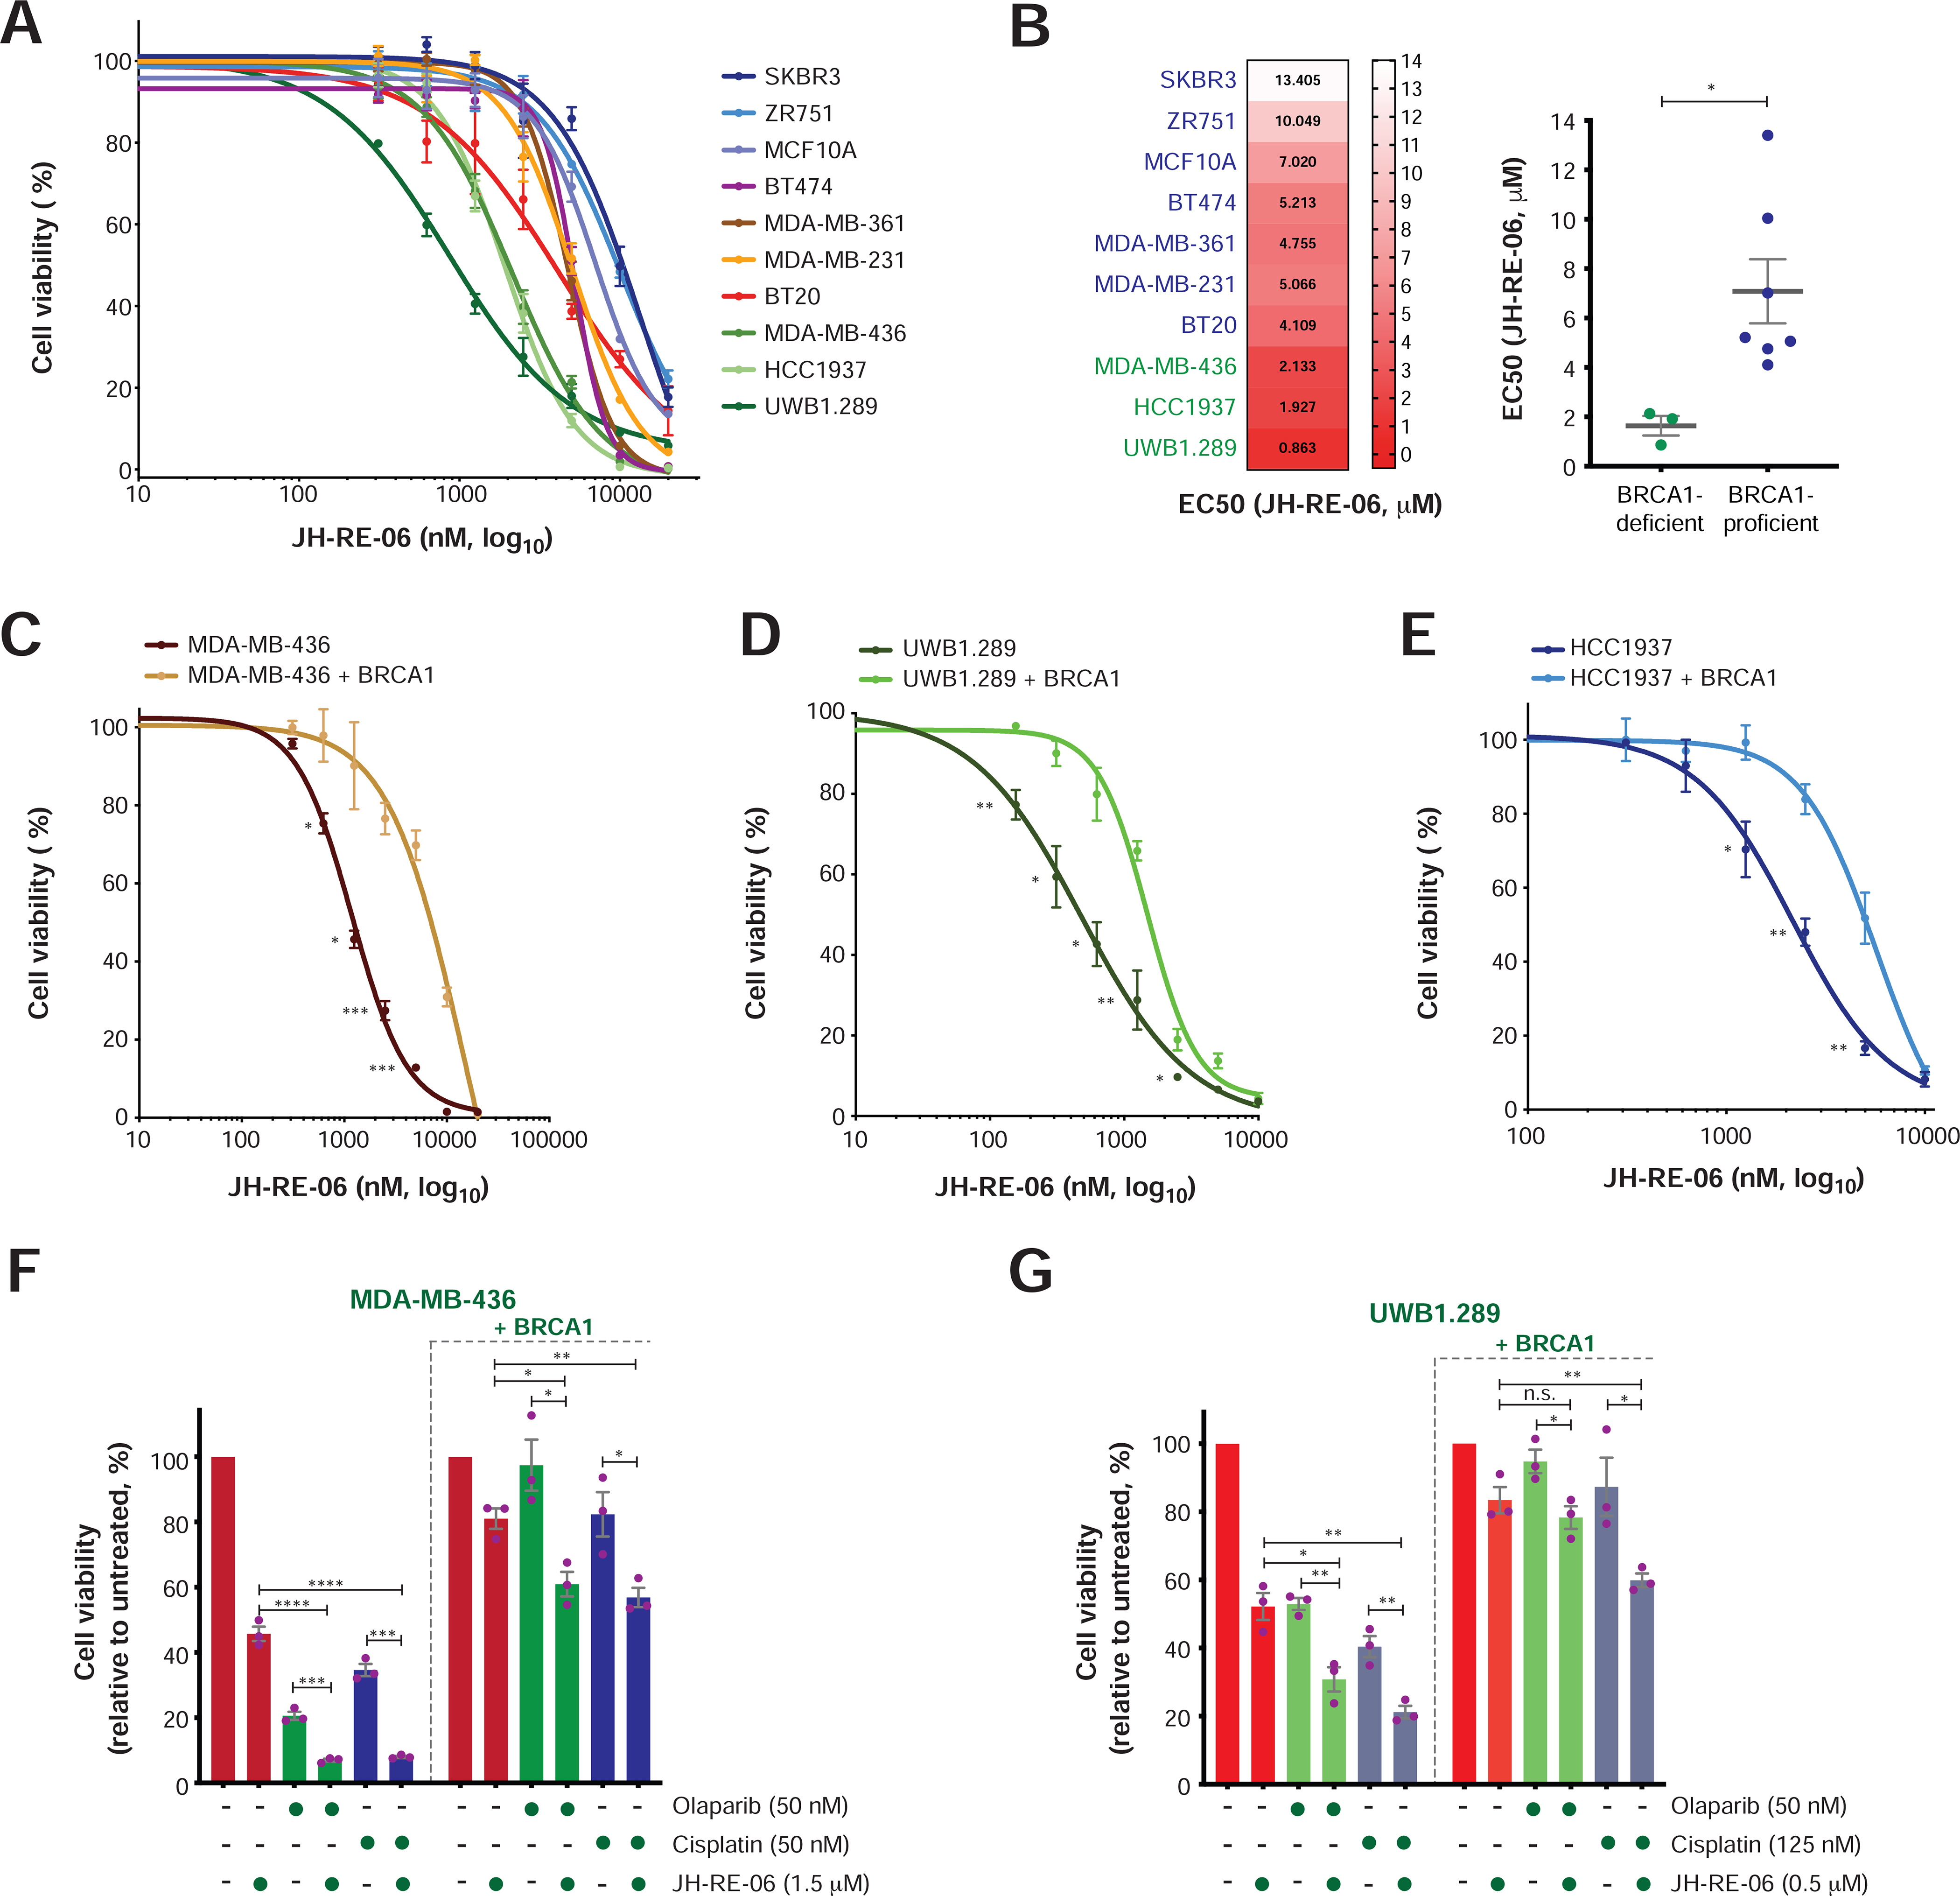
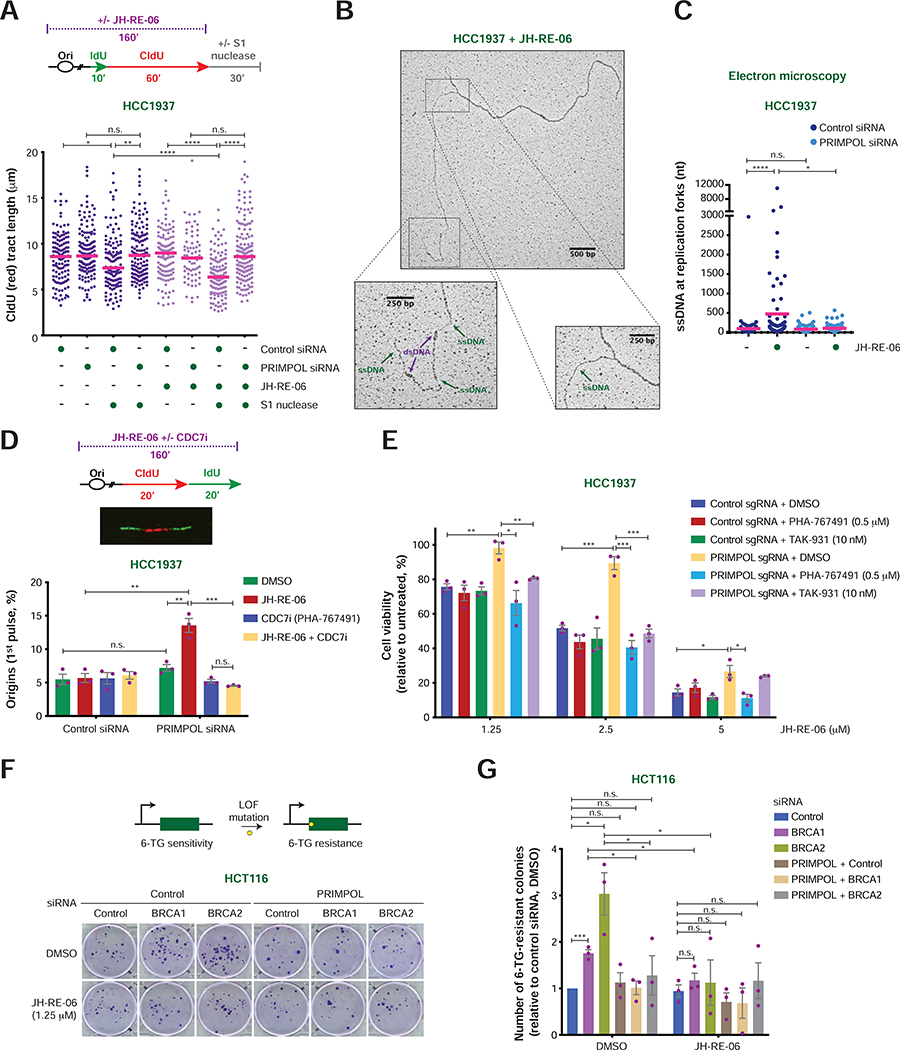
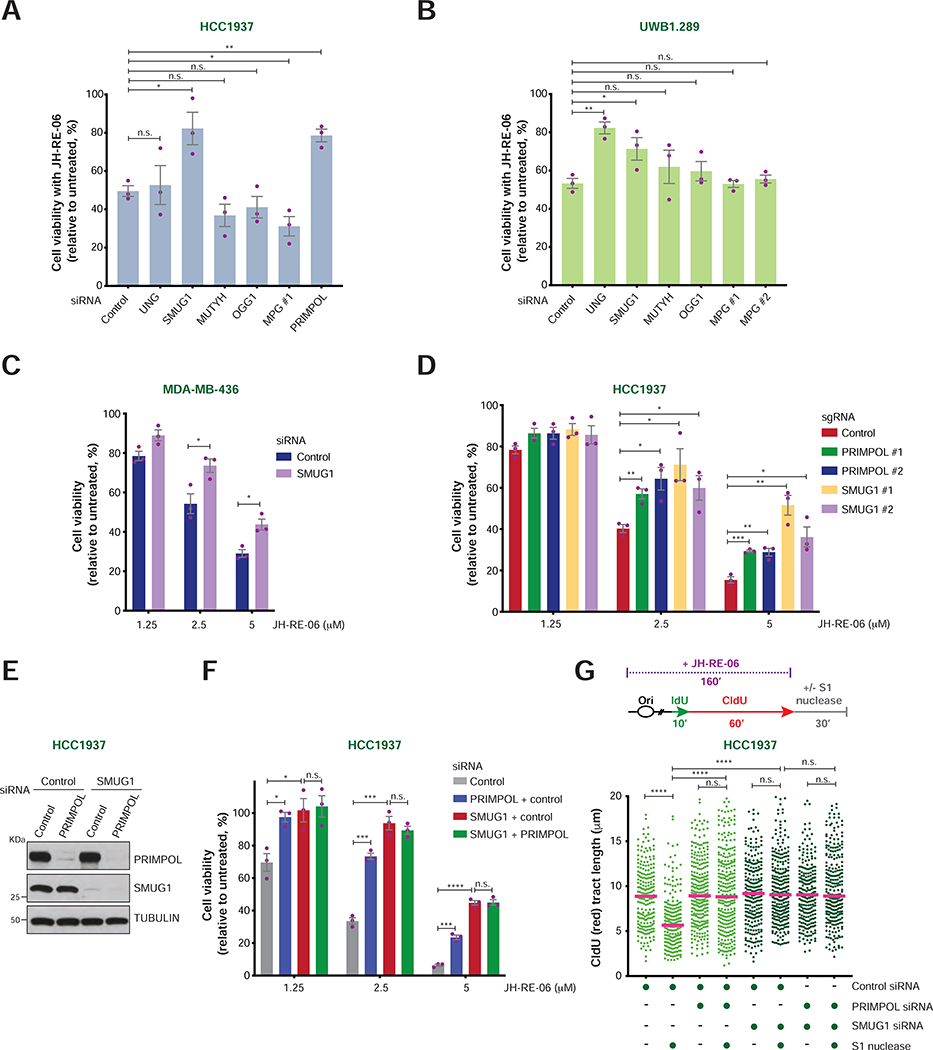
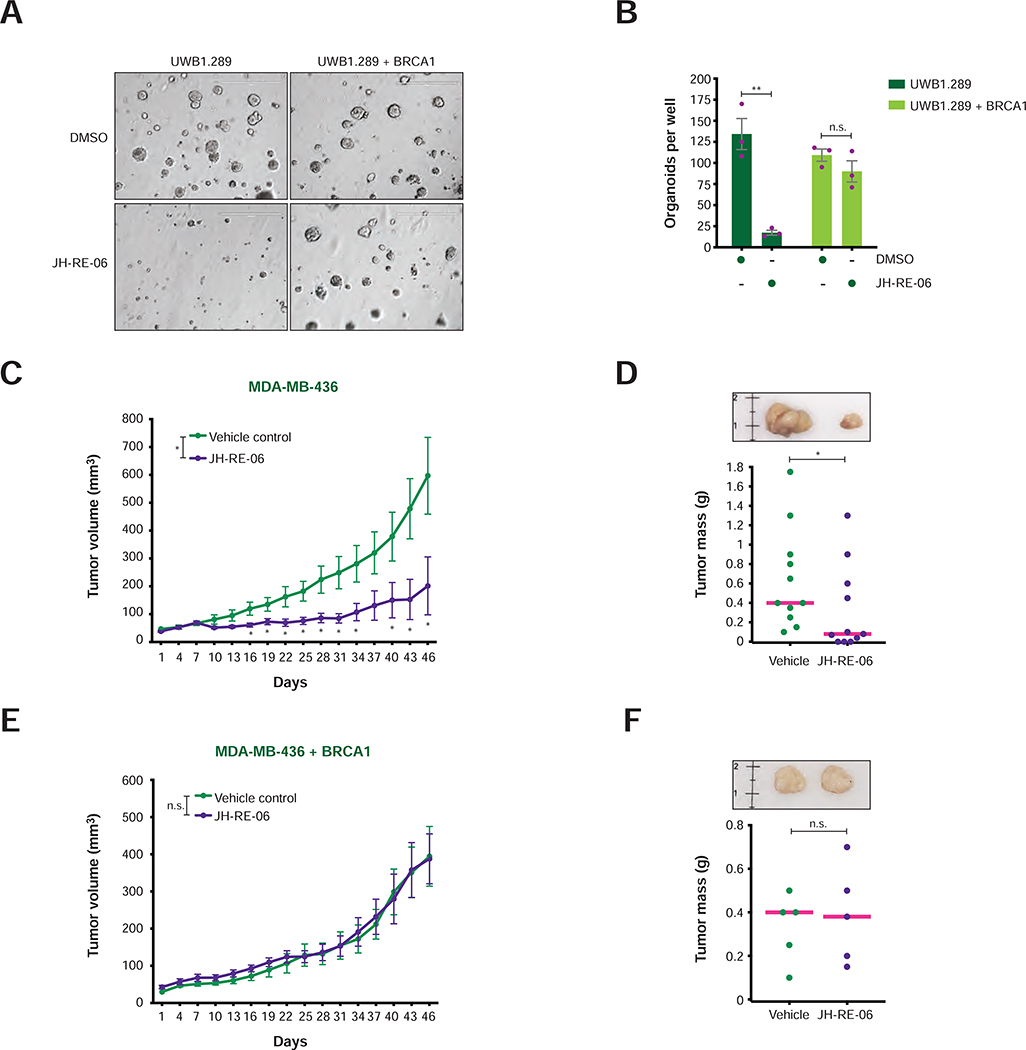
BRCA1/2 mutant tumor cells display an elevated mutation burden, the etiology of which remains unclear. Here, we report that these cells accumulate ssDNA gaps and spontaneous mutations during unperturbed DNA replication due to repriming by the DNA primase-polymerase PRIMPOL. Gap accumulation requires the DNA glycosylase SMUG1 and is exacerbated by depletion of the translesion synthesis (TLS) factor RAD18 or inhibition of the error-prone TLS polymerase complex REV1-Polζ by the small molecule JH-RE-06. JH-RE-06 treatment of BRCA1/2-deficient cells results in reduced mutation rates and PRIMPOL- and SMUG1-dependent loss of viability. Through cellular and animal studies, we demonstrate that JH-RE-06 is preferentially toxic toward HR-deficient cancer cells. Furthermore, JH-RE-06 remains effective toward PARP inhibitor (PARPi)-resistant BRCA1 mutant cells and displays additive toxicity with crosslinking agents or PARPi. Collectively, these studies identify a protective and mutagenic role for REV1-Polζ in BRCA1/2 mutant cells and provide the rationale for using REV1-Polζ inhibitors to treat BRCA1/2 mutant tumors.

Keywords: BRCA1 and BRCA2; DNA repriming; PRIMPOL; RAD18; REV1 and Polζ; breast and ovarian cancer; homologous recombination; ssDNA gaps; synthetic lethality; translesion synthesis.


Conflict of interest statement

Declaration of interests The authors declare no competing interests.

Figures

FIGURE 1.
FIGURE 1.. Replication fork gaps and cellular viability in BRCA1/2-deficient cells following RAD18 loss
A) Representative image of a replication fork detected by EM in BRCA1-mutant HCC1937 cells. ssDNA gaps at the fork junction and internal gaps are indicated by brown and green arrows, respectively. B) Fold change in the percentage of replication forks with the indicated number of internal ssDNA gaps in HCC1937 cells relative to BRCA1-reconstituted HCC1937 cells. Values of individual experiments are indicated as dots. Columns represent the mean ± SEM of independent biological replicates (n = 3). Statistical analysis was conducted by unpaired t-test (*p < 0.05). C) BRCA1, RAD18, PCNA and ubiquitinated PCNA (PCNA-Ub) levels in WT and RAD18 KO (#1, #2) U2OS cells transfected with the indicated siRNAs, as detected by western blot. Vinculin is shown as control. D) Viability of WT and RAD18 KO (#1, #2) U2OS cells at day 5 and 10 after treatment with control or BRCA1 siRNA. Cell viability is represented as a percentage of viable BRCA1-depleted cells relative to control siRNA-treated cells. Values of individual experiments are indicated as dots. Columns represent the mean ± SEM of independent biological replicates (n ≥ 3). Statistical analysis was conducted by unpaired t-test (*p < 0.05, **p < 0.01, ***p < 0.001). E) BRCA2 and RAD18 levels in WT and RAD18 KO (#1, #2) U2OS cells transfected with the indicated siRNAs, as detected by western blot. Vinculin is shown as control. F and H) Viability of WT and RAD18 KO (#1, #2) U2OS cells after treatment with the indicated siRNAs. Graphical representation and statistical analysis were conducted as in (D) (n = 3). G) Percentage of apoptotic cells determined by propidium iodide/Annexin V staining and flow cytometry after transfection of the indicated siRNAs. Graphical representation and statistical analysis were conducted as in (D) (n = 3).
FIGURE 2.
FIGURE 2.. Analysis of DNA damage induced by RAD18 loss in BRCA1/2-deficient cells
A) Representative images of γH2AX foci (green) with and without DAPI staining (blue) in WT and RAD18 KO U2OS cells after treatment with the indicated siRNAs. Scale bar = 10 μm. B) Percentage of cyclin A-positive cells with >5 γH2AX foci per nucleus in WT and RAD18 KO U2OS cells treated with the indicated siRNAs. Values of individual experiments are indicated as dots. Columns represent the mean ± SEM of independent biological replicates (n = 3). Statistical analysis was conducted by unpaired t-test (*p < 0.05, **p < 0.01, ***p < 0.001). C) Representative images of cyclin A (red) and 53BP1 (green) staining with and without merge with DAPI staining (blue) in WT and RAD18 KO U2OS cells after treatment with the indicated siRNAs. Scale bar = 10 μm. D) Percentage of cyclin A-negative cells with >3 53BP1 nuclear bodies (NBs) per nucleus in WT and RAD18 KO U2OS cells treated with the indicated siRNAs. Graphical representation and statistical analysis were conducted as in (B). E) Representative images of CldU staining under non-denaturing conditions (red) with DAPI staining (blue) in WT and RAD18 KO U2OS cells after treatment with the indicated siRNAs. Scale bar = 10 μm. F) Percentage of cyclin A-positive cells with >3 CldU foci per nucleus in WT and RAD18 KO U2OS cells treated with the indicated siRNAs. Graphical representation and statistical analysis were conducted as in (B). G) Schematic of the IdU/CldU pulse-labeling protocol followed by S1 nuclease treatment (top). Dot plot and median of CldU tract lengths (μm) in RAD18 KO cells per indicated experimental condition (bottom). P-values were calculated by Mann-Whitney test (*p < 0.05, ***p < 0.001, ****p < 0.0001).
FIGURE 3.
FIGURE 3.. Cellular viability and ssDNA gap formation in BRCA1/2-deficient cells following loss of RAD18, REV1 and/or PRIMPOL
A) Viability of WT, REV1 KO, RAD18 KO and REV1/RAD18 KO U2OS cells after treatment with the indicated siRNAs. Cell viability is represented as a percentage of viable cells relative to control siRNA-treated cells. Values of individual experiments are indicated as dots. Columns represent the mean ± SEM of independent biological replicates (n = 3). Statistical analysis was conducted by unpaired t-test (*p < 0.05, **p < 0.01, ***p < 0.001, ****p < 0.0001). B) Viability of UWB1.289 and MDA-MB-436 cells with and without BRCA1 re-expression after transfection of Cas9 protein in complex with the indicated sgRNAs. Cell viability is represented as a percentage of viable cells relative to control sgRNA-treated cells (n = 4). Graphical representation and statistical analysis were conducted as in (A). C-D) Schematic of the IdU/CldU pulse-labeling protocol with S1 nuclease treatment (top). Dot plot and median of CldU tract lengths (μm) in PRIMPOL KO cells complemented or not with PRIMPOL WT or mutant cDNAs and subjected to the indicated experimental conditions (bottom). Doxycycline (DOX) induces the expression of Cas9 in cells carrying Cas9 and RAD18 sgRNA constructs. P-values were calculated by Mann-Whitney test (****p < 0.0001). E) Viability of WT and PRIMPOL KO U2OS cells transfected with the indicated sgRNAs in complex with Cas9 after treatment with the indicated siRNAs. Cell viability is represented as a percentage of viable cells relative to control siRNA-treated cells (n = 4). Graphical representation and statistical analysis were conducted as in (A). F) Viability of PRIMPOL KO U2OS cells with and without complementation with PRIMPOL WT or mutant cDNAs after treatments with the indicated siRNAs and DOX, as in (C) and (D). Graphical representation and statistical analysis were conducted as in (A).
FIGURE 4.
FIGURE 4.. Survival analysis in BRCA1-proficient and BRCA1-deficient cancer cells upon treatment with the REV1-Polζ inhibitor JH-RE-06
A) Survival analysis in the indicated breast and ovarian cell lines following treatment with JH-RE-06. Cell survival is expressed as percentage relative to the untreated control, and data represent the mean ± SEM of three replicates per condition. B) EC50 of JH-RE-06 per cell line obtained from the survival curves shown in (A) (left panel). Grouped analysis of JH-RE-06 EC50 values in BRCA1-deficient and BRCA1-proficient cells (right panel). Statistical analysis was conducted by unpaired t-test (*p < 0.05). C-E) Survival analyses upon JH-RE-06 treatment of the indicated BRCA1-deficient cell lines with or without BRCA1 re-expression. Data analysis and graphical representation were conducted as in (A). Statistical analysis was performed by unpaired t-test (*p < 0.05, **p < 0.01, ***p < 0.001). F-G) Viability of the indicated BRCA1-deficient and BRCA1-reconstituted cell lines upon treatment with olaparib, cisplatin, JH-RE-06 and combinations of olaparib or cisplatin with JH-RE-06 at the indicated doses. Cell survival is expressed as percentage relative to the untreated control, and data represent the mean ± SEM of three replicates per condition. Statistical analysis was conducted by unpaired t-test (*p < 0.05, **p < 0.01, ***p < 0.001, ****p < 0.0001).
FIGURE 5.
FIGURE 5.. Characterization of PRIMPOL’s role in the response to JH-RE-06 treatment in BRCA1-mutant cancer cells
A) Schematic of the IdU/CldU pulse-labeling protocol with or without JH-RE-06 treatment followed by S1 nuclease digestion (top). Dot plot and median of CldU tract lengths (μm) in HCC1937 cells subjected to the indicated experimental conditions (bottom). P-values were calculated by Mann-Whitney test (*p < 0.05, **p < 0.01, ****p < 0.0001). B) Representative image of a replication fork detected by EM in HCC1937 cells treated with JH-RE-06 (2.5 μM) for 3 hr. dsDNA and ssDNA tracts are indicated. C) Dot plot and mean of ssDNA tract lengths (nt) detected by EM at replication fork intermediates from HCC1937 cells treated with the indicated siRNAs, with and without JH-RE-06 (2.5 μM), as in (B). P-values were calculated by Mann-Whitney test (*p < 0.05, ****p < 0.0001). D) Schematic of the CldU/IdU pulse-labeling protocol upon treatment of HCC1937 cells with JH-RE-06 with or without DMSO or the CDC7 inhibitor PHA-767491 (top). Representative image of a DNA replication origin activated during the 1st pulse (CldU; middle) and percentage of origins (1st pulse) relative to the total number of replication intermediates (bottom). Values of individual experiments are indicated as dots. Columns represent the mean ± SEM of independent biological replicates (n = 3). Statistical analysis was conducted by unpaired t-test (*p < 0.05, **p < 0.01, ***p < 0.001). E) Viability of HCC1937 cells treated with the indicated sgRNAs and DMSO or CDC7 inhibitors in the presence of the indicated doses of JH-RE-06. Cell viability under the indicated conditions is shown as percentage relative to the untreated control. Graphical representation and statistical analysis was conducted as in (D). F) Schematic of the HPRT gene mutation assay (top). Representative images of 6-thioguanine (6-TG)-resistant colonies of HCT116 cells subjected to the indicated treatments (bottom). G) Fold change in the number of 6-TG-resistant colonies in HCT116 cells treated as in (F) relative to cells treated with control siRNA and DMSO. Graphical representation and statistical analysis were conducted as in (D). The number of 6-TG resistant colonies per 105 cells after background subtraction and normalization to plating efficiency is reported in Table S1.
FIGURE 6.
FIGURE 6.. Cellular viability and ssDNA gap formation upon loss of SMUG1 and/or PRIMPOL in BRCA1-mutant cancer cells
A-B) Viability of HCC1937 (A) and UWB1.289 (B) cells treated with the indicated siRNAs and JH-RE-06 (2.5 μM and 1.5 μM, respectively). Cell viability is expressed as percentage relative to the untreated control. Values of individual experiments are indicated as dots. Columns represent the mean ± SEM of independent biological replicates (n = 3). Statistical analysis was conducted by unpaired t-test (*p < 0.05, **p < 0.01, ***p < 0.001, ****p < 0.0001). C) Viability of MDA-MB-436 cells treated with control and SMUG1 siRNAs at the indicated JH-RE-06 doses. Graphical representation and statistical analyses were conducted as in (A) and (B). D) Viability of HCC1937 cells treated with control, SMUG1 and PRIMPOL sgRNAs at the indicated JH-RE-06 doses. Graphical representation and statistical analyses were conducted as in (A) and (B). E) PRIMPOL and SMUG1 levels in HCC1937 following transfection of the indicated siRNAs, as detected by western blot. Tubulin is shown as control. F) Viability of HCC1937 cells following treatment with the indicated siRNAs and doses of JH-RE-06. Graphical representation and statistical analysis were conducted as in (A) and (B). G) Schematic of the IdU/CldU pulse-labeling protocol with JH-RE-06 treatment followed by S1 nuclease digestion (top). Dot plot and median of CldU tract lengths (μm) in HCC1937 cells subjected to the indicated experimental conditions (bottom). P-values were calculated by Mann-Whitney test (****p < 0.0001).
FIGURE 7.
FIGURE 7.. Growth of BRCA1-deficient and BRCA1-reconstituted tumors following JH-RE-06 treatment
A) Representative images of organoids of BRCA1-deficient and BRCA1-reconstituted UWB1.289 cells treated with DMSO or JH-RE-06 (1 μM) for 20 days. Scale bar = 400 μm. B) Number of UWB1.289 organoids per well treated as in (A). Values of individual experiments are indicated as dots. Columns represent the mean ± SEM of independent biological replicates (n = 3). Statistical analysis was conducted by unpaired t-test (**p < 0.01). C and E) Growth curves of xenograft tumors induced by MDA-MB-436 cells with or without BRCA1 re-expression upon treatment with vehicle control or JH-RE-06. Error bars represent SEM of 11 and 5 xenograft tumors per treatment group in (C) and (E), respectively. P-values of tumor volume differences between groups were calculated by unpaired t-test (*p < 0.05). D and F) Representative images (top panel) and dot plot with mean (bottom panel) of xenograft tumor masses collected at day 46 of the experiments shown in (C) and (E). The reference ruler is in cm. Statistical analysis between treatment groups was conducted using unpaired t-test (*p < 0.05).

References

    1. Alexandrov LB, Nik-Zainal S, Wedge DC, Aparicio SA, Behjati S, Biankin AV, Bignell GR, Bolli N, Borg A, Borresen-Dale AL, et al. (2013). Signatures of mutational processes in human cancer. Nature 500, 415–421. - PMC - PubMed
    1. Alsoe L, Sarno A, Carracedo S, Domanska D, Dingler F, Lirussi L, SenGupta T, Tekin NB, Jobert L, Alexandrov LB, et al. (2017). Uracil Accumulation and Mutagenesis Dominated by Cytosine Deamination in CpG Dinucleotides in Mice Lacking UNG and SMUG1. Scientific reports 7, 7199. - PMC - PubMed
    1. Apostolou P, and Fostira F (2013). Hereditary breast cancer: the era of new susceptibility genes. Biomed Res Int 2013, 747318. - PMC - PubMed
    1. Bai G, Kermi C, Stoy H, Schiltz CJ, Bacal J, Zaino AM, Hadden MK, Eichman BF, Lopes M, and Cimprich KA (2020). HLTF Promotes Fork Reversal, Limiting Replication Stress Resistance and Preventing Multiple Mechanisms of Unrestrained DNA Synthesis. Mol Cell. - PMC - PubMed
    1. Bianchi J, Rudd SG, Jozwiakowski SK, Bailey LJ, Soura V, Taylor E, Stevanovic I, Green AJ, Stracker TH, Lindsay HD, et al. (2013). PrimPol bypasses UV photoproducts during eukaryotic chromosomal DNA replication. Mol Cell 52, 566–573. - PMC - PubMed

Publication types

MeSH terms