. 2021 Oct 19;120(20):4399-4417.
doi: 10.1016/j.bpj.2021.09.006. Epub 2021 Sep 10.

Mechanism of actin filament nucleation

Affiliations

Mechanism of actin filament nucleation

Aaron D Rosenbloom et al. Biophys J. .

Abstract

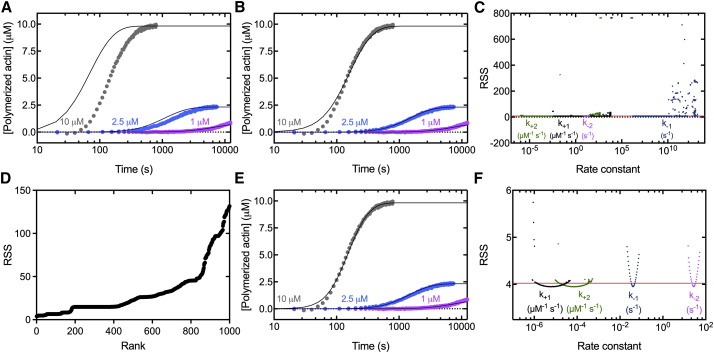
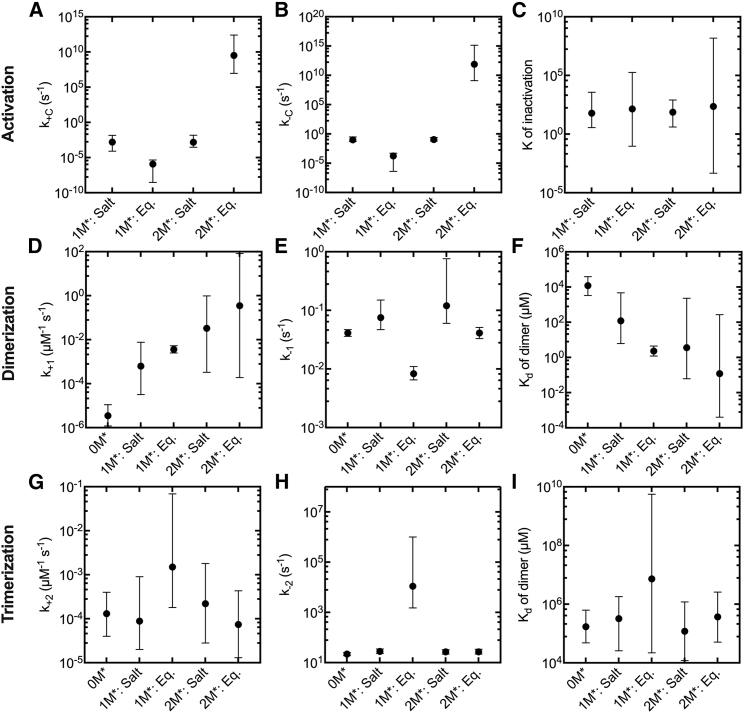
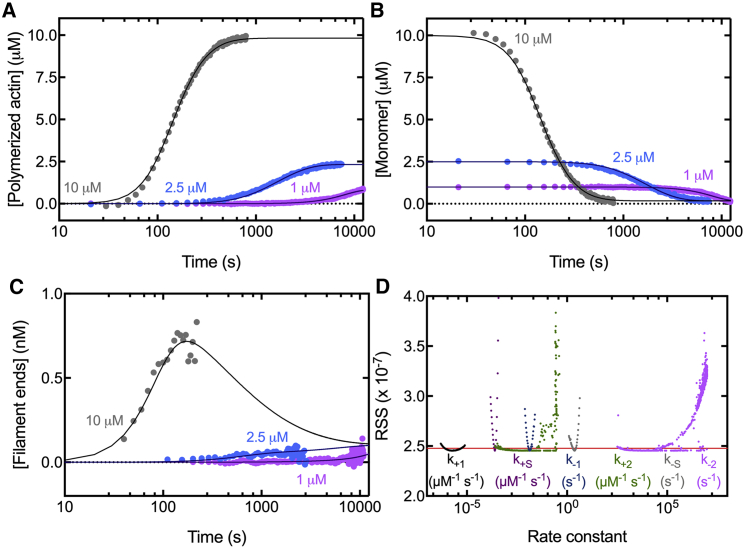
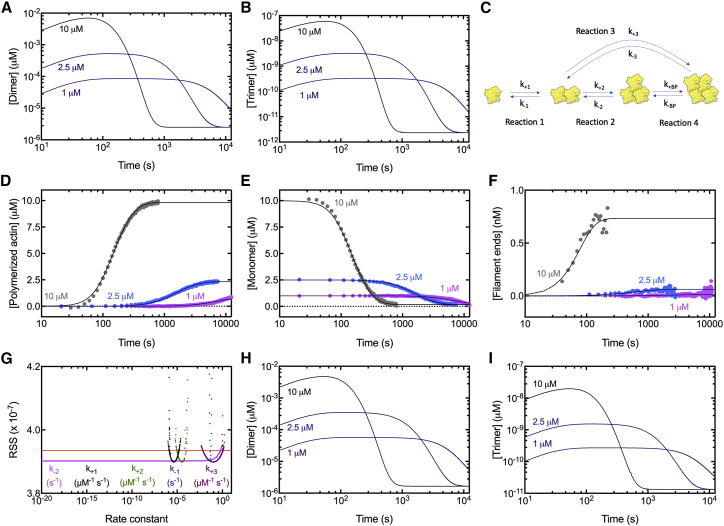
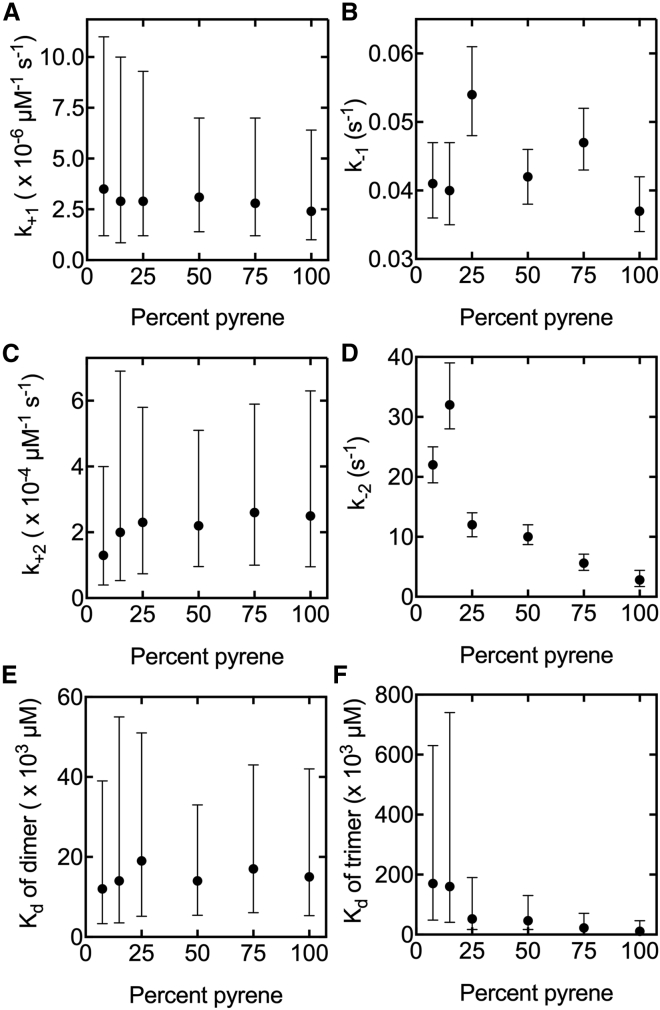
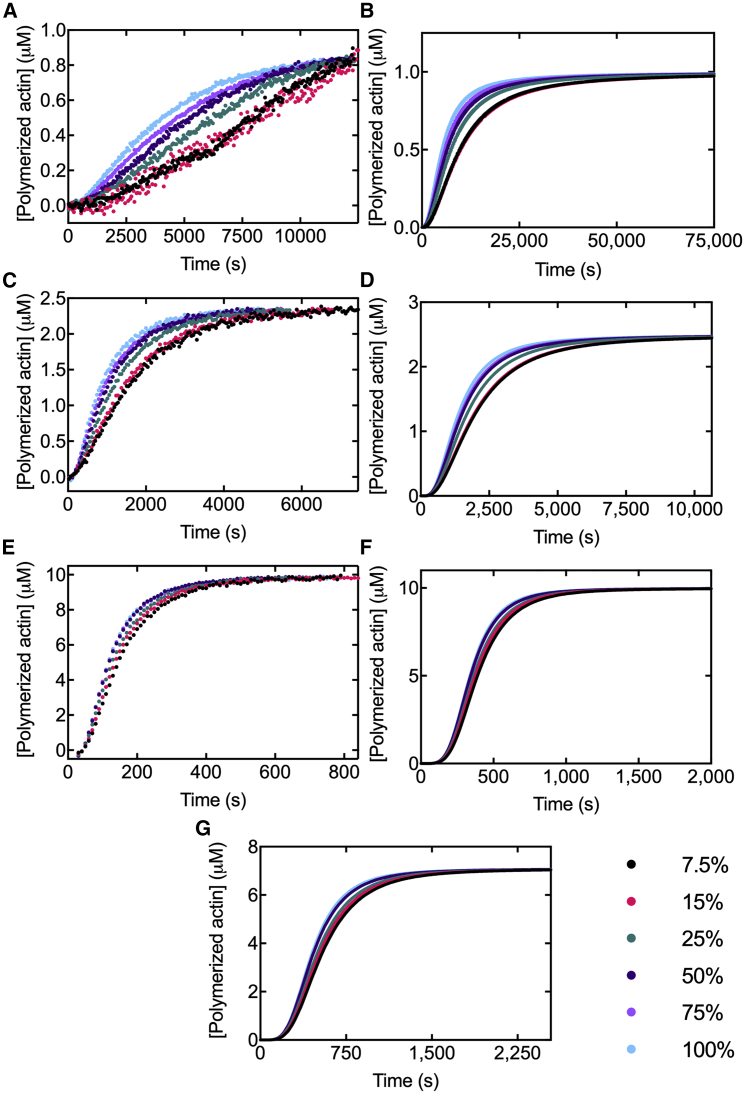
We used computational methods to analyze the mechanism of actin filament nucleation. We assumed a pathway where monomers form dimers, trimers, and tetramers that then elongate to form filaments but also considered other pathways. We aimed to identify the rate constants for these reactions that best fit experimental measurements of polymerization time courses. The analysis showed that the formation of dimers and trimers is unfavorable because the association reactions are orders of magnitude slower than estimated in previous work rather than because of rapid dissociation of dimers and trimers. The 95% confidence intervals calculated for the four rate constants spanned no more than one order of magnitude. Slow nucleation reactions are consistent with published high-resolution structures of actin filaments and molecular dynamics simulations of filament ends. One explanation for slow dimer formation, which we support with computational analysis, is that actin monomers are in a conformational equilibrium with a dominant conformation that cannot participate in the nucleation steps.


Figures

Figure 1
Figure 1
Time courses of spontaneous polymerization of 7.5% pyrenyl-Mg-ATP-actin monomers and fits of different optimized simulations of the nucleation model to the data constrained by the concentrations of polymer over time. Symbols are the experimental measurements. Smooth curves are numerical simulations of the model. (A) Simulations of polymer concentration versus time using the nucleation rate constants of Sept and McCammon (9) compared with experimental data. (B) Fits of simulations of polymer concentration versus time to experimental data starting with the values of Sept and McCammon (9) as initial values and refining the fit locally. (C) PLEs of the nucleation rate constants derived from calibrating our model in (B). At each fixed value of a rate constant on the x axis, the model was fitted to the polymer concentration versus time to estimate the three unknown rate constants. The residual sum of squares (RSS) from the fit is plotted on the y axis. These plots give one-dimensional contours of the parameter landscape with the best-fit value having the lowest RSS. The red line indicates the 95% CI. The two intersections of the curves give the range in which each parameter is identifiable. (D) A plot showing the objective value (RSS) of the top 1000 fits from a multistart fitting workflow using multiple, random initial values plotted against the rank of best to worst fit. (E) Fits of simulations of polymer concentration versus time to experimental data using a multistart fitting workflow and multiple, random initial values. (F) PLEs of the nucleation rate constants (as in C) derived from calibrating our model in (E). The CIs for the four unknown rate constants are narrower than in (C), as reported in Table 2, columns 3 and 4. To see the figure in color, go online.
Figure 2
Figure 2
Three methods of fitting simulations of the nucleation model to the time courses of spontaneous polymerization of three concentrations of 7.5% pyrenyl-Mg-ATP-actin monomers. Symbols are the experimental measurements of the polymer concentration or calculated concentrations of monomers and filament ends. Smooth curves are numerical simulations of the model constrained by time courses of (column 1) the concentration of polymerized actin measured from the pyrene fluorescence for polymer, (column 2) polymer and filament end concentration calculated at each time point from the rate of polymerization and the actin monomer concentration, and (column 3) polymer, monomer (calculated at each time point from the concentration of total actin minus the polymer concentration), and filament end concentrations. Shown are (row 1) concentration of polymer versus time, (row 2) concentration of actin monomer versus time, and (row 3) concentration of filament ends versus time. Concentration of actin monomer was only used to constrain column 3. Concentration of filament ends versus time was only used to constrain columns 2 and 3. Shown in row 4, PLEs of the actin nucleation parameters for the three methods to constrain the fits. Symbols correspond to the RSS from best-fit values for each fixed value of the rate constant plotted on the x axis. The red line indicates the 95% CI. The two intersections of the curves give the range in which each parameter is identifiable. To see the figure in color, go online.
Figure 3
Figure 3
Simulations of four models with a monomer conformation change as a requirement for dimer formation. Searches for the six unknown rate constants gave good fits to the experimental data. Symbols are the experimental measurements. Smooth curves are numerical simulations of the model. (A, C, E, and G) Time courses of the concentration of polymerized actin measured from 7.5% pyrenyl-Mg-ATP-actin fluorescence for four models: (A) one monomer salt-induced conformational change model, (C) one monomer equilibrated conformational change model, (E) two monomer salt-induced conformational change model, and (G) two monomer equilibrated conformational change model. (B, D, F, and H) PLEs of the actin nucleation parameters for (B) the one monomer salt-induced conformational change model, (D) one monomer equilibrated conformational change model, (F) two monomer salt-induced conformational change model, and (H) two monomer equilibrated conformational change model. Symbols correspond to the RSS from best-fit values for each fixed value of the rate constant plotted on the x axis. The red line indicates the 95% CI. The two intersections of the curves give the range in which each parameter is identifiable. To see the figure in color, go online.
Figure 4
Figure 4
Rate and equilibrium constants for the nucleation reactions for no monomer activation required to form a dimer (0M) and four models with a monomer conformation change required to form dimers: salt and activation of one monomer is required (1M: Salt); activation of one monomer already equilibrated in low salt is required (1M: Eq.); salt and activation of two monomers is required (2M: Salt); activation of two monomers already equilibrated in low salt is required (2M: Eq.). The values for 0M appear in the final columns of Tables 1 and 2. Symbols correspond to best-fit values. The bars are 95% CIs from the PLEs. (A) Rate constants for the conformational change from the twisted-closed state to the flattened-open state, k+C. (B) Rate constants for conformational change from the flattened-open state to the twisted-closed state, k−C. (C) Equilibrium constants for the change between the twisted-closed and flattened-opened conformations, K of inactivation. (D) Rate constants for dimer formation, k+1. (E) Rate constants for dimer dissociation, k−1. (F) Dissociation equilibrium constants of dimer formation, Kd of dimer. (G) Rate constants for trimer formation, k+2. (H) Rate constants for trimer dissociation, k-2. (I) Dissociation equilibrium constants of trimer formation, Kd of trimer.
Figure 5
Figure 5
Time courses of spontaneous polymerization of 7.5% pyrenyl-Mg-ATP-actin monomers and fits of simulations of the nucleation model with the addition of a reversible severing reaction to the data constrained by the concentrations of polymer, monomer, and ends versus time. Symbols are the experimental measurements. Smooth curves are numerical simulations of the model. (A) Time courses of the concentration of polymerized actin measured from the pyrene fluorescence. (B) Time courses of the concentration of actin monomers calculated from the total actin minus the concentration of polymerized actin. (C) Time courses of the concentration of filament ends calculated from the rate of polymerization and the actin monomer concentration. (D) PLEs of the actin nucleation parameters. Symbols correspond to the RSS from best-fit values for each fixed value of the rate constant plotted on the x axis. The red line indicates the 95% CI. The two intersections of the curves give the range in which each parameter is identifiable. To see the figure in color, go online.
Figure 6
Figure 6
Time courses of spontaneous polymerization of 7.5% pyrenyl-Mg-ATP-actin monomers and fits of simulations to the data of the modified nucleation model with tetramer formation by two parallel pathways constrained by the concentrations of polymer, monomer, and ends versus time. Shown are simulations of the time courses of the concentrations of (A) dimers and (B) trimers during the polymerization of 7.5% pyrenyl-Mg-ATP-actin using our estimated nucleation rate constants from the model that does not include a tetramer from two dimers. (C) Two pathways to form tetramers. (D) Time courses of the concentration of polymerized actin measured from the pyrene fluorescence. (E) Time courses of the concentration of actin monomers calculated from the total actin minus the concentration of polymerized actin. (F) Time courses of the concentration of filament ends calculated from the rate of polymerization and the actin monomer concentration. (G) PLEs of the actin nucleation parameters. Symbols correspond to the RSS from best-fit values for each fixed value of the rate constant plotted on the x axis. The red line indicates the 95% CI. The two intersections of the curves give the range in which each parameter is identifiable. (H and I) Simulations of the time courses of the concentrations of (H) dimers and (I) trimers during the polymerization of 7.5% pyrenyl-Mg-ATP-actin using our estimated nucleation rate constants from the model that includes a tetramer from two dimers. Symbols in (DF) are the experimental measurements. Smooth curves are numerical simulations of the model. To see the figure in color, go online.
Figure 7
Figure 7
Rate and equilibrium constants for the nucleation reactions (dimer and trimer formation) for a range of mole fractions of pyrenyl-Mg-ATP-actin. Symbols correspond to the starting values used for the PLEs (best-fit value). The bars give the 95% CIs from the PLEs. The 7.5% values appear in the final columns of Tables 1 and 2. (A) Values of rate constants for dimer formation, k+1. (B) Values of rate constants for dimer dissociation, k−1. (C) Dissociation equilibrium constants of dimer formation, Kd of dimer. (D) Values of rate constants for trimer formation, k+2. (E) Values of rate constants for trimer dissociation, k−2. (F) Dissociation equilibrium constants of trimer formation, Kd of trimer.
Figure 8
Figure 8
Time courses of spontaneous polymerization of actin monomers with a range of mole fractions of pyrenyl-ATP-actin monomers. Shown are (A) 1-μM, (C) 2.5-μM, and (E) 10-μM monomers with a range of mole fractions of pyrenyl-Mg-ATP-actin monomers. The change in fluorescence over time was converted to concentration of polymer by normalizing the curves based upon the critical concentration of actin. (B, D, F, and G) Simulated time courses of spontaneous polymerization of (B) 1-μM, (D) 2.5-μM, and (F) 10-μM Ca-ATP-actin monomers with a range of mole fractions of pyrene-labeled actin monomers in a buffer with 2 mM Mg2+. Each simulation used the best-fit rates determined from the fits of experimental data for each molar fraction of pyrenyl-actin. (G) Simulated time courses of spontaneous polymerization of 7.1 μM Ca-ATP-actin monomers with a range of mole fractions of pyrene-labeled actin monomers in a buffer with 2 mM Mg2+. This simulation matched the monomer concentration from Cooper et al. (5). To see the figure in color, go online.
Figure 9
Figure 9
Comparison of the nucleation pathways. (A) Nucleation pathway and rate constants determined by Sept and McCammon (9). (B) Our measurements of rate constants from fitting the model to the concentrations of polymer, monomer, and ends versus time (Fig. 2) using the same pathway as in (A). (C) Our hypothesized nucleation pathway with a monomer equilibrium between twisted-closed (orange) and flattened-opened (yellow) conformations. The pathway and rate constants indicated reflect those from a model assuming dimer formation requires one salt-induced flattened-open monomer; however, only twisted-closed monomer conformations participate in the other reactions (Fig. 3, 1M: Salt). To see the figure in color, go online.

Similar articles

Cited by

References

    1. Oosawa F., Asakura S., Ooi T. G-F transformation of actin as a fibrous condensation. J. Polym. Sci. 1959;37:323–336.
    1. Oosawa F., Kasai M. A theory of linear and helical aggregations of macromolecules. J. Mol. Biol. 1962;4:10–21. - PubMed
    1. Wegner A., Engel J. Kinetics of the cooperative association of actin to actin filaments. Biophys. Chem. 1975;3:215–225. - PubMed
    1. Kouyama T., Mihashi K. Fluorimetry study of N-(1-pyrenyl)iodoacetamide-labelled F-actin. Local structural change of actin protomer both on polymerization and on binding of heavy meromyosin. Eur. J. Biochem. 1981;114:33–38. - PubMed
    1. Cooper J.A., Walker S.B., Pollard T.D. Pyrene actin: documentation of the validity of a sensitive assay for actin polymerization. J. Muscle Res. Cell Motil. 1983;4:253–262. - PubMed

Publication types

LinkOut - more resources