. 2022 Jan;20(1):162-172.e9.
doi: 10.1016/j.cgh.2021.09.003. Epub 2021 Sep 9.

SARS-CoV2-specific Humoral and T-cell Immune Response After Second Vaccination in Liver Cirrhosis and Transplant Patients

Affiliations

SARS-CoV2-specific Humoral and T-cell Immune Response After Second Vaccination in Liver Cirrhosis and Transplant Patients

Darius F Ruether et al. Clin Gastroenterol Hepatol. 2022 Jan.

Abstract

Background & aims: Detailed information on the immune response after second vaccination of cirrhotic patients and liver transplant (LT) recipients against severe acute respiratory syndrome coronavirus type 2 (SARS-CoV-2) is largely missing. We aimed at comparing the vaccine-induced humoral and T-cell responses of these vulnerable patient groups.

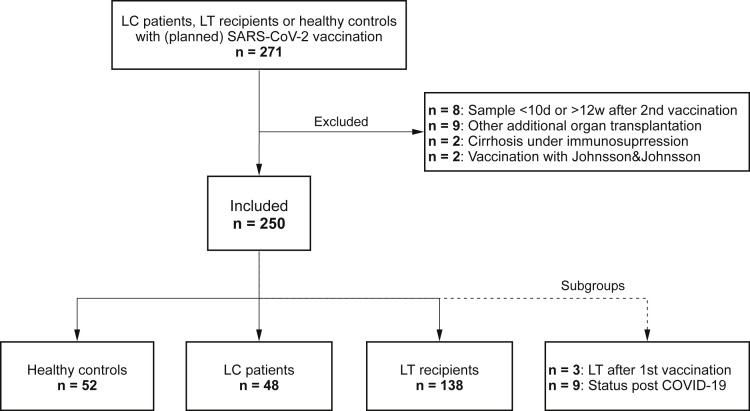
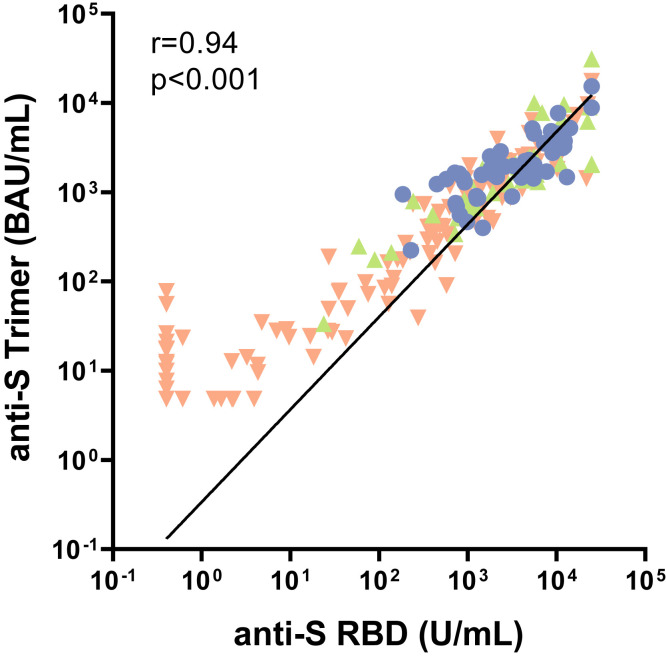
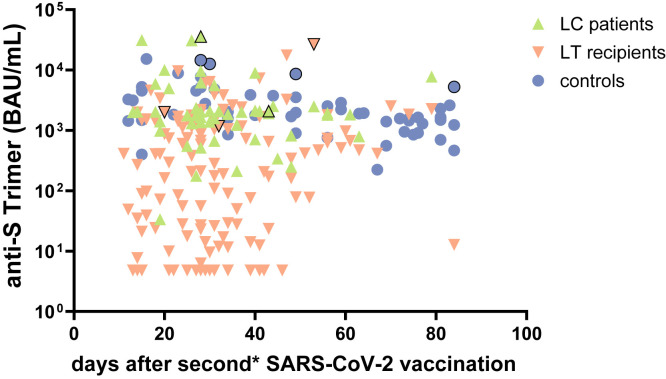
Methods: In this prospective cohort study, anti-SARS-CoV-2 spike-protein titers were determined using the DiaSorin LIAISON (anti-S trimer) and Roche Elecsys (anti-S RBD) immunoassays in 194 patients (141 LT, 53 cirrhosis Child-Pugh A-C) and 56 healthy controls before and 10 to 84 days after second vaccination. The spike-specific T-cell response was assessed using an interferon-gamma release assay (EUROIMMUN). A logistic regression analysis was performed to identify predictors of low response.

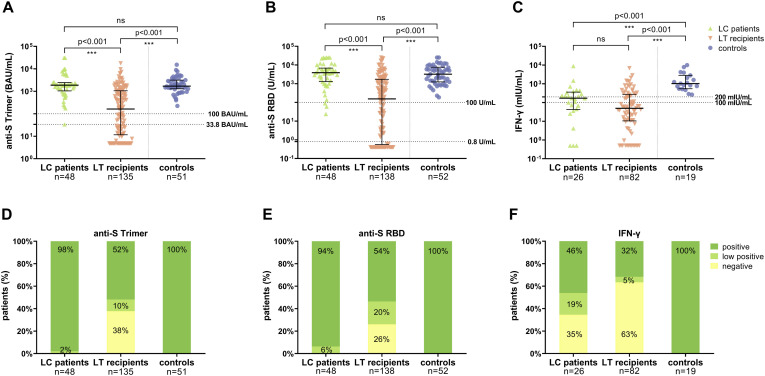
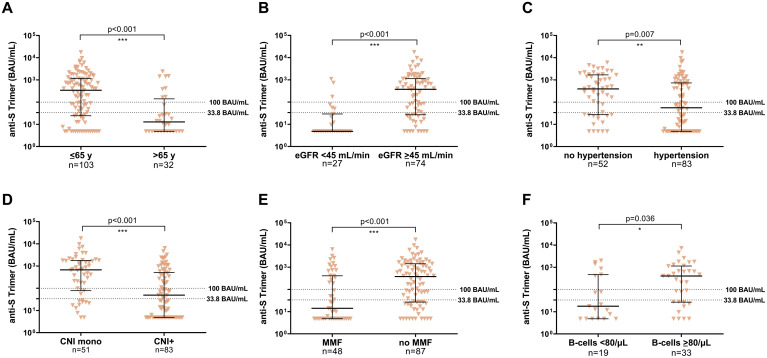
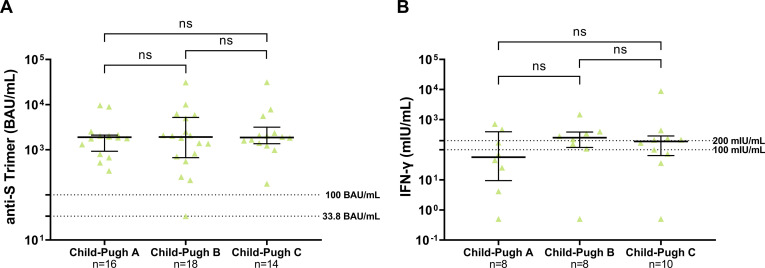
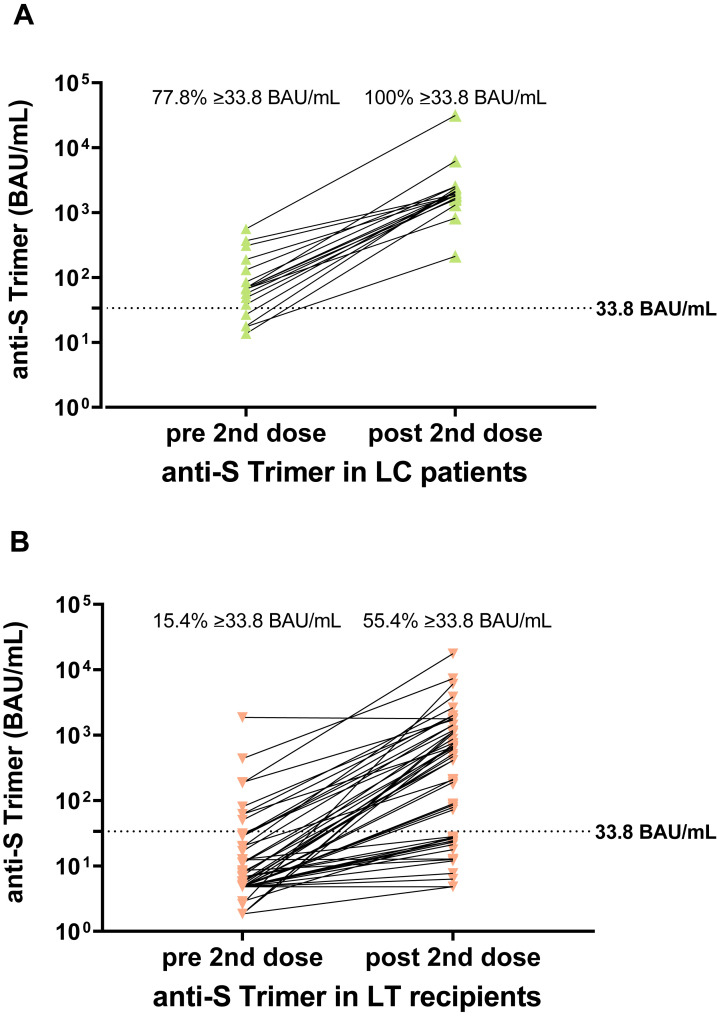
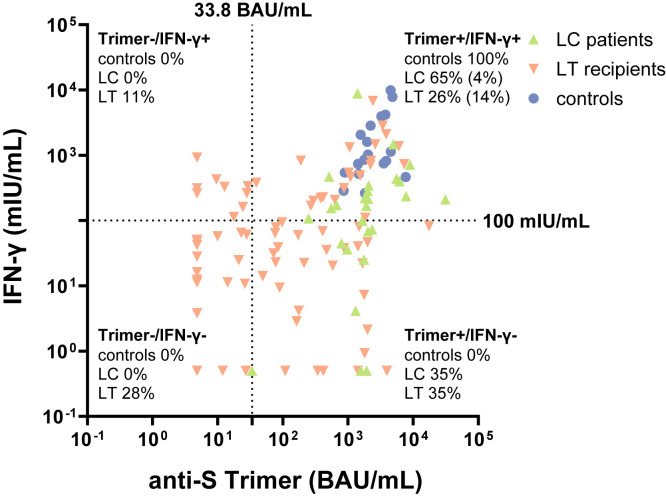
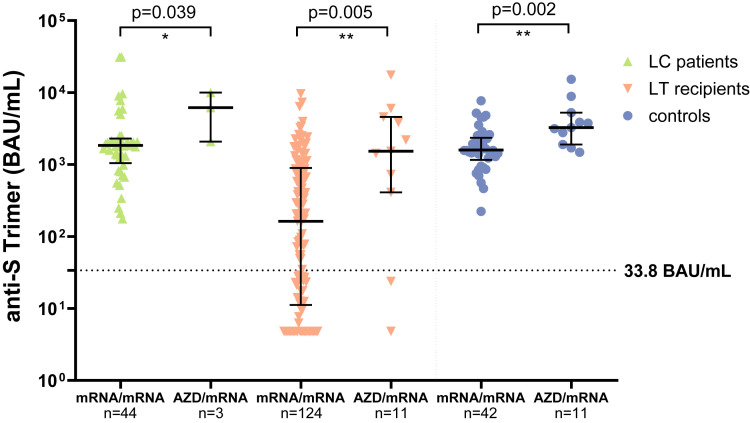
Results: After the second vaccination, seroconversion was achieved in 63% of LT recipients and 100% of cirrhotic patients and controls using the anti-S trimer assay. Median anti-SARS-CoV-2 titers of responding LT recipients were lower compared with cirrhotic patients and controls (P < .001). Spike-specific T-cell response rates were 36.6%, 65.4%, and 100% in LT, cirrhosis, and controls, respectively. Altogether, 28% of LT recipients did neither develop a humoral nor a T-cell response after second vaccination. In LT recipients, significant predictors of absent or low humoral response were age >65 years (odds ratio [OR], 4.57; 95% confidence interval [CI], 1.48-14.05) and arterial hypertension (OR, 2.50; 95% CI, 1.10-5.68), whereas vaccination failure was less likely with calcineurin inhibitor monotherapy than with other immunosuppressive regimens (OR, 0.36; 95% CI, 0.13-0.99).

Conclusion: Routine serological testing of the vaccination response and a third vaccination in patients with low or absent response seem advisable. These vulnerable cohorts need further research on the effects of heterologous vaccination and intermittent reduction of immunosuppression before booster vaccinations.

Keywords: Immunosuppression; Liver Cirrhosis; Liver Transplant Recipients; SARS-CoV-2 Vaccination.


Figures

Figure 1
Figure 1
Flowchart of study cohort.
Figure 2
Figure 2
Serological and T-cell response after second SARS-CoV-2 vaccination in cirrhotic patients, LT recipients, and healthy controls. (A) Anti-S Trimer; (B) anti-S RBD; (C) IFN-γ release. Statistical analysis was performed by Mann-Whitney test. Solid horizontal lines indicate medians and interquartile range; dotted horizontal lines indicate cutoff values for no response, low positive, and positive response. The respective proportions are provided as bar graphs. (D) Anti-S Trimer; (E) anti-S RBD ; (F) IFN-γ release.
Figure 3
Figure 3
All values were measured with anti-S trimer (BAU/mL). (A) Age groups ≤65 years and >65 years. (B) Normal blood pressure vs arterial hypertension. (C) eGFR <45 mL/min vs ≥45 mL/min. (D) CNI mono vs CNI plus additional immunosuppressive drugs. (E) MMF vs no MMF as an additional drug to CNI. (F) Baseline B-lymphocytes <80 and ≥80 per μl. Statistical analysis was performed by Mann-Whitney test. Solid horizontal lines indicate medians and interquartile range; dotted horizontal lines indicate cutoff values.
Figure 4
Figure 4
Comparison of humoral and cellular immune responses in cirrhotic patients. (A) Anti-S Trimer (BAU/mL). (B) IFN-γ release (mIU/mL). Statistical analysis was performed by Mann-Whitney test. Solid horizontal lines indicate medians and interquartile ranges; dotted horizontal lines indicate cutoff values.
Supplementary Figure 1
Comparison of side effects after first and second SARS-CoV-2 vaccination in all patients and in cirrhotic patients with different Child-Pugh classes. Side effects were classified into 5 groups: none, only local, systemic, severe systemic/medication, and hospitalized. (A) Side effects after first vaccination in LC patients, LT recipients, and controls. (B) Side effects after second vaccination in the 3 groups. (C) Side effects after first vaccination in LC patients with different Child-Pugh classes. (D) Side effects after second vaccination in LC patients with different Child-Pugh classes. Statistical analysis was performed by Wilcoxon matched pairs rank test. All P-values were > .05.
Supplementary Figure 2
Comparison of local and systemic side effects after first and second vaccination in cirrhotic patients and LT recipients. Detailed comparison of local and systemic side effects in LC patients and LT recipients. Side effects were classified into mild, moderate, severe, and hospitalized. Medications have been classified only into yes (light green) or no. (A) Side effects after first vaccination in LC patients. (B) Side effects after second vaccination in LC patients. (C) Side effects after first vaccination in LT recipients. (D) Side effects after second vaccination in LT recipients.
Supplementary Figure 3
Correlation of anti-SARS-CoV-2 spike RBD and spike trimer. Correlation between anti-S RBD (U/mL) and anti-S trimer (BAU/mL) for cirrhotic patients (green ascending triangles), LT recipients (orange descending triangles), and controls (blue dots). Statistical analysis was performed by Spearman r with a 95% CI.
Supplementary Figure 4
Comparison of antibody titers after first and second SARS-CoV-2 vaccination. Comparison of anti-S trimer (BAU/mL) titers after first and second SARS-CoV-2 vaccination in cirrhotic patients (green) and LT recipients (orange). (A) Anti-S trimer in cirrhotic patients. (B) Anti-S Trimer in LT recipients. Statistical analysis was performed by Wilcoxon matched pairs rank test. Percentages indicate the seroconversion rate; dotted horizontal lines indicate cutoff values.
Supplementary Figure 5
Correlation between humoral and T-cell immune response. Correlation between humoral and T-cell immune response for cirrhotic patients (green ascending triangles), LT recipients (red descending triangles), and controls (blue dots). Humoral response measured with anti-S trimer (BAU/mL); T-cell response measured with IFN-γ release (mIU/mL). Dotted lines indicate cutoff values. Percentages indicate proportions of values for every patient group. In addition, low positive responses (cutoff values 100 BAU/mL and 200 mIU/mL) are shown in brackets.
Supplementary Figure 6
Humoral immune response for homologous vs heterologous vaccination regimens. Comparison of homologous (mRNA/mRNA) and heterologous (mRNA/AZD1222) vaccination regimens by detection of anti-S trimer (BAU/mL) in cirrhotic patients (green ascending triangles), LT recipients (orange descending triangles), and controls (blue dots). Statistical analysis was performed by Mann-Whitney test. Solid horizontal lines indicate medians and interquartile ranges; dotted horizontal lines indicate cutoff values.
Supplementary Figure 7
Humoral immune response in convalescents after 1 or 2 booster vaccinations. Humoral immune response in patients with previous SARS-CoV-2 infection and 1 or 2 booster mRNA vaccinations by detection of anti-S RBD (U/mL). Cirrhotic patients (green), LT recipients (orange), and controls (blue). Lower dotted horizontal line indicates cutoff value; upper dotted horizontal line indicates maximum value.
Supplementary Figure 8
Humoral immune response over time after second vaccination. Comparison of humoral immune response according to the time point after second SARS-CoV-2 vaccination in cirrhotic patients (green ascending triangles), LT recipients (orange descending triangles), and controls (blue dots). Convalescents were indicated with a black border line and have received 1∗ mRNA booster vaccination. Detection by anti-S trimer titers (BAU/mL).

References

    1. Baden L.R., El Sahly H.M., Essink B., et al. COVE Study Group Efficacy and safety of the mRNA-1273 SARS-CoV-2 vaccine. N Engl J Med. 2021;384:403–416. - PMC - PubMed
    1. Polack F.P., Thomas S.J., Kitchin N., et al. C4591001 Clinical Trial Group. Safety and efficacy of the BNT162b2 mRNA Covid-19 vaccine. N Engl J Med. 2020;383:2603–2615. - PMC - PubMed
    1. Marjot T., Moon A.M., Cook J.A., et al. Outcomes following SARS-CoV-2 infection in patients with chronic liver disease: an international registry study. J Hepatol. 2021;74:567–577. - PMC - PubMed
    1. Webb G.J., Marjot T., Cook J.A., et al. Outcomes following SARS-CoV-2 infection in liver transplant recipients: an international registry study. Lancet Gastroenterol Hepatol. 2020;5:1008–1016. - PMC - PubMed
    1. Boyarsky B.J., Werbel W.A., Avery R.K., et al. Antibody response to 2-dose SARS-CoV-2 mRNA vaccine series in solid organ transplant recipients. JAMA. 2021;325:2204–2206. - PMC - PubMed

LinkOut - more resources