Infection and transmission of SARS-CoV-2 depend on heparan sulfate proteoglycans
- PMID: 34510494
- PMCID: PMC8521309
- DOI: 10.15252/embj.2020106765
Infection and transmission of SARS-CoV-2 depend on heparan sulfate proteoglycans
Abstract
The current pandemic caused by severe acute respiratory syndrome coronavirus 2 (SARS-CoV-2) and outbreaks of new variants highlight the need for preventive treatments. Here, we identified heparan sulfate proteoglycans as attachment receptors for SARS-CoV-2. Notably, neutralizing antibodies against SARS-CoV-2 isolated from COVID-19 patients interfered with SARS-CoV-2 binding to heparan sulfate proteoglycans, which might be an additional mechanism of antibodies to neutralize infection. SARS-CoV-2 binding to and infection of epithelial cells was blocked by low molecular weight heparins (LMWH). Although dendritic cells (DCs) and mucosal Langerhans cells (LCs) were not infected by SARS-CoV-2, both DC subsets efficiently captured SARS-CoV-2 via heparan sulfate proteoglycans and transmitted the virus to ACE2-positive cells. Notably, human primary nasal cells were infected by SARS-CoV-2, and infection was blocked by pre-treatment with LMWH. These data strongly suggest that heparan sulfate proteoglycans are important attachment receptors facilitating infection and transmission, and support the use of LMWH as prophylaxis against SARS-CoV-2 infection.
Keywords: Heparan sulfate proteoglycans; SARS-CoV-2; dendritic cells; epithelial cells; low molecular weight heparins.
© 2021 The Authors. Published under the terms of the CC BY NC ND 4.0 license.
Conflict of interest statement
The authors declare that they have no conflict of interest.
Figures
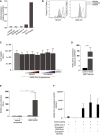
- A
ACE2 expression was measured for different Namalwa Syndecan cell lines in comparison to Huh7.5 cells and ACE2‐transfected 293T cells.
- B
Huh7.5 cells were left untreated or treated with heparinase III for 1 h at 37°C and heparan sulfate or digested heparan sulfate expression was determined by flow cytometry. Cells were stained for HS and diHS respectively or an isotype control mAb, directly corresponding to the specific antibody (mouse IgM and IgG2b). One representative donor out of 3 is depicted.
- C
Cell viability of infected Huh7.5 cells with SARS‐CoV‐2 pseudovirus in presence of different concentrations of UF heparin and LMWH enoxaparin (n = 4 in duplicate).
- D
Cell surface expression of ACE2 on 293T cells (control and ACE2‐transfected) was determined by quantitative real‐time PCR.
- E
SARS‐CoV‐2 pseudovirus infection on 293T cells (control vs ACE2‐transfected cells) was measured by luciferase reporter activity.
- F
SARS‐CoV‐2 isolate binding capacity to hACE2 was measured by quantitative real‐time PCR (ORFb1). SARS‐CoV‐2 isolate (10,000 TCID/ml) was pre‐incubated in presence or absence of different LMWH enoxaparin concentrations (250 IU/ml and 5 IU/ml) and added to a high binding ELISA plate coated with recombinant hACE2 (2 µg/ml). LMWH enoxaparin (n = 3 measured in triplicate).

- A
Huh7.5 cells were pre‐incubated with neutralizing antibody to ACE2 and SARS‐CoV‐2 pseudovirus was pre‐incubated with patient isolated mAb COVA1‐18, COVA1‐21 and COVA2‐15 (10 µg/ml) or UF heparin (250 IU/ml) for 30 min at 37°C. SARS‐CoV‐2 pseudovirus alone or with blocks was added to the cells for 4 h at 4°C and binding was determined by ELISA.
- B
Heparan sulfates were removed from Huh7.5 cells by enzymatic treatment with heparinase III for 1 h at 37°C, then washed, and exposed to SARS‐CoV‐2 pseudovirus for 4 h at 4°C. Treated and untreated cells were subsequently lysed and binding was determined by ELISA.
- C
Flow cytometry analysis of cell surface expression of heparan sulfates (HS) in control transduced cells or upon CRISPR/Cas9‐mediated EXT1 KO (EXT1−/−).
- D
Control and EXT1−/− XG1 cells were exposed to SARS‐CoV‐2 pseudovirus or SARS‐CoV‐2 pseudovirus pre‐treated with 250 IU/ml UF heparin for 30 min at 37°C. After incubation for 4 h at 4°C, cells were lysed and binding was measured by ELISA.
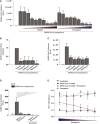
- A
Huh7.5 cells were exposed to SARS‐CoV‐2 pseudovirus directly or after pre‐treatment with different concentrations (0.0001, 0.001, 0.1, 0.5, 1, 5, 50, 100, 250 IU/ml) of UF heparin or LMWH enoxaparin for 30 min at 37°C. Infection was determined by luciferase reporter activity after 5 days.
- B
SARS‐CoV‐2 pseudovirus was pre‐incubated for 30 min at 37°C with UF heparin (250 IU/ml) or LMWH tinzaparin (250 IU/ml) or dalteparin (250 IU/ml) or enoxaparin (250 IU/ml) or nadroparin (250 IU/ml). Huh7.5 was exposed to the SARS‐CoV‐2 pseudovirus, alone or treated with different LMWH for 4 h at 4°C, washed, lysed and binding was determined by ELISA.
- C
SARS‐CoV‐2 pseudovirus was pre‐incubated for 30 min at 37°C with UF heparin (250 IU/ml) or LMWH tinzaparin (250 IU/ml) or dalteparin (250 IU/ml) or enoxaparin (250 IU/ml) or nadroparin (250 IU/ml). Huh7.5 cells were infected with SARS‐CoV‐2 pseudovirus in presence or absence of different LMWH and infection was determined after 5 days by luciferase reporter activity.
- D
293T cells expressing ACE2 were infected with SARS‐CoV‐2 pseudovirus in presence or absence of antibodies against ACE2, UF heparin (250 IU/ml), or LMWH enoxaparin (250 IU/ml), and infection was determined after 3 days by luciferase reporter activity.
- E
VeroE6 cells were infected with SARS‐CoV‐2 isolate (hCoV‐19/Italy; 100 TCID/ml) previously treated with serial dilutions of LMWH enoxaparin. Cell viability was determined using an MTT assay (n = 3 donors measured in triplicate).
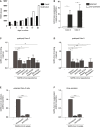
- A
Barrier integrity was analyzed by TEER measurements of Caco‐2 and Calu‐3 over a period of 20 days (n = 3 donors measured in quadruplicate).
- B
ACE2 cell surface expression on Caco‐2 and Calu‐3 was determined by quantitative real‐time PCR.
- C, D
SARS‐CoV‐2 binding was measured in polarized Caco‐2 (C) and Calu‐3 (D) cells in presence or absence of antibodies against ACE2 (cell incubation), and UF heparin (250 IU/ml) or LMWH enoxaparin (250 IU/ml) (virus incubation).
- E, F
Polarized Calu‐3 were inoculated with 0.5 TCID/ml of a SARS‐CoV‐2 isolate (hCoV‐19/Italy) either directly or in presence of antibodies against ACE2 or upon pre‐treatment with LMWH enoxaparin (250 IU/ml) for 30 min at 37°C. Virus was detected by lysing after 48 h through quantitative real‐time PCR of viral RNA (E) and virus production was determined by detection of viral RNA in supernatant using quantitative real‐time PCR (F).
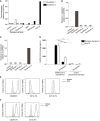
- A
Syndecan 1 and Syndecan 4 expression by Namalwa cell lines, 293T cells, and Huh7.5 cells was detected by quantitative real‐time PCR. Representative data for an experiment repeated more than three times with similar results.
- B, C
Different Namalwa Syndecan cell lines expressing either Syndecan 1 (B) or Syndecan 4 (C), determined by quantitative real‐time PCR.
- D
Huh7.5 cells and Namalwa cells ectopically expressing Syndecan 1 were exposed to SARS‐CoV‐2 pseudovirus or control pseudovirus lacking S protein, in presence or absence of LMWH enoxaparin (250 IU/ml). Binding was measured after 4 h at 4°C by ELISA.
- E
DCs were stained with antibodies against the surface markers CD209, CD14, and CD11b and analyzed by flow cytometry.
- F
LCs were stained with antibodies against CD207 and CD1a and analyzed by flow cytometry. The histogram shows the cell surface expression of the receptor.

- A
Namalwa cells ectopically expressing either Syndecan 1 or 4 were exposed to either SARS‐CoV‐2 pseudovirus alone or SARS‐Cov‐2 pseudovirus pre‐treated with UF heparin (250 IU/ml) or LMWH enoxaparin (250 IU/ml) for 30 min at 37°C. Binding was measured after 4 h at 4°C by ELISA.
- B
SARS‐CoV‐2 isolate (hCoV‐19/Italy) was pre‐incubated with LMWH enoxaparin (250 IU/ml) for 30 min at 37°C. Namalwa cells expressing Syndecan 1 and 4 were exposed to either SARS‐CoV‐2 isolate (100 TCID/ml) or SARS‐CoV‐2 isolate (100 TCID/ml) pre‐treated with LMWH enoxaparin (250 IU/ml) for 4 h at 4°C and binding was determined by quantitative real‐time PCR.
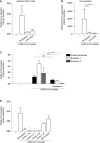
- A, B
Polarized Calu‐3 were infected with SARS‐CoV‐2 isolate (hCoV‐19/Italy, 0.5 TCID/ml) in presence or absence of antibodies against ACE2 or LMWH enoxaparin (250 IU/ml). Virus was detected after lysis by quantitative real‐time PCR of viral RNA (A) and virus production was determined by detecting viral RNA in supernatant using quantitative real‐time PCR (B).
- C
SARS‐CoV‐2 isolate (hCoV‐19/Italy) was pre‐incubated with LMWH enoxaparin (250 IU/ml) for 30 min at 37°C. Namalwa cells expressing Syndecan 1 and 4 were exposed to 100 TCID/ml SARS‐CoV‐2 isolate for 4 h at 4°C and binding was determined by quantitative real‐time PCR.
- D
SARS‐CoV‐2 isolate (hCoV‐19/Italy, 100 TICD/ml) was added to Namalwa cells expressing Syndecan 1 either directly or after pre‐incubation for 30 min at 37°C with LMWH enoxaparin (250 IU/ml) or neutralizing antibodies (COVA1‐18, 1‐21, and 2‐15), non‐neutralizing antibody (COVA1‐27) and a human IgG1 isotype control at the concentration of 1 pg/ml. Detection of viral binding to Syndecan 1‐expressing Namalwa was measured after 4 h at 4°C by quantitative real‐time PCR.

- A
SARS‐CoV‐2 pseudovirus was pre‐treated with LMWH enoxaparin (250 IU/ml), or different neutralizing antibodies against SARS‐CoV‐2 (COVA1‐18, COVA1‐21 and COVA2‐15) and a human IgG1 isotype control at concentrations of 100 pg/ml, 500 pg/ml, 1 ng/ml, 5 ng/ml, 10 ng/ml, and 50 ng/ml for 30 min at 37°C. Binding of pseudovirus to Syndecan 1‐expressing Namalwa cells in absence or presence of LMWH enoxaparin or antibodies was determined by ELISA.
- B
SARS‐CoV‐2 isolate (hCoV‐19/Italy) was pre‐treated for 30 min at 37°C with either LMWH enoxaparin (250 IU/ml) or one of the following neutralizing antibodies (COVA1‐18, 1‐21, and 2‐15), a non‐neutralizing antibody (COVA1‐27), or a human IgG1 isotype control, all at the concentration of 1 pg/ml. SARS‐CoV‐2 isolate alone or with blocks was added at a concentration of 100 TICD/ml. Detection of virus binding to Syndecan 1‐expressing Namalwa cells was measured by quantitative real‐time PCR.

- A, B
SARS‐CoV‐2 binding to monocyte‐derived DCs (A) or primary LCs (B) in absence or presence of UF heparin (250 IU/ml) or LMWH enoxaparin (250 IU/ml).
- C
DCs and LCs were infected with SARS‐CoV‐2 pseudovirus and infection was determined after 5 days by measuring luciferase reporter activity. As positive controls, Huh7.5 cells were infected.
- D
ACE2 cell surface expression on DCs, LCs, and Huh7.5 cells. Representative data for an experiment repeated more than three times with similar results (n = 3 in duplicate).
- E
Graphical overview of the cell‐to‐cell viral transmission assay.
- F, G
DCs (F) and LCs (G) were pre‐incubated with SARS‐CoV‐2 pseudovirus for 4 h at 37°C in presence or absence of UF heparin (250 IU/ml) or LMWH enoxaparin (250 IU/ml), extensively washed, and co‐cultured with Huh7.5 cells. Transmission by DCs or LCs to Huh7.5 cells was determined by luciferase reporter activity.
- H, I
SARS‐CoV‐2 isolate (hCoV‐19/Italy) was pre‐treated with LMWH enoxaparin (250 IU/ml) for 30 min at 37°C. DCs (H) and LCs (I) were exposed to either the untreated or pre‐treated SARS‐CoV‐2 isolate (100 TCID/ml) for 24 h, washed thoroughly, and co‐cultured with Huh7.5 cells. Quantification of viral RNA was measured by quantitative real‐time PCR.
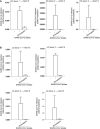
- A, B
SARS‐CoV‐2 isolate (hCoV‐19/Italy, 100 TCID/ml) was either pre‐treated with LMWH enoxaparin (250 IU/ml) for 30 min at 37°C. DCs (n = 3 independent donors) (A) and LCs (B) were exposed to untreated or pre‐treated SARS‐CoV‐2 (isolated for 24 h, washed thoroughly, and subsequently co‐cultured with Huh7.5 cells for another 24 h). Quantification of viral RNA was measured by quantitative real‐time PCR of Huh7.5 cells after removal of DCs or LCs.

- A
Flow cytometry analysis of single‐cell suspensions from the nasal epithelium. Cells were labeled with EpCAM and CD45 antibodies and gated accordingly.
- B
ACE2, Syndecan 1, and Syndecan 4 cell surface expression on nasal epithelial cells, compared to polarized epithelial Calu‐3 cells was confirmed by quantitative real‐time PCR.
- C, D
Nasal epithelial cells were exposed to SARS‐CoV‐2 isolate (hCoV‐19/Italy, 100 TCID/ml) either directly or after pre‐treatment with antibodies against ACE2 cell surface receptors (1 h at 37°C) or after pre‐treatment with LMWH enoxaparin (250 IU/ml) for 30 min at 37°C. Detection of viral binding after 4 h at 4°C (C) and persistently infected cells lysed after 24 h at 37°C (D) was determined by quantitative real‐time PCR.
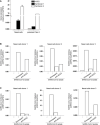
- A
ACE2, Syndecan 1, and Syndecan 4 cell surface expression on nasal cells compared to polarized epithelial Calu‐3 was confirmed by quantitative real‐time PCR.
- B, C
Nasal epithelial cells were exposed to SARS‐CoV‐2 isolate (hCoV‐19/Italy, 100 TCID/ml) either directly or in presence of antibodies against ACE2 or after pre‐incubation with LMWH LMWH enoxaparin (250 IU/ml). Detection of viral binding (B) and persistently infected cells (C) was determined by quantitative real‐time PCR.
References
-
- Artursson P, Palm K, Luthman K (2001) Caco‐2 monolayers in experimental and theoretical predictions of drug transport. Adv Drug Deliv Rev 46: 27–43 - PubMed
Publication types
MeSH terms
Substances
Grants and funding
- 114025008/ZonMw (Netherlands Organisation for Health Research and Development) and Stichting Proefdiervrij (MKMD COVID-19)
- 446002508/ZonMw (Netherlands Organisation for Health Research and Development)
- 670424/EC | H2020 | H2020 Priority Excellent Science | H2020 European Research Council (ERC)
- Amsterdam UMC PhD Grant
- Amsterdam institute for Infection and Immunity COVID-19 grant
LinkOut - more resources
Full Text Sources
Medical
Molecular Biology Databases
Miscellaneous

