. 2022 Mar;75(3):550-566.
doi: 10.1002/hep.32149. Epub 2021 Dec 15.

Mitochondrial bioenergetics boost macrophage activation, promoting liver regeneration in metabolically compromised animals

Affiliations

Mitochondrial bioenergetics boost macrophage activation, promoting liver regeneration in metabolically compromised animals

Naroa Goikoetxea-Usandizaga et al. Hepatology. 2022 Mar.

Erratum in

  • Erratum.
    [No authors listed] [No authors listed] Hepatology. 2022 Aug;76(2):532. doi: 10.1002/hep.32505. Epub 2022 Apr 22. Hepatology. 2022. PMID: 35451511 Free PMC article. No abstract available.

Abstract

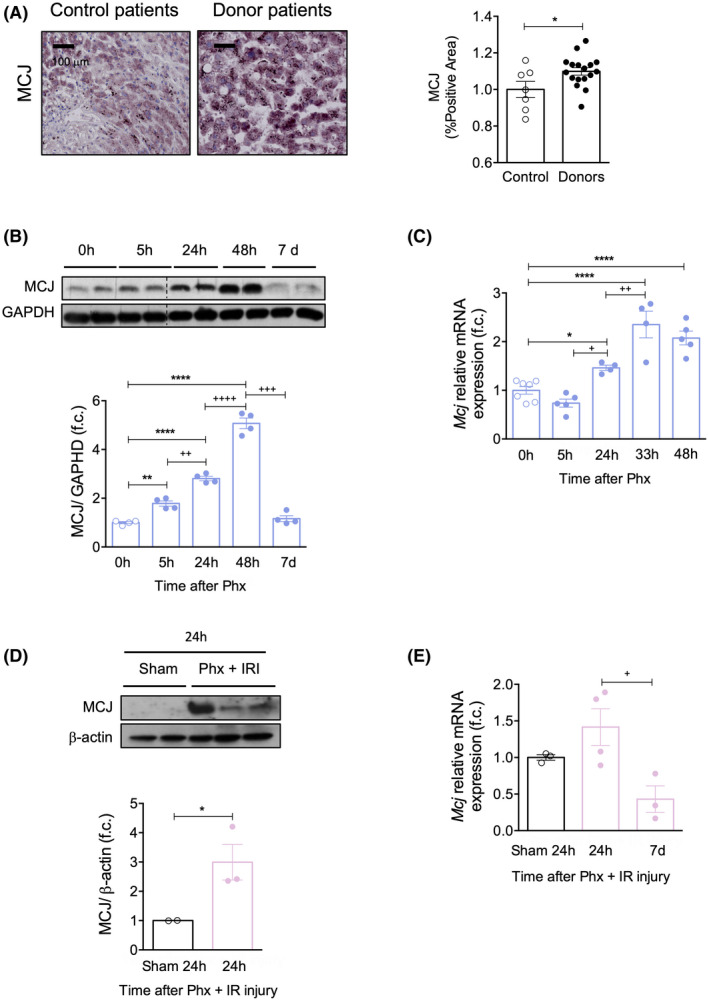
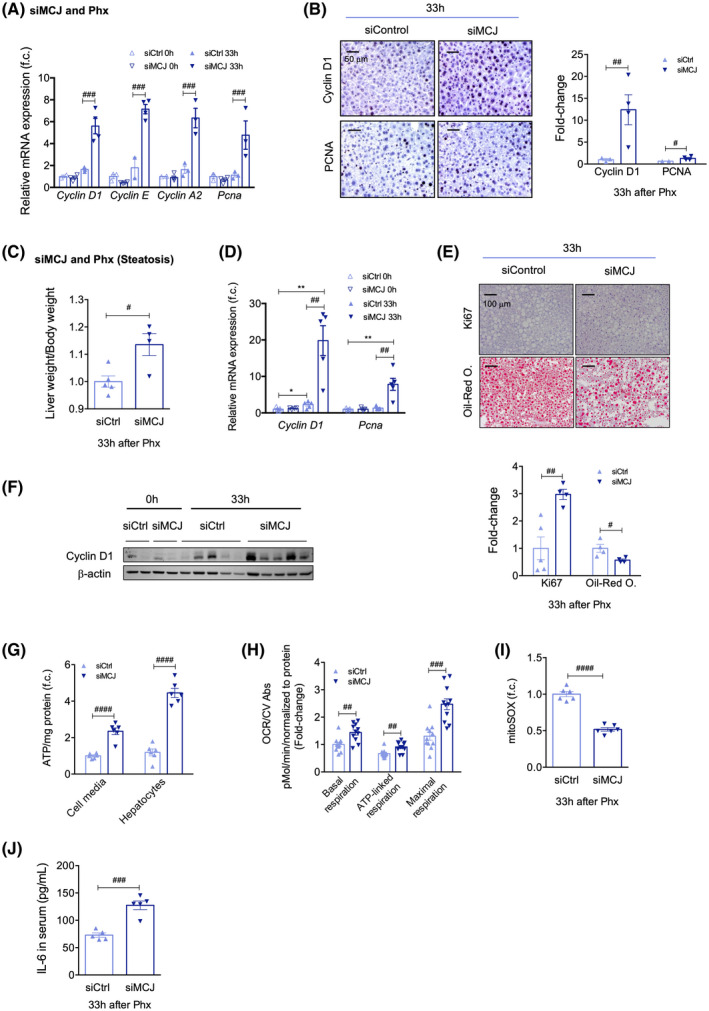
Background and aims: Hepatic ischemia-reperfusion injury (IRI) is the leading cause of early posttransplantation organ failure as mitochondrial respiration and ATP production are affected. A shortage of donors has extended liver donor criteria, including aged or steatotic livers, which are more susceptible to IRI. Given the lack of an effective treatment and the extensive transplantation waitlist, we aimed at characterizing the effects of an accelerated mitochondrial activity by silencing methylation-controlled J protein (MCJ) in three preclinical models of IRI and liver regeneration, focusing on metabolically compromised animal models.

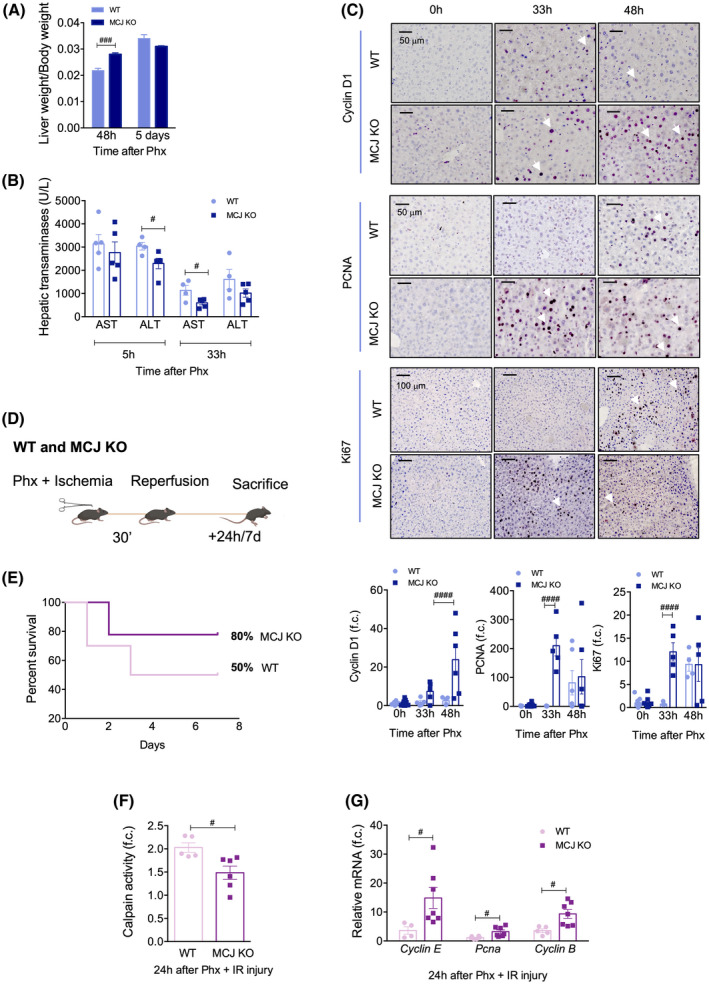
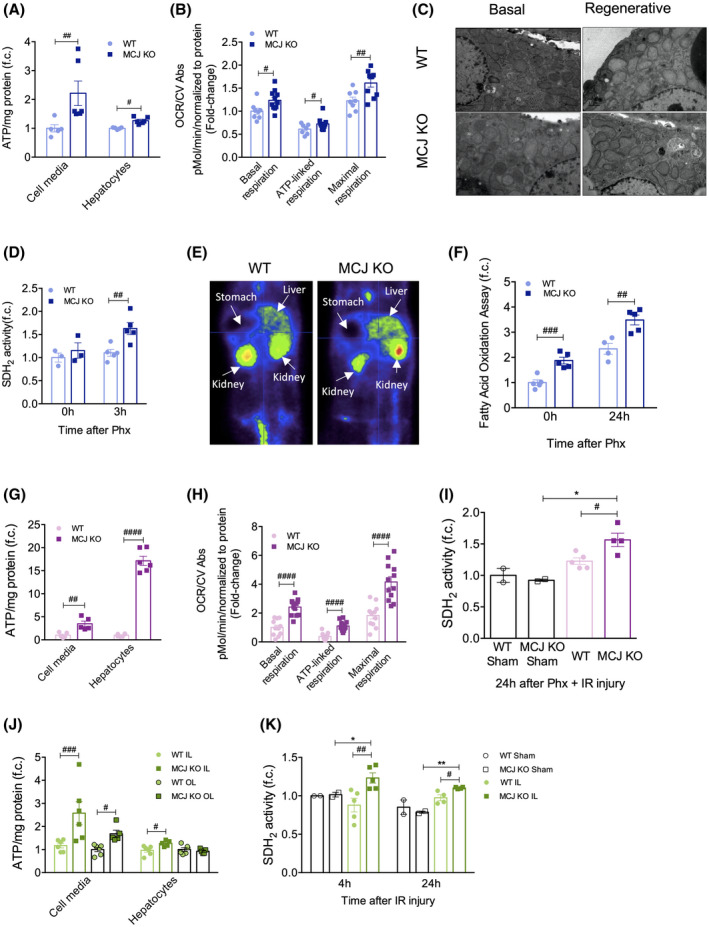
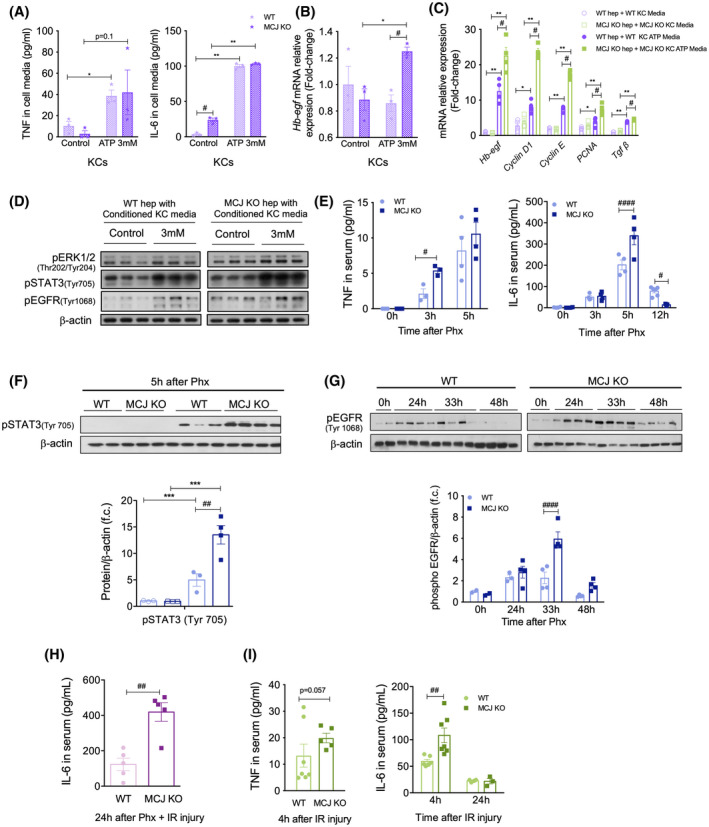
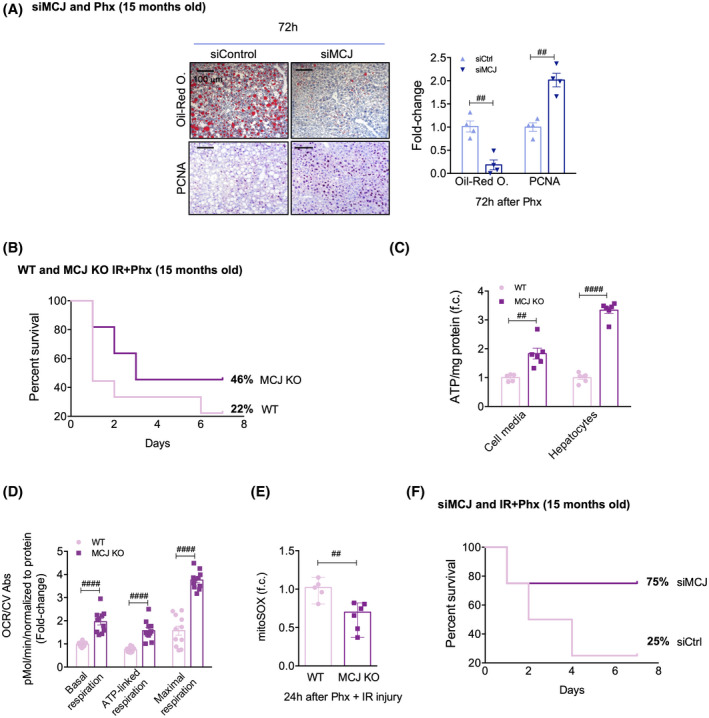
Approach and results: Wild-type (WT), MCJ knockout (KO), and Mcj silenced WT mice were subjected to 70% partial hepatectomy (Phx), prolonged IRI, and 70% Phx with IRI. Old and young mice with metabolic syndrome were also subjected to these procedures. Expression of MCJ, an endogenous negative regulator of mitochondrial respiration, increases in preclinical models of Phx with or without vascular occlusion and in donor livers. Mice lacking MCJ initiate liver regeneration 12 h faster than WT and show reduced ischemic injury and increased survival. MCJ knockdown enables a mitochondrial adaptation that restores the bioenergetic supply for enhanced regeneration and prevents cell death after IRI. Mechanistically, increased ATP secretion facilitates the early activation of Kupffer cells and production of TNF, IL-6, and heparin-binding EGF, accelerating the priming phase and the progression through G1 /S transition during liver regeneration. Therapeutic silencing of MCJ in 15-month-old mice and in mice fed a high-fat/high-fructose diet for 12 weeks improves mitochondrial respiration, reduces steatosis, and overcomes regenerative limitations.

Conclusions: Boosting mitochondrial activity by silencing MCJ could pave the way for a protective approach after major liver resection or IRI, especially in metabolically compromised, IRI-susceptible organs.


Conflict of interest statement

Dr. Martínez‐Chantar advises for Mitotherapeutix LLC. All other authors have nothing to disclose.

Figures

FIGURE 1
FIGURE 1
MCJ expression is increased in ischemic injury and graft regeneration. (A) Liver biopsies from transplant donors, 60 min after the start of normothermic regional perfusion (n = 17), and from healthy control individuals (n = 7) where MCJ expression was determined by immunohistochemistry (left panel) and quantified (right panel). Scale bar, 50 µm. Values are represented as median ± range. The U test was used to compare two groups. (B) MCJ levels by western blotting (upper panel) and densitometric quantification (bottom panel) in WT liver extracts at different time points after 70% Phx. Glyceraldehyde 3‐phosphate dehydrogenase was used as a loading control. (C) Mcj mRNA levels in WT liver extracts at different time points after 70% Phx. At least n = 4 were used for each experimental group. (D) MCJ levels by western blotting (upper panel) and densitometric quantification (bottom panel) in WT liver extracts at different time points after 70% Phx under IRI. ß‐Actin was used as a loading control. (E) Mcj mRNA levels in WT liver extracts at different time points after 70% Phx under IRI. n = 3 were used for sham‐operated mice, and n = 10 underwent 70% Phx under IRI. Values are represented as mean ± SEM. The Student t test was used to compare two groups, and one‐way ANOVA followed by Sidak’s posttest was used to compare multiple groups. *p < 0.05, **p < 0.01, and ****p < 0.0001 versus control and + p < 0.05, ++ p < 0.01, +++ p < 0.001, and ++++ p < 0.0001 versus the indicated time points. f.c., fold change
FIGURE 2
FIGURE 2
Lack of MCJ enhances graft regeneration, reduces ischemic damage, and increases survival after both 70% Phx and 70% Phx under IRI. (A) Liver weight/body weight ratio in WT and MCJ KO mice 2 and 5 days after 70% Phx. (B) Serum aspartate aminotransferase and alanine aminotransferase levels in WT and MCJ KO mice 5 and 33 h after 70% Phx. (C) Liver immunohistochemical staining and respective quantification for Cyclin D1, Ki67, and PCNA at 0, 24, 33, and 48 h after 70% Phx in WT versus MCJ KO. Scale bar, 50 µm. (D) Flowchart summarizing 70% Phx under 30 min IRI. (E) Survival percent 7 days after 70% Phx under IRI, WT (n = 10) versus MCJ KO (n = 10). (F) Hepatic calpain activity measured in WT and MCJ KO mice that underwent the procedure (n = 10) 24 h after 70% Phx under IRI, relative to sham‐operated mice (n = 2). (G) Differential expression of mRNA levels from genes involved in the cell cycle in WT and MCJ KO mice, relative to sham‐operated mice, 24 h after 70% Phx under IRI. Values are represented as mean ± SEM. Two‐way ANOVA followed by Sidak’s posttest was used to compare multiple groups. # p < 0.05, ### p < 0.001, and #### p < 0.0001 versus MCJ KO. ALT, alanine aminotransferase; AST, aspartate aminotransferase; f.c., fold change
FIGURE 3
FIGURE 3
Lack of MCJ increases ATP production following 70% Phx with or without IRI and after prolonged IRI. (A) Cell media and hepatocyte ATP production in primary WT and MCJ KO hepatocytes, perfused 24 h after 70% Phx. At least quadruplicates were used for each experimental condition. (B) Basal, ATP‐linked, and maximal respirations using the Mitostress assay in primary WT and MCJ KO hepatocytes, perfused 3 h after 70% Phx. At least quadruplicates were used for each experimental condition. (C) Electron microscopy of epon‐embedded cell sections showing the number of mitochondria and mitochondrial morphology in basal conditions and 24 h after 70% Phx at ×2500 magnification (scale bar, 1 µm). (D) Hepatic SDH2 activity was measured in basal conditions and 3 h after 70% Phx in WT versus MCJ KO mice. (E) Study of the hepatic uptake of 18F fluorodeoxyglucose using a PET‐CT scan 24 h after 70% Phx in WT and MCJ KO mice. (F) Fatty acid oxidation rate was assayed in liver tissue at basal conditions and 24 h after 70% Phx. (G) Extracellular and intracellular ATP content in WT and MCJ KO primary hepatocytes, perfused 24 h after 70% Phx under IRI. (H) Basal, ATP‐linked, and maximal respirations using the Mitostress assay in primary WT and MCJ KO hepatocytes, perfused 24 h after 70% Phx under IRI. At least quadruplicates were used for each experimental condition. (I) Hepatic SDH2 activity was measured in WT and MCJ KO mice, both in sham‐operated and in those that underwent the procedure, 24 h after 70% Phx under IRI. (J) Cell media and hepatocyte ATP production in primary WT and MCJ KO hepatocytes, perfused 24 h after IRI. Hepatocytes coming from both the ischemic and the oxygenated lobes were analyzed separately. At least sextuplicates were used for each experimental condition. (K) Hepatic SDH2 activity was measured in WT and MCJ KO mice, both in sham‐operated and in those that underwent the procedure, 4 and 24 h after IRI. Values are represented as mean ± SEM. Two‐way ANOVA followed by Sidak’s posttest was used to compare multiple groups. # p < 0.05, ## p < 0.01, ### p < 0.001, and #### p < 0.0001 versus MCJ KO and *p < 0.05 versus sham‐operated. CV Abs, crystal violet absorbance; f.c., fold change; IL, ischemic lobe; OCR, oxygen consumption rate; OL, oxygenated lobe
FIGURE 4
FIGURE 4
Absence of MCJ accelerates the priming phase due to increased extracellular ATP levels. (A) Cell media TNF and IL‐6 levels from stimulated and nonstimulated WT and MCJ KO hepatic Kupffer cells. Cells were stimulated with 3 mM ATP for 4 h. (B) mRNA levels of HbEgf, Cyclin D1, Cyclin E, PCNA, and Tgf‐β in WT and MCJ KO hepatocytes following 24 h of treatment with stimulated and nonstimulated WT and MJC KO Kupffer cell–derived conditioned media. (C) Western blot analysis of total protein levels of phosphorylated (p‐) ERK1/2 (Thr 202/Tyr 204), pSTAT3 (Tyr 705), and pEGFR (Tyr1068) in WT and MCJ KO hepatocytes following 4 h of treatment with stimulated and nonstimulated WT and MCJ KO Kupffer cell–derived conditioned media. ß‐Actin was used as a loading control. (D) Serum TNF and IL‐6 levels, measured by ELISA, at the indicated time points after 70% Phx in WT versus MCJ KO mice. (E) Western blot analysis (upper panel) and densitometric quantification (bottom panel) of total protein levels of pSTAT3 5 h after Phx. ß‐Actin was used as a loading control. (F) Western blot analysis (upper panel) and densitometric quantification (bottom panel) of total protein levels of pEGFR at 24, 33, and 48 h after 70% Phx. ß‐Actin was used as a loading control. (G) Serum IL‐6 levels in WT and MCJ KO mice 24 h after 70% Phx under IRI. (H) Serum TNF and IL‐6 levels in WT and MCJ KO mice 24 h after IRI. Values are represented as mean ± SEM. The Student t test was used to compare two groups, and one‐way ANOVA followed by Sidak’s posttest was used to compare multiple groups. *p < 0.05, **p < 0.01, and ***p < 0.001 versus control and # p < 0.05, ## p < 0.01, and #### p < 0.0001 versus MCJ KO. f.c., fold change; KC, Kupffer cell
FIGURE 5
FIGURE 5
Targeting MCJ overcomes regenerative limitations associated with steatosis. (A) Differential expression of mRNA levels from genes involved in the cell cycle in siCtrl versus siMCJ WT mice, compared to basal, 33 h after 70% Phx. (B) Liver immunohistochemical staining and respective quantification for Cyclin D1 and PCNA, proliferative markers, 33 h after 70% Phx, in siCtrl versus siMCJ WT mice. Scale bar, 50 µm. (C) Liver weight/body weight ratio in siCtrl versus siMCJ WT mice, maintained on a 12‐week HFHFD, 33 h after 70% Phx. (D) Differential expression of mRNA levels from genes involved in the cell cycle in siCtrl versus siMCJ WT mice, maintained on a 12‐week HFHFD, 33 h after 70% Phx. (E) Liver immunohistochemical staining (upper panel) and respective quantification (bottom panel) for Ki67, a proliferative marker, and oil red O, a marker for hepatic steatosis, in siCtrl versus siMCJ WT mice, maintained on a 12‐week HFHFD, 33 h after 70% Phx. Scale bar, 100 µm. (F) Western blot analysis of total protein levels of Cyclin D1 33 h after 70% Phx in siCtrl versus siMCJ WT mice, maintained on a 12‐week HFHFD. ß‐Actin was used as a loading control. (G) Extracellular and intracellular ATP content in primary hepatocytes of siCtrl and siMCJ WT mice, maintained on a 12‐week HFHFD that were perfused 33 h after 70% Phx. At least sextuplicates were used for each experimental condition. (H) The OCR and basal, ATP‐linked, and maximal respirations using the Mitostress assay in primary hepatocytes of siCtrl and siMCJ WT mice, maintained on a 12‐week HFHFD, perfused 33 h after 70% Phx. At least quadruplicates were used for each experimental condition. (I) Mitochondrial ROS in primary hepatocytes of siCtrl and siMCJ WT mice, maintained on a 12‐week HFHFD, perfused 33 h after 70% Phx, using MitoSOX staining. At least sixtuplicates were used for each experimental condition. (J) Serum IL‐6 levels, measured by ELISA, 33 h after 70% Phx, in siCtrl versus siMCJ WT mice, maintained on a 12‐week HFHFD. Values are represented as mean ± SEM. The Student t test was used to compare two groups, and two‐way ANOVA followed by Sidak’s posttest was used to compare multiple groups. *p < 0.05 and **p < 0.01 versus basal and # p < 0.05, ## p < 0.01, ### p < 0.001, and #### p < 0.0001 versus MCJ KO. CV Abs, crystal violet absorbance; f.c., fold change
FIGURE 6
FIGURE 6
Targeting MCJ overcomes regenerative and survival limitations associated with aging. (A) Picture of the extracted livers and the liver weight/body weight ratio in siCtrl and siMCJ WT mice 72 h after 70% Phx. (B) Liver immunohistochemical staining and respective quantification for oil red O staining, a marker for hepatic steatosis, and for PCNA, a proliferative marker, 72 h after 70% Phx in siCtrl versus siMCJ WT. Scale bar, 100 µm. (C) Survival percent 7 days after 70% Phx under IRI in 15‐month‐old WT (n = 9) and MCJ KO (n = 11) mice. (D) Cell media and hepatocyte ATP production in primary hepatocytes of 15‐month‐old WT and MCJ KO mice, perfused 24 h after 70% Phx under IRI. At least sextuplicates were used for each experimental condition. (E) Basal, ATP‐linked, and maximal respirations using the Mitostress assay in primary hepatocytes of 15‐month‐old WT and MCJ KO mice perfused 24 h after 70% Phx under IRI. At least quadruplicates were used for each experimental condition. (F) Mitochondrial ROS in primary hepatocytes of 15‐month‐old WT and MCJ KO mice, perfused 24 h after 70% Phx under IRI, using MitoSOX staining. At least quadruplicates were used for each experimental condition. (G) Survival percent 7 days after 70% Phx under IRI in 15‐month‐old siCtrl (n = 4) versus siMCJ (n = 4) WT mice. Values are represented as mean ± SEM. The Student t test was used to compare two groups, and two‐way ANOVA followed by Sidak’s posttest was used to compare between multiple groups. ## p < 0.01 and #### p < 0.0001 versus MCJ KO. CV Abs, crystal violet absorbance; f.c., fold change

References

    1. Trapero‐Marugán M, Little EC, Berenguer M. Stretching the boundaries for liver transplant in the 21st century. Lancet Gastroenterol Hepatol. 2018;3:803–11. - PubMed
    1. Jadlowiec CC, Taner T, Von WJ. Liver transplantation current status and challenges. World J Gastroenterol. 2016;22:4438–45. - PMC - PubMed
    1. Younossi ZM, Koenig AB, Abdelatif D, Fazel Y, Henry L, Wymer M, et al. Global epidemiology of nonalcoholic fatty liver disease—meta‐analytic assessment of prevalence, incidende, and outcomes. Hepatology. 2016;64:73–84. - PubMed
    1. Vinaixa C, Selzner N, Berenguer M. Fat and liver transplantation: clinical implications. Transpl Int. 2018;31:828–37. - PubMed
    1. Jaime FD, Berenguer M, Fernando A, Martorell A. Pushing the donor limits: deceased donor liver transplantation using organs from octogenarian donors. Liver Transplant. 2017;23:S22–6. - PubMed

Publication types

MeSH terms