. 2021 Sep 13;22(9):3800-3809.
doi: 10.1021/acs.biomac.1c00643. Epub 2021 Aug 17.

Thermal Conductivity of Cellulose Fibers in Different Size Scales and Densities

Affiliations

Thermal Conductivity of Cellulose Fibers in Different Size Scales and Densities

Mathis Antlauf et al. Biomacromolecules. .

Abstract

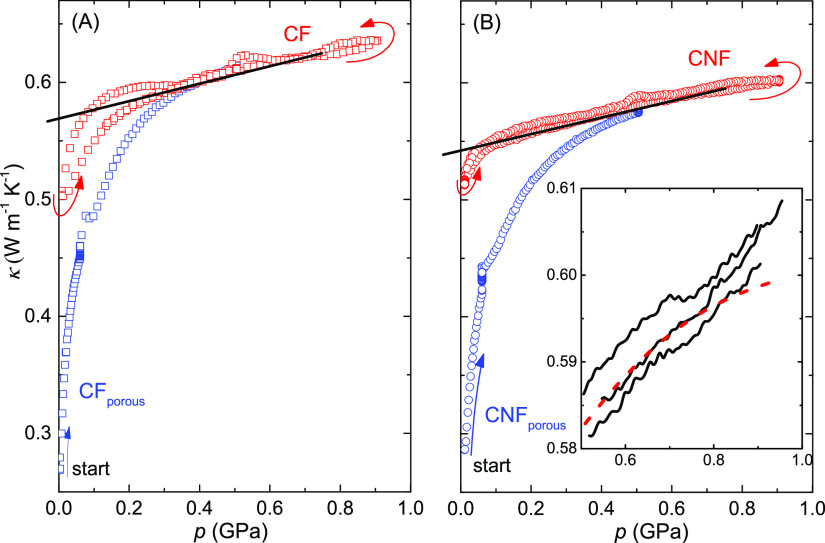
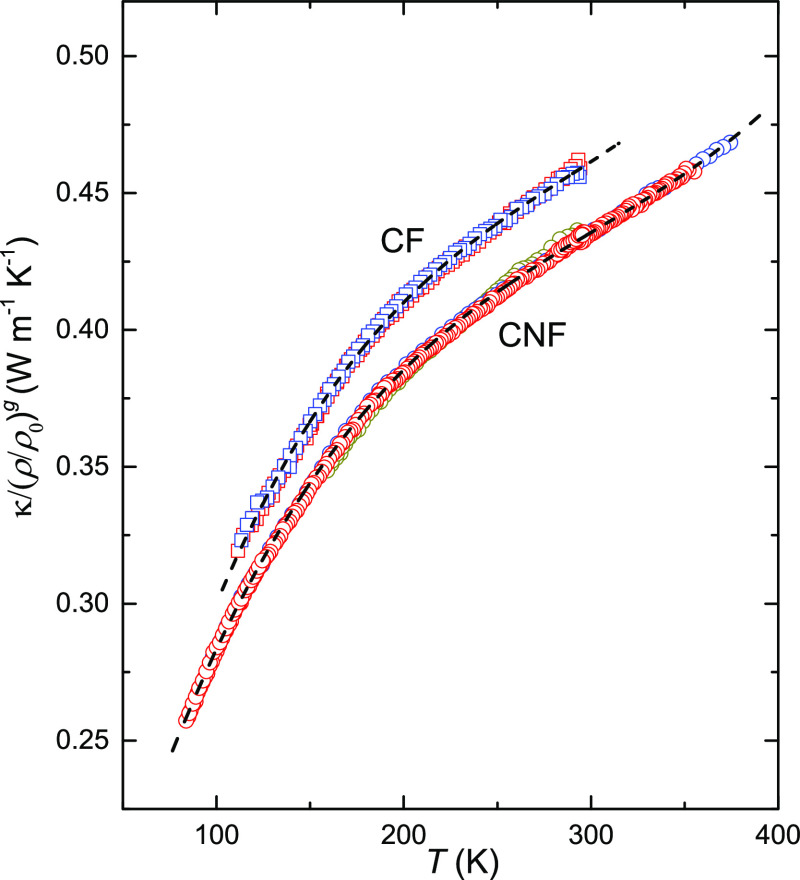
Considering the growing use of cellulose in various applications, knowledge and understanding of its physical properties become increasingly important. Thermal conductivity is a key property, but its variation with porosity and density is unknown, and it is not known if such a variation is affected by fiber size and temperature. Here, we determine the relationships by measurements of the thermal conductivity of cellulose fibers (CFs) and cellulose nanofibers (CNFs) derived from commercial birch pulp as a function of pressure and temperature. The results show that the thermal conductivity varies relatively weakly with density (ρsample = 1340-1560 kg m-3) and that its temperature dependence is independent of density, porosity, and fiber size for temperatures in the range 80-380 K. The universal temperature and density dependencies of the thermal conductivity of a random network of CNFs are described by a third-order polynomial function (SI-units): κCNF = (0.0787 + 2.73 × 10⁻³·T - 7.6749 × 10⁻⁶·T2 + 8.4637 × 10⁻⁹·T3)·(ρsample0)2, where ρ0 = 1340 kg m-3 and κCF = 1.065·κCNF. Despite a relatively high degree of crystallinity, both CF and CNF samples show amorphous-like thermal conductivity, that is, it increases with increasing temperature. This appears to be due to the nano-sized elementary fibrils of cellulose, which explains that the thermal conductivity of CNFs and CFs shows identical behavior and differs by only ca. 6%. The nano-sized fibrils effectively limit the phonon mean free path to a few nanometers for heat conduction across fibers, and it is only significantly longer for highly directed heat conduction along fibers. This feature of cellulose makes it easier to apply in applications that require low thermal conductivity combined with high strength; the weak density dependence of the thermal conductivity is a particularly useful property when the material is subjected to high loads. The results for thermal conductivity also suggest that the crystalline structures of cellulose remain stable up to at least 0.7 GPa.


Conflict of interest statement

The authors declare no competing financial interest.

Figures

Figure 1
Figure 1
XRD pattern of CNFs before the high-pressure experiment showing the contributions of instrumental background (white), mathematical background = amorphous sample background (gray) and the cellulose Bragg reflections (green). By choosing a 4th order Chebychev polynomial function to model the amorphous sample background (mathematical background), a profile fit of the whole pattern was achieved assuming a mixture of celluloses Iα and Iβ; this resulted in a CIarea = 37.4%.
Figure 2
Figure 2
TGA of CFs and CNFs before and after the high-pressure experiment, which included heating up to 423 K at 0.9 GPa (HPHT). Residual moisture in the samples was ca. 3 wt % before the experiment (stored in a desiccator) and up to ca. 5 wt % after the experiment.
Figure 3
Figure 3
Density of a CF sample plotted against pressure. Blue filled circles show the results during the initial pressurization up to 0.1 GPa. Red open circles show the results during second pressurization—a sample plate lubed slightly with molybdenum sulfide. These measurements mimic the experimental procedure of first producing sample plates by pressurization up to 0.1 GPa and thereafter repressurizing the plates while measuring the thermal conductivity. The same results shown in the inset suggest that compressed CF particles attain the nonporous density of slightly higher than 1500 kg m–3 at a pressure below 0.5 GPa, which is also indicated by the measurements of thermal conductivity.
Figure 4
Figure 4
Thermal conductivity plotted against temperature at the pressures indicated: (A) CF and (B) CNF. The porous samples have an estimated porosity ε = 0.11 and a density of 1340 kg m–3. The top panel shows a schematic view of the frequent phonon scattering due to the boundaries and amorphous fractions of the nano-sized elemental fibrils (magenta dots), which causes an amorphous-like (positive) temperature dependence of κ.
Figure 5
Figure 5
Thermal conductivity plotted against pressure at 295 K: (A) CF and (B) CNF. The increase in κ of porous samples at 0.06 GPa is due to a sluggish relaxation (densification) observed during 14 h (CF) and 10 h (CNF) measurements at constant temperature and pressure. (The small bump in κ observed at 0.5 GPa on depressurization is due to an exothermic transition in the sample cell material—Teflon; this causes a slight rise in Teflon temperature and volume.) The black lines show extrapolations of κ(p) of nonporous samples down to atmospheric pressure, which yields 0.57 W m–1 K–1 for CF and 0.54 W m–1 K–1 for CNF. (κ of nonporous samples varies typically linearly with pressure in a pressure range with constant compressibility.,) The inset shows an expanded view of results for three separate runs of CNF measured on increasing pressure (solid lines) and a dashed red line representing the typical pressure dependence of κ in the absence of a transformation in the sample.
Figure 6
Figure 6
Natural logarithm of the thermal conductivity plotted against the natural logarithm of density. Results for porous and nonporous CF (squares) and CNF (circles) samples. The dashed lines represent linear fits with the Bridgman parameter g corresponding to the slope. The filled symbols represent measured data at 0.06 GPa and values for the nonporous samples at 1 atm with an estimated density of 1500 kg m–3. To calculate the density of nonporous CFs and CNFs, we used the bulk modulus of cellulose B = 11.6 GPa in the 0.2–0.6 GPa range.
Figure 7
Figure 7
Density-scaled thermal conductivity, κ/(ρ/ρ0)g, plotted against temperature, see eq 5: (circles) data for CNFs measured at 0.1 GPa (ρ = 1514 kg m–3) and 0.5 GPa (ρ = 1566 kg m–3) were scaled using g = 1.95 and g = 1.90, respectively; the data collapse on the data for porous CNFs, ρ0 = 1340 kg m–3, measured on cooling at 0.06 GPa; (squares) corresponding data for CFs with g = 1.88 and g = 1.55, respectively. The dashed lines represent third-order polynomial fits to all data sets for CNFs and CFs, respectively.

References

    1. Moon R. J.; Martini A.; Nairn J.; Simonsen J.; Youngblood J. Cellulose nanomaterials review: structure, properties and nanocomposites. Chem. Soc. Rev. 2011, 40, 3941–3994. 10.1039/c0cs00108b. - DOI - PubMed
    1. Habibi Y.; Lucia L. A.; Rojas O. J. Cellulose Nanocrystals: Chemistry, Self-Assembly, and Applications. Chem. Rev. 2010, 110, 3479–3500. 10.1021/cr900339w. - DOI - PubMed
    1. Uetani K.; Hatori K. Thermal conductivity analysis and applications of nanocellulose materials. Sci. Technol. Adv. Mater. 2017, 18, 877–892. 10.1080/14686996.2017.1390692. - DOI - PMC - PubMed
    1. Diaz J. A.; Ye Z.; Wu X.; Moore A. L.; Moon R. J.; Martini A.; Boday D. J.; Youngblood J. P. Thermal Conductivity in Nanostructured Films: From Single Cellulose Nanocrystals to Bulk Films. Biomacromolecules 2014, 15, 4096–4101. 10.1021/bm501131a. - DOI - PubMed
    1. Li T.; Song J.; Zhao X.; Yang Z.; Pastel G.; Xu S.; Jia C.; Dai J.; Chen C.; Gong A.; Jiang F.; Yao Y.; Fan T.; Yang B.; Wågberg L.; Yang R.; Hu L. Anisotropic, Lightweight, Strong, and Super Thermally Insulating Nanowood with Naturally Aligned Nanocellulose. Sci. Adv. 2018, 4, eaar372410.1126/sciadv.aar3724. - DOI - PMC - PubMed

Publication types