. 2021 Aug 27:15:698967.
doi: 10.3389/fnins.2021.698967. eCollection 2021.

Effect of Electro-Acupuncture at ST36 and SP6 on the cAMP -CREB Pathway and mRNA Expression Profile in the Brainstem of Morphine Tolerant Mice

Affiliations

Effect of Electro-Acupuncture at ST36 and SP6 on the cAMP -CREB Pathway and mRNA Expression Profile in the Brainstem of Morphine Tolerant Mice

Qisheng Wang et al. Front Neurosci. .

Abstract

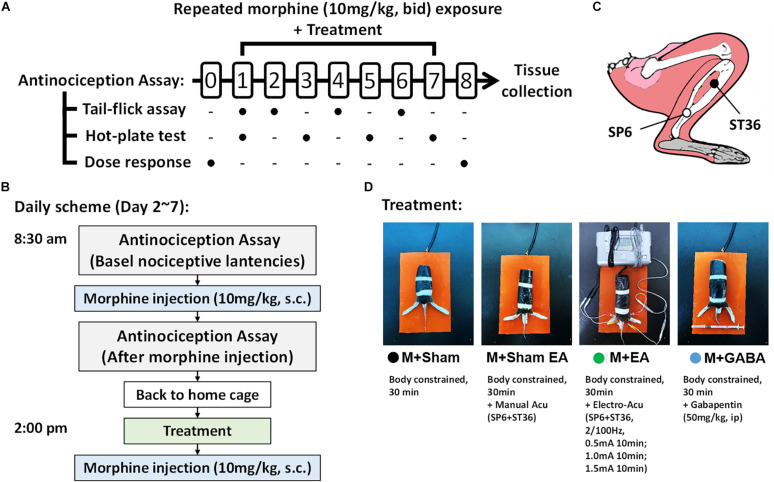
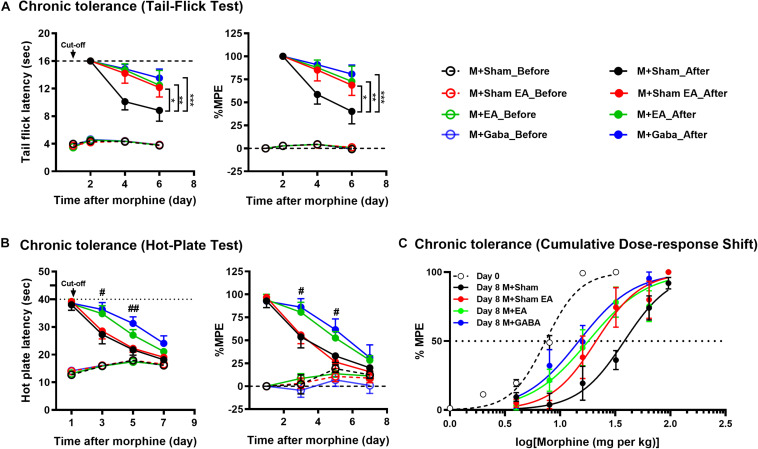
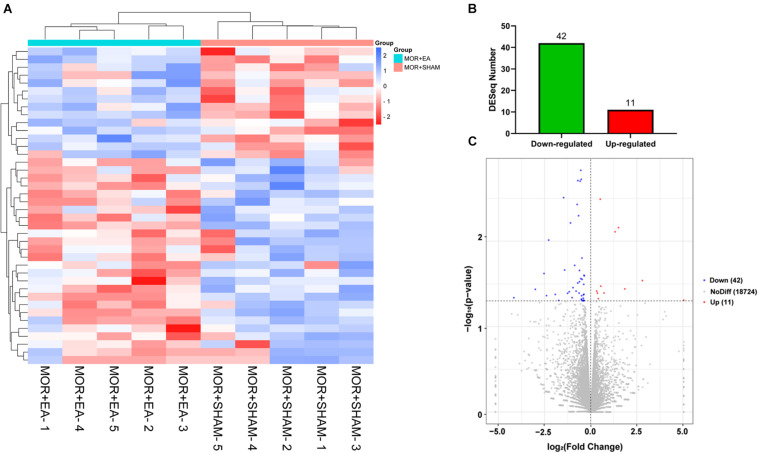
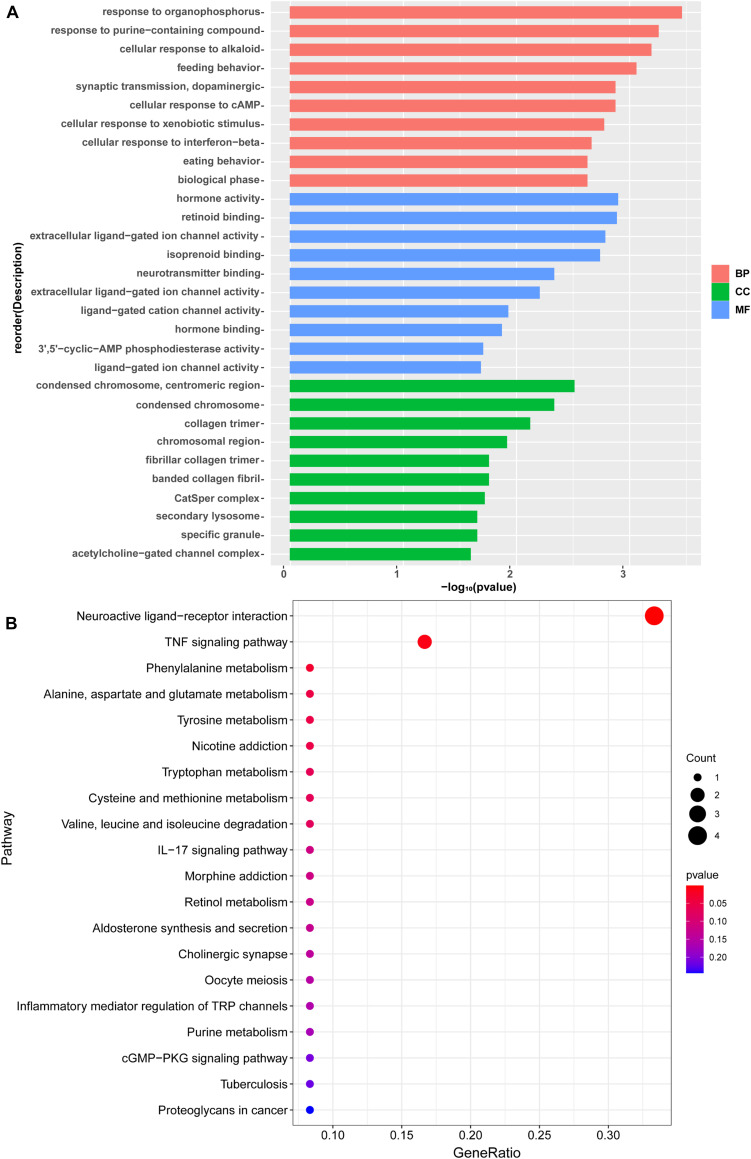
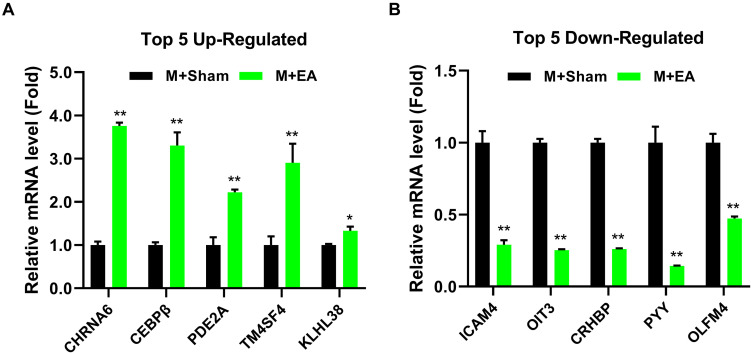
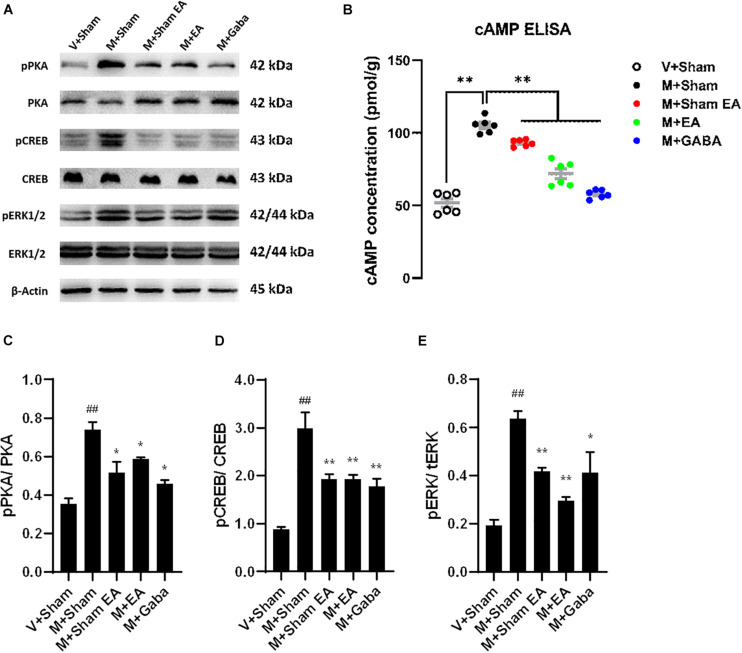
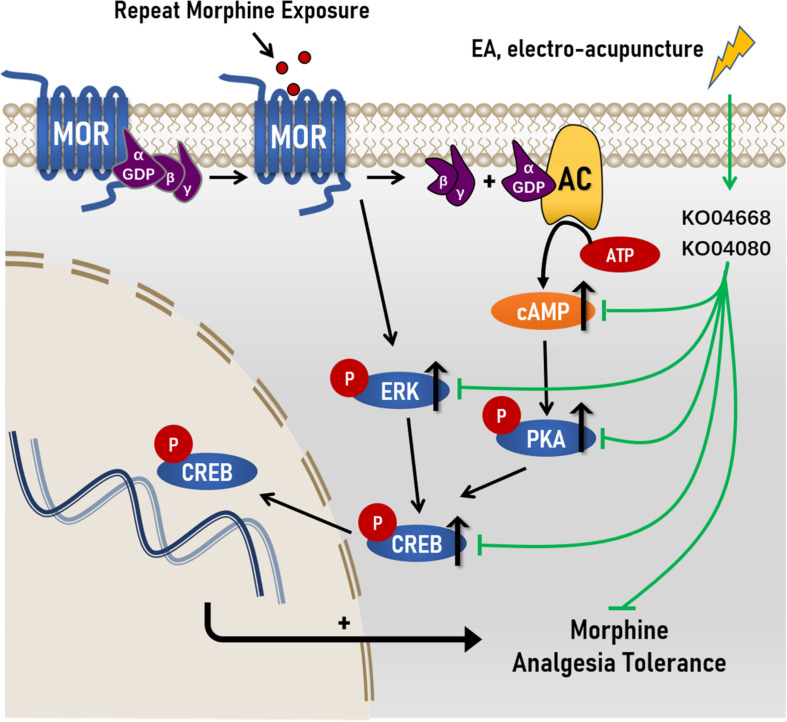
Undoubtedly, opioid drugs have been the most popular treatment for refractory pain since found, such as morphine. However, tolerance to the analgesic effects caused by repeated use is inevitable, which greatly limits the clinical application of these drugs. Nowadays, it has become the focus of the world that further development of non-opioid-based treatment along with efficient strategies to circumvent opioid tolerance are urgently needed clinically. Fortunately, electro-acupuncture (EA) provides an alternative to pharmaceutic treatment, remaining its potential mechanisms unclear although. This study was aimed to observe the effects of EA on morphine-induced tolerance in mice and discover its underlying mechanism. Tail-flick assay and hot-plate test were conducted to assess the development of tolerance to morphine-induced analgesia effect. As a result of repeated administration scheme (10 mg/kg, twice per day, for 7 days), approximately a two-fold increase was observed in the effective dose of 50% (ED50) of morphine-induced antinociceptive effect. Interestingly, by EA treatment (2/100Hz, 0.5, 1.0, and 1.5 mA, 30 min/day for 7 days) at the acupoints Zusanli (ST36) and Sanyinjiao (SP6), morphine ED50 curves was remarkably leftward shifted on day 8. In addition, the RNA sequencing strategy was used to reveal the potential mechanisms. Due to the well described relevance of cyclic adenosine monophosphate (cAMP), protein kinase A (PKA), extracellular regulated protein kinases (ERK), and cAMP response element-binding (CREB) in brainstem (BS) to analgesia tolerance, the cAMP-PKA/ERK-CREB signaling was deeply concerned in this study. Based upon Enzyme-Linked Immunosorbent Assay, the up-regulation of the cAMP level was observed, whereas reversed with EA treatment. Similarly, western blot revealed the phosphorylation levels of PKA, ERK, and CREB were up-regulated in morphine tolerant mice, whereas the EA group showed a significantly reduced expression level instead. This study observed an attenuating effect of the EA at ST36 and SP6 on morphine tolerance in mice, and suggested several potential biological targets by RNA-seq, which include the cAMP-PKA/ERK-CREB signaling pathway, strongly supporting a useful treatment for combatting the opioid epidemic, and opioid-tolerant patients.

Keywords: CREB; PKA/ERK; cAMP; electro-acupuncture; morphine-induced analgesic tolerance.


Conflict of interest statement

The authors declare that the research was conducted in the absence of any commercial or financial relationships that could be construed as a potential conflict of interest.

Figures

FIGURE 1
FIGURE 1
Experimental method and flow chart. (A) Schematic illustrating the experimental design of the analgesia tolerance paradigm. Animals were acclimated to the testing environment and investigators for at least 2 weeks. Dose–response curves were determined using a cumulative dosing scheme on day 0 and day 8. The baseline latencies of both two assays were performed at day 1. From the 1st day to the 7th day, the tail-flick test and hot-plate test will be conducted alternately to compare the effects of different treatments on the development of morphine tolerance. (B) The Treatment and drug administration were performed as described above in the section “Materials and Methods”. (C) Schematic diagram of mouse acupuncture points of SP6 and ST36. (D) Different treatments between groups during the 2nd day to the 7th day.
FIGURE 2
FIGURE 2
Morphine-induced chronic tolerance evaluated by (A) tail-flick and (B) hot-plate. Mice were treated daily with morphine (10 mg per kg, s.c.); antinociception was assessed 30 min after the injection on the days indicated. Symbols in graphs on left side represent mean ± SEM maximum possible effect (% MPE) or the time of latency. The data were analyzed with two-way ANOVA followed by Bonferroni post hoc tests. F(6,74) = 1.477, F(6,74) = 1.317. P < 0.05, ∗∗P < 0.01, and ∗∗∗P < 0.001 compared to M + Sham_After. In hot-plate, day 3: left, F(3,26) = 3.369; right, F(3,26) = 5.410. day 5: left, F(3,25) = 3.538; right, F(3,25) = 7.188. #P < 0.05, ##P < 0.01, M + GABA_After vs. M + Sham_After. (C) Dose-response curves were determined by tail-flick assay using a cumulative dosing scheme on day 0 to day 8. On day 1, mice were treated with 1, 2, 4, 8, and 16 mg per kg morphine (s.c.). On day 8, mice were again challenged with 4, 8, 16, 32, 64, and 96 mg per kg morphine (s.c.). ED50 (50% effective dose) values were calculated by non-linear regression analysis (GraphPad Prism). Each point in graphs represents mean ± SEM maximum possible effect (% MPE). Dotted lines indicate 50% MPE; 95% confidence intervals: day 0: 7.368 (6.859 to 7.894); day 8: M + Sham, 38.17 (30.41 to 47.10); M + Sham EA, 21.18 (15.94 to 28.44); M + EA, 18.00 (13.37 to 24.12); M + Gaba, 14.79 (11.36 to 19.13).
FIGURE 3
FIGURE 3
Differential expression of genes. (A,B) Heat map of differentially expressed genes regulated by morphine or EA. Each row represents one differentially expressed gene; each column represents one sample. The dendrogram on the left reveals the gene clustering. Green and red spectrum colors indicating downregulated and upregulated expression, respectively. (C) Volcano plot. X-axis: log2(fold change); Y-axis: log10(P-value). The red points represent gene that were significantly up-regulated; the blue points represent gene that were significantly down-regulated. EA, electro-acupuncture.
FIGURE 4
FIGURE 4
(A) A Gene Ontology (GO) analysis of differentially expressed gene. The enrichment score was calculated as (–log10[P value]). The X-axis is the enrichment score for the GO terms, and the Y-axis depicts the GO terms. Pink represent top 10 enrichment score of biological process. Green represents top 10 enrichment score of cellular component. Blue represents top 10 enrichment score of molecular function. (B) KEGG pathway analysis of differentially expressed with the top 20 enrichment scores. The X-axis represents the gene radio, and the Y-axis shows the name of these pathways.
FIGURE 5
FIGURE 5
Effects of EA treatments on the expression of gene in the brainstem. (A) The mRNA expression level of top5 up-regulated gene in the brainstem. (B) The mRNA expression level of top5 down-regulated gene in the brainstem (n = 4). The data were analyzed with unpaired t test. *p < 0.05 and **p < 0.01 compared to M + Sham.
FIGURE 6
FIGURE 6
Effects of EA treatments on the protein expression in brainstem. (A) The brainstem tissues were lysed and analyzed by Western blotting using antibodies against PKA, phospho-PKA, ERK1/2, phospho-ERK1/2, CREB, and phospho-CREB. Representative blot was shown. GAPDH serves as loading control. (B) Effects of EA treatments on adenylyl cyclase activity (cAMP) after chronic morphine treatment. cAMP activity was assessed in BS after 5 days of chronic morphine treatment (10 mg/kg, s.c., per day). Data represent the mean ± SEM of experiments performed in six BS from six animals of each group assayed in triplicate in parallel experiments. (C–E) Graphic representation of relative expressions of pPKA/PKA, pCREB/CREB, pERK/tERK, respectively.Data are presented as the mean ± SEM (n = 4). The data were analyzed with one-way ANOVA followed by Bonferroni post hoc tests. *p < 0.05, ***p < 0.01, vs. M + Sham; ##p < 0.01, vs. V + Sham.
FIGURE 7
FIGURE 7
Proposed mechanisms of action by which EA ameliorated morphine-induced tolerance in mice. Chronic morphine increased the levels of cAMP, and the levels of phosphorylation levels of protein kinase A (PKA), extracellular regulated protein kinases (ERK) and cAMP response element-binding (CREB) in morphine-induced tolerance. After the treatment of Electro-Acupuncture, the increased of cAMP, p-PKA C, p-ERK, and p-CREB were significantly decreased in morphine-induce tolerance. Simultaneously, RNA sequencing reval the underlying molecular targets of EA treatment on morphine-induced tolerance maybe KO04080 (Neuroactive ligand-receptor interaction) and KO04668 (TNF signaling pathway).

References

    1. Caudill-Slosberg M. A., Schwartz L. M., Woloshin S. J. P. (2004). Office visits and analgesic prescriptions for musculoskeletal pain in US: 1980 vs. 2000. Pain 109 514–519. 10.1016/s0304-3959(04)00130-7 - DOI - PubMed
    1. DeWire S. M., Yamashita D. S., Rominger D. H., Liu G., Cowan C. L., Graczyk T. M., et al. (2013). A G protein-biased ligand at the μ-opioid receptor is potently analgesic with reduced gastrointestinal and respiratory dysfunction compared with morphine. J. Pharmacol. Exp. Ther. 344 708–717. 10.1124/jpet.112.201616 - DOI - PubMed
    1. Zhang R., Lao L., Ren K., Berman B. M. (2014). Mechanisms of acupuncture-electroacupuncture on persistent pain. Anesthesiology 120 482–503. 10.1097/aln.0000000000000101 - DOI - PMC - PubMed
    1. Vickers A. J., Cronin A. M., Maschino A. C., Lewith G., MacPherson H., Foster N. E., et al. (2012). Acupuncture for chronic pain: individual patient data meta-analysis. J. Arch. Intern. Med. 55 24–25. - PMC - PubMed
    1. Zhao Z. Q. (2008). Neural mechanism underlying acupuncture analgesia. Prog. Neurobiol. 85 355–375. 10.1016/j.pneurobio.2008.05.004 - DOI - PubMed