. 2021 Aug 26:15:699736.
doi: 10.3389/fncel.2021.699736. eCollection 2021.

Profiling of Blood-Brain Barrier Disruption in Mouse Intracerebral Hemorrhage Models: Collagenase Injection vs. Autologous Arterial Whole Blood Infusion

Affiliations

Profiling of Blood-Brain Barrier Disruption in Mouse Intracerebral Hemorrhage Models: Collagenase Injection vs. Autologous Arterial Whole Blood Infusion

Peijun Jia et al. Front Cell Neurosci. .

Abstract

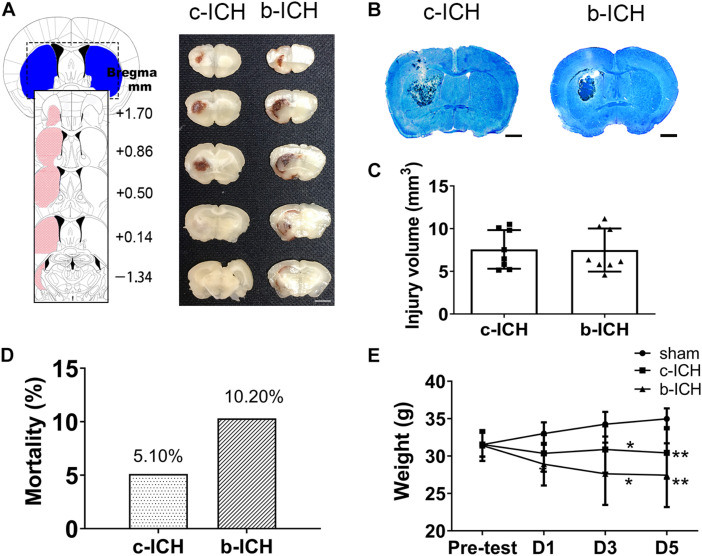
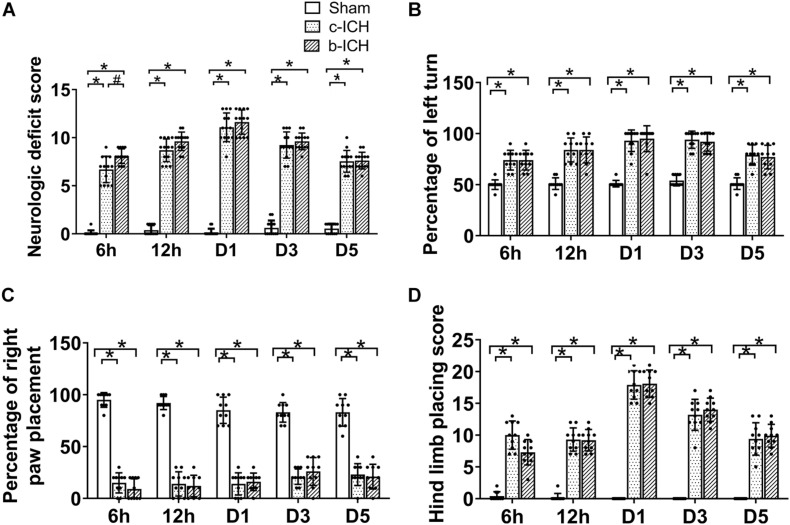
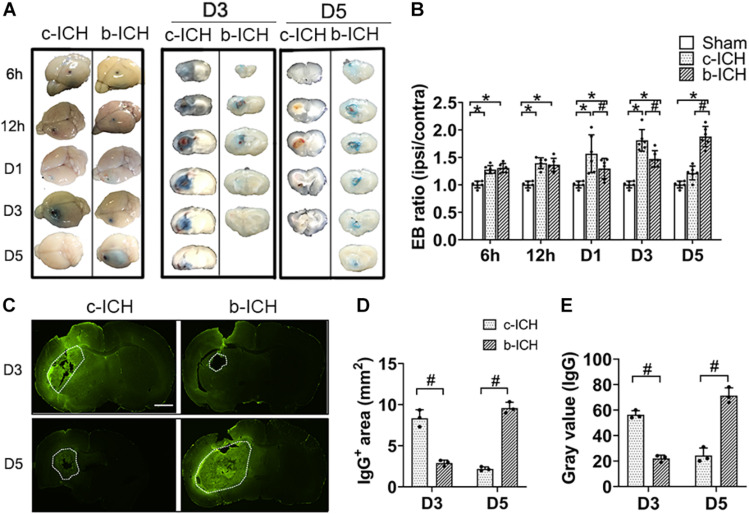
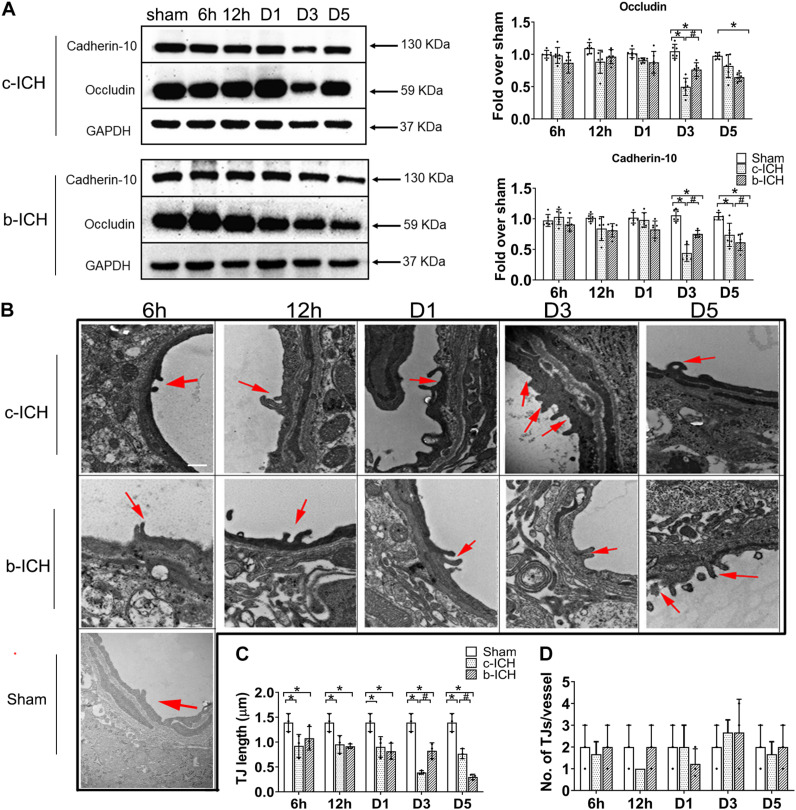
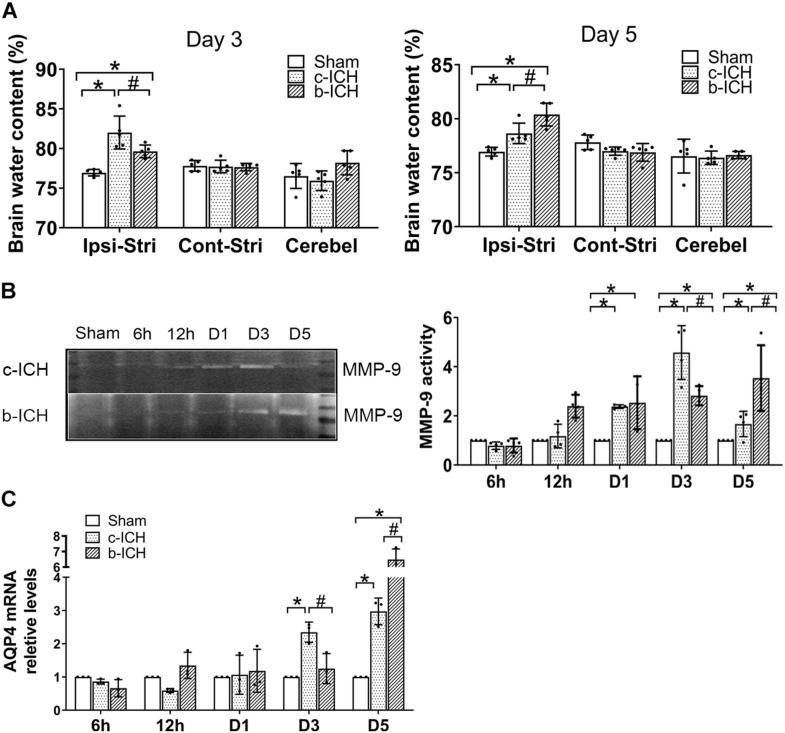
Disruption of the blood-brain barrier (BBB) and the subsequent formation of brain edema is the most severe consequence of intracerebral hemorrhage (ICH), leading to drastic neuroinflammatory responses and neuronal cell death. A better understanding of ICH pathophysiology to develop effective therapy relies on selecting appropriate animal models. The collagenase injection ICH model and the autologous arterial whole blood infusion ICH model have been developed to investigate the pathophysiology of ICH. However, it remains unclear whether the temporal progression and the underlying mechanism of BBB breakdown are similar between these two ICH models. In this study, we aimed to determine the progression and the mechanism of BBB disruption via the two commonly used murine ICH models: the collagenase-induced ICH model (c-ICH) and the double autologous whole blood ICH model (b-ICH). Intrastriatal injection of 0.05 U collagenase or 20 μL autologous blood was used for a comparable hematoma volume in these two ICH models. Then we analyzed BBB permeability using Evan's blue and IgG extravasation, evaluated tight junction (TJ) damage by transmission electron microscope (TEM) and Western blotting, and assessed matrix metalloproteinase-9 (MMP-9) activity and aquaporin 4 (AQP4) mRNA expression by Gelatin gel zymography and RT-PCR, respectively. The results showed that the BBB leakage was associated with a decrease in TJ protein expression and an increase in MMP-9 activity and AQP4 expression on day 3 in the c-ICH model compared with that on day 5 in the b-ICH model. Additionally, using TEM, we found that the TJ was markedly damaged on day 3 in the c-ICH model compared with that on day 5 in the b-ICH model. In conclusion, the BBB was disrupted in the two ICH models; compared to the b-ICH model, the c-ICH model presented with a more pronounced disruption of BBB at earlier time points, suggesting that the c-ICH model might be a more suitable model for studying early BBB damage and protection after ICH.

Keywords: aquaporin 4; autologous blood; blood-brain barrier; collagenase; intracerebral hemorrhage; matrix metalloproteinase-9; tight junction; transmission electron microscope.


Conflict of interest statement

The authors declare that the research was conducted in the absence of any commercial or financial relationships that could be construed as a potential conflict of interest.

Figures

FIGURE 1
FIGURE 1
The comparison of injury volume between c-ICH and b-ICH groups. (A) Left: Schematic illustration of the spatial extent of the striatum. Right: Representative fresh brain sections show hematomas (red areas) at 24 h after intrastriatal injection of 0.050 U collagenase (“Collagenase”) or 20 μL autologous blood (“Blood”). (B) Representative Luxol fast blue/Cresyl violet-stained brain sections from c-ICH and b-ICH groups (scale bar = 1 mm). (C) Injury volume was detected at 24 h after ICH by integration of serial coronal sections stained with Luxol fast blue/Cresyl violet, no difference between the c-ICH and b-ICH model was detected. n = 8 mice/group (t-test). (D) Overall mortality was determined for all animals used in this study. (E) Bodyweight was measured in all groups on days 1, 3, and 5 respectively. n = 12 mice/group. *P < 0.05, **P < 0.01 vs. sham group (Repeated measures ANOVA followed by Bonferroni post-hoc test). Data are expressed as mean ± SD (the repeated measures ANOVA followed by the Bonferroni post-hoc test). Values are mean ± SD.
FIGURE 2
FIGURE 2
Motor function of the two ICH models. (A) Mice in the b-ICH group had a more severe neurologic deficit score (NDS) than the c-ICH group at 6 h after ICH. n = 10 mice/group. *P < 0.05 vs. sham group; #P < 0.05 vs. ICH group (repeated measures ANOVA followed by Bonferroni post-hoc test). (B–D) The corner turn test and right front paw and hindlimb placement tests on 6 h, days 1, 3, and 5 after ICH. n = 10 mice/group. *P < 0.05 vs. sham group (the repeated measures ANOVA followed by the Bonferroni post-hoc test). Values are mean ± SD.
FIGURE 3
FIGURE 3
The comparison of BBB breakdown between the c-ICH and the b-ICH groups. (A) The Evans blue staining showed that BBB leakage was present from 6 h to day 5 after ICH in two groups. (B) Quantitative analysis showed that the Evans blue (EB) concentration peaked at day 3 in the c-ICH group but on day 5 in the b-ICH group (n = 6 mice/group for each time point; *P < 0.05 vs. sham group, #P < 0.05 vs. the c-ICH group; repeated measures ANOVA followed by Bonferroni post-hoc test). (C) The IgG-positive area was determined by immunohistochemical staining on days 3 and 5, respectively (scale bar = 1 mm). (D,E) Quantification of endogenous IgG-positive area and gray values of IgG immunostaining; n = 3 mice/group; #P < 0.05 vs. c-ICH group (t-test). Values are Mean ± SD.
FIGURE 4
FIGURE 4
The comparison of the expressions of tight junction proteins between c-ICH and b-ICH groups. (A) Western blots showed occludin expression and cadherin-10 expression at 6 h, 12 h, days 1, 3, and 5 after ICH. Quantification of occluding and cadherin-10 levels at 6 h, 12 h, day 1, day 3, and day 5 after ICH in both models (n = 6 mice/group; *P < 0.05 vs. sham group, #P < 0.05 vs. c-ICH group; repeated measures ANOVA followed by Bonferroni post-hoc test). Values are mean ± SD. (B) Representative electron microscopic images of TJ ultrastructure at 6 h, 12 h, day 1, day 3, and day 5 after ICH in both models and sham group. Arrowheads = tight junctions (TJ); Scale bar = 1 μM. (C) Quantification of tight junction length (n = 3/group). (D) Quantification of the number of tight junctions per vessel (n = 3 mice/group, four image fields quantified per mouse; *P < 0.05 vs. sham group, #P < 0.05 vs. c-ICH group (the repeated measures ANOVA followed by the Bonferroni post-hoc test). Values are mean ± SD.
FIGURE 5
FIGURE 5
The comparison of the expressions of aquaporin 4 (AQP4) and MMP-9 activity in brain tissue between c-ICH and b-ICH groups. (A) Measurement of brain water content on days 3 and 5 (n = 6 mice/group; *P < 0.05 vs. sham group, #P < 0.05 vs. the c-ICH group repeated measures ANOVA followed by Bonferroni post-hoc test). Cont-Stri, contralateral striatum; Ipsi-Stri, ipsilateral striatum. Values are mean ± SD. (B) Gelatin zymography shows MMP-9 activity in brain tissue at 6 h, 12 h, day 1, day 3, and day 5 after ICH in both models. Quantification of MMP-9 activity in the brain (n = 4 mice/group, *P < 0.05 vs. sham group, #P < 0.05 vs. the c-ICH group; the repeated measures ANOVA followed by the Bonferroni post-hoc test). (C) Quantification of AQP4 mRNA levels in the brain at 6 h, 12 h, day 1, day 3, and day 5 after ICH in the c-ICH and the b-ICH groups (n = 3 mice/group, four fields quantified per mouse; *P < 0.05 vs. sham group, #P < 0.05 vs. the c-ICH group; the repeated measures ANOVA followed by the Bonferroni post-hoc test). Values are mean ± SD.

References

    1. Boltze J., Aronowski J. A., Badaut J., Buckwalter M. S., Caleo M., Chopp M., et al. (2021). New Mechanistic Insights, Novel Treatment Paradigms, and Clinical Progress in Cerebrovascular Diseases. Front. Aging Neurosci. 13:623751. 10.3389/fnagi.2021.623751 - DOI - PMC - PubMed
    1. Chang C. F., Cho S., Wang J. (2014). (-)-Epicatechin protects hemorrhagic brain via synergistic Nrf2 pathways. Ann. Clin. Transl. Neurol. 1 258–271. 10.1002/acn3.54 - DOI - PMC - PubMed
    1. Chu H., Xiang J., Wu P., Su J., Ding H., Tang Y., et al. (2014). The role of aquaporin 4 in apoptosis after intracerebral hemorrhage. J. Neuroinflam. 11:184. 10.1186/s12974-014-0184-5 - DOI - PMC - PubMed
    1. Chu K., Jeong S. W., Jung K. H., Han S. Y., Lee S. T., Kim M., et al. (2004). Celecoxib induces functional recovery after intracerebral hemorrhage with reduction of brain edema and perihematomal cell death. J. Cereb. Blood Flow Metab. 24 926–933. 10.1097/01.wcb.0000130866.25040.7d - DOI - PubMed
    1. Dardiotis E., Siokas V., Marogianni C., Aloizou A. M., Sokratous M., Paterakis K., et al. (2019). AQP4 tag SNPs in patients with intracerebral hemorrhage in Greek and Polish population. Neurosci. Lett. 696 156–161. 10.1016/j.neulet.2018.12.025 - DOI - PubMed