. 2021 Aug 27:15:718348.
doi: 10.3389/fncir.2021.718348. eCollection 2021.

5-HT1A Receptors Alter Temporal Responses to Broadband Vocalizations in the Mouse Inferior Colliculus Through Response Suppression

Affiliations

5-HT1A Receptors Alter Temporal Responses to Broadband Vocalizations in the Mouse Inferior Colliculus Through Response Suppression

Arianna Gentile Polese et al. Front Neural Circuits. .

Abstract

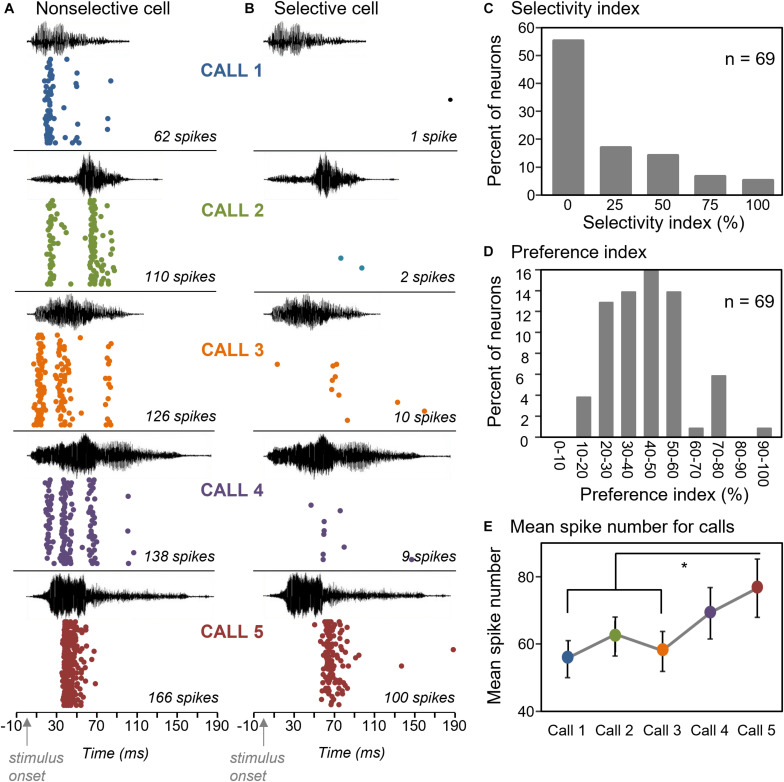
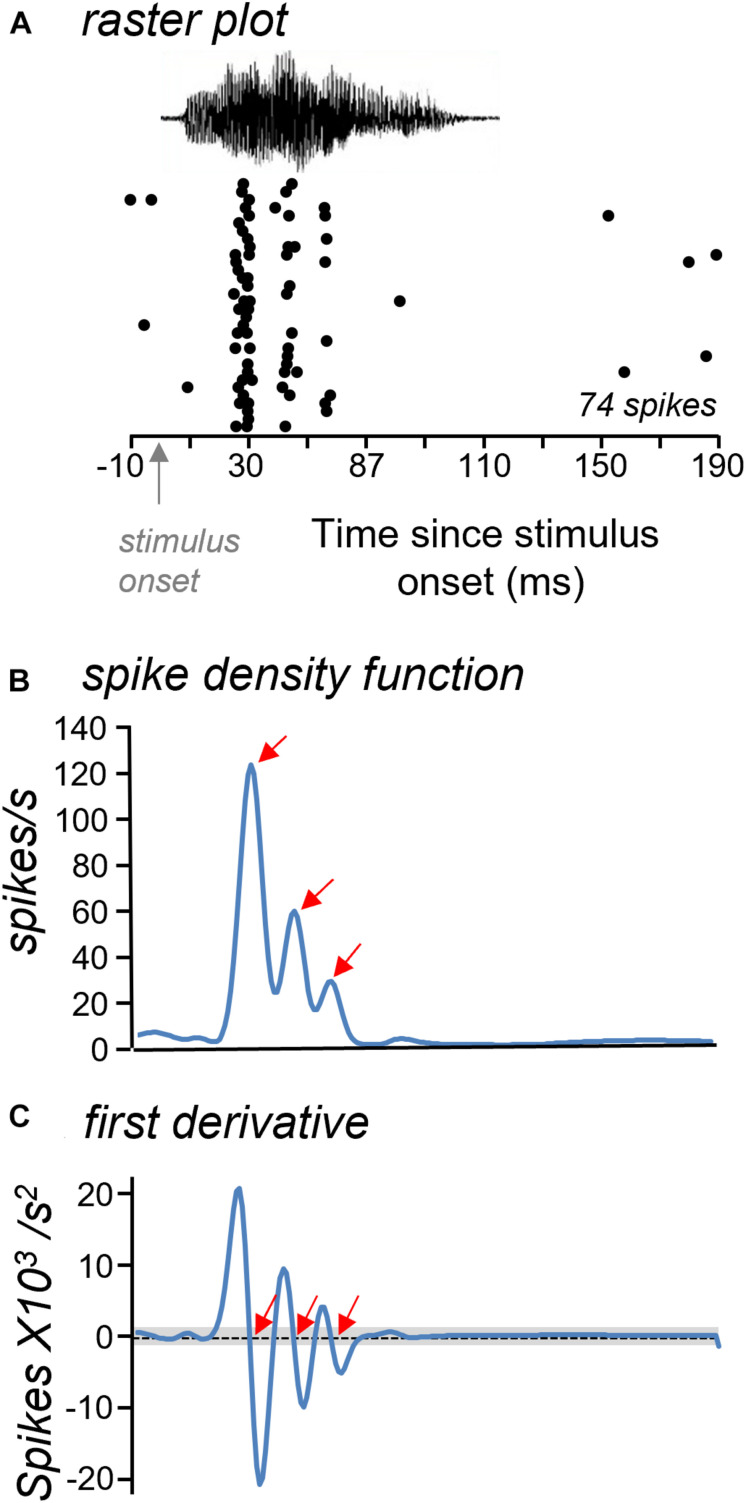
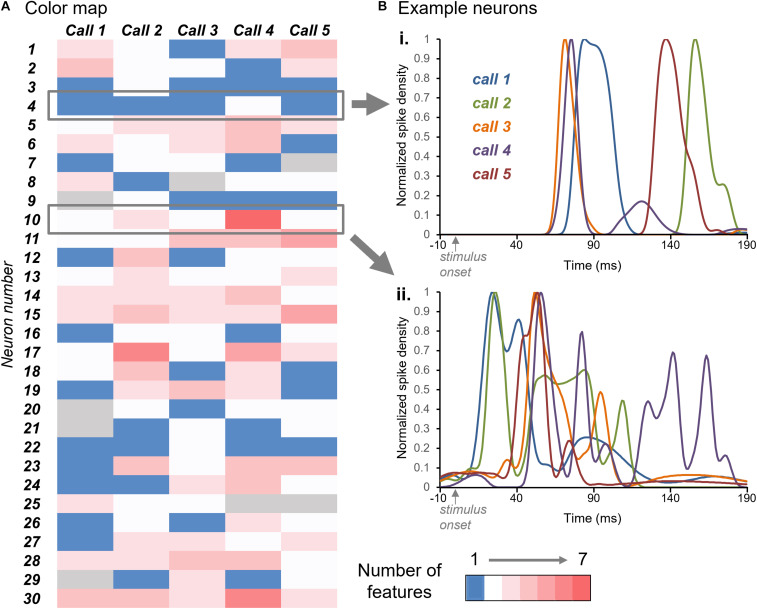
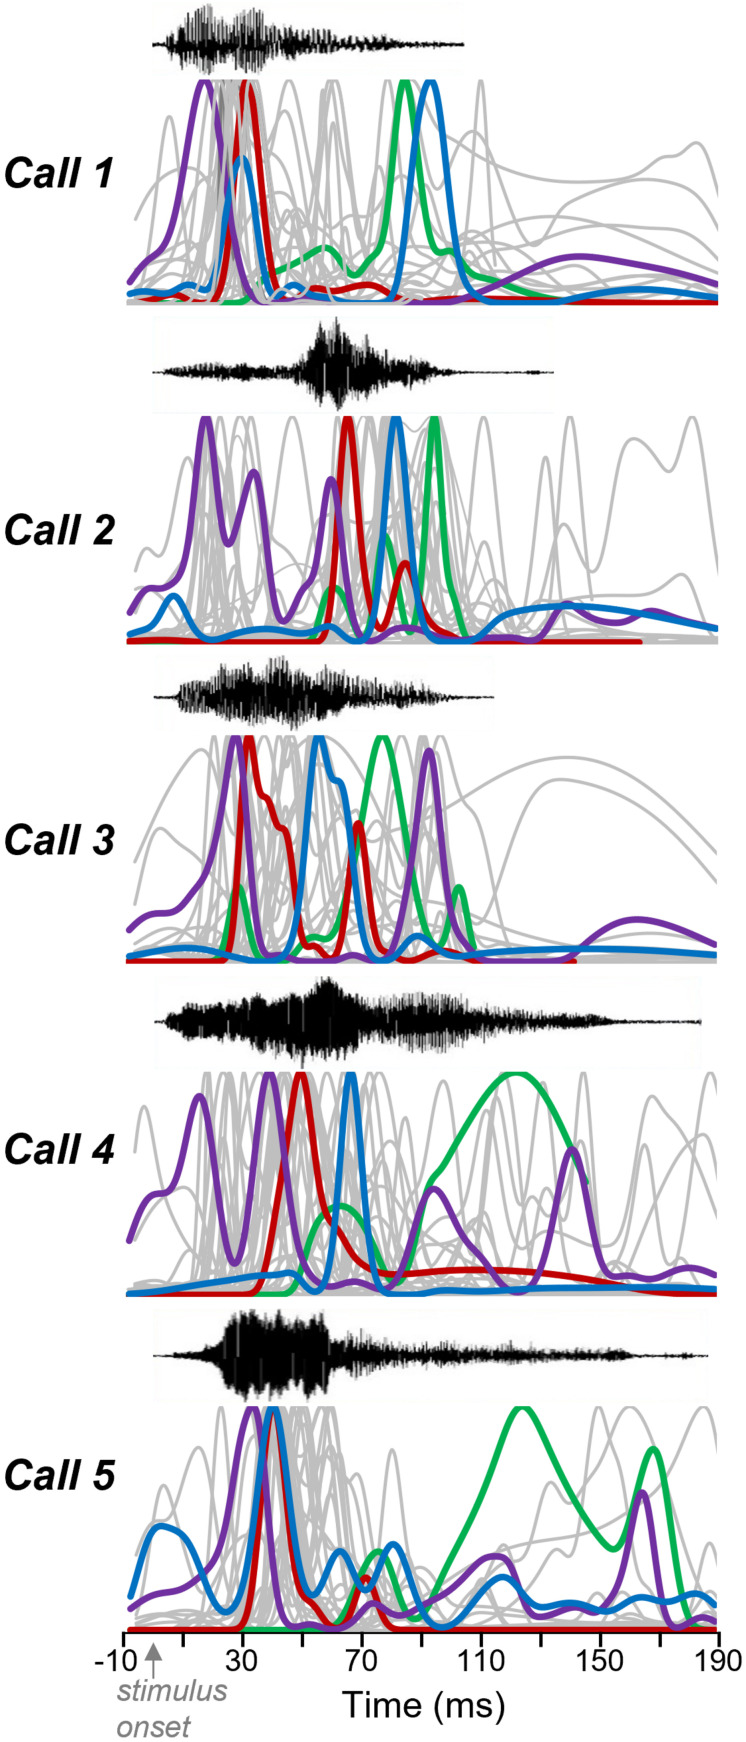
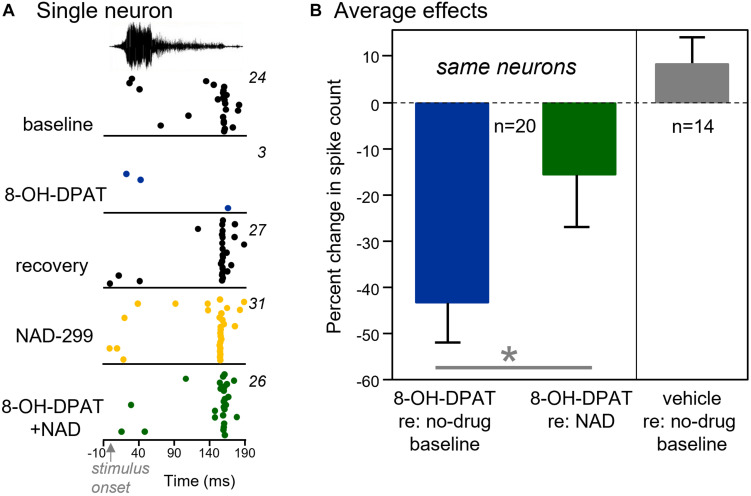
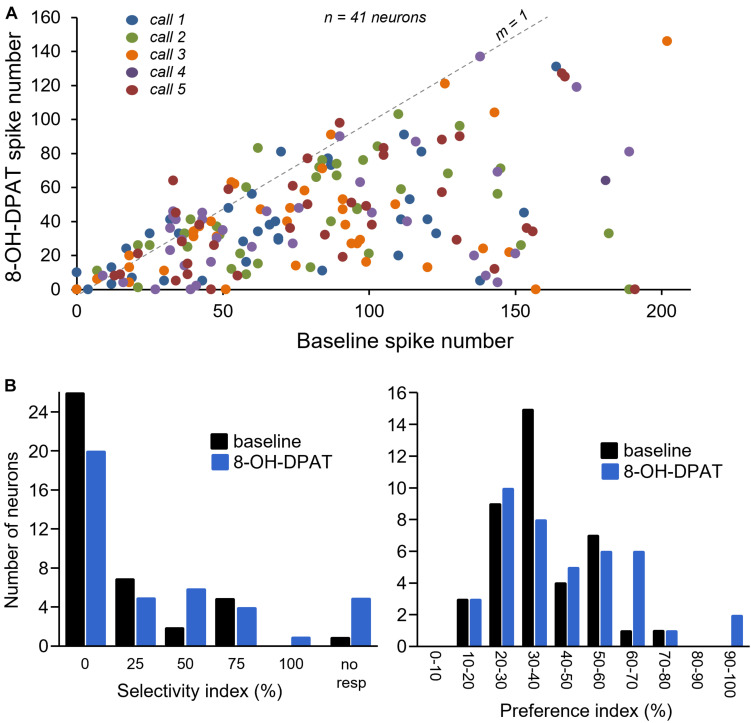
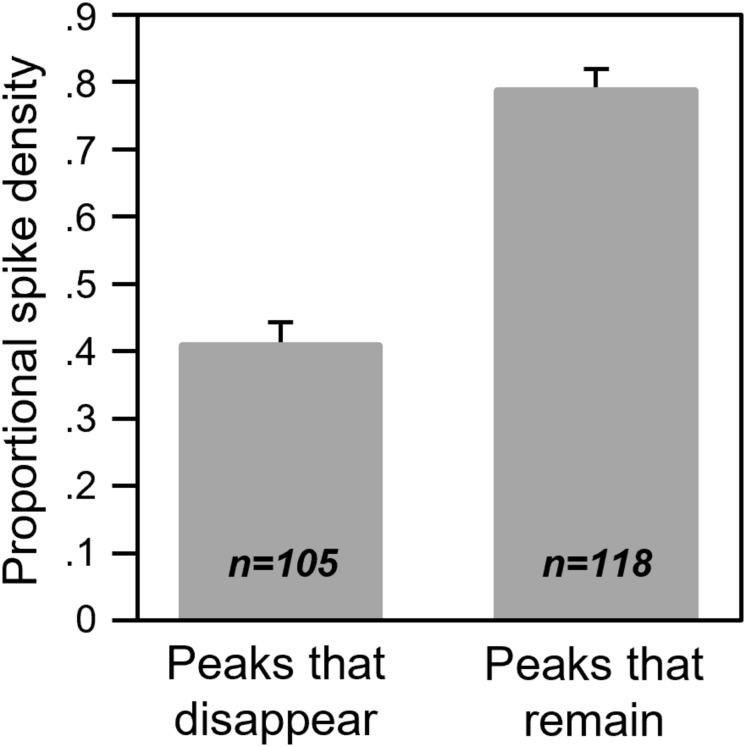
Neuromodulatory systems may provide information on social context to auditory brain regions, but relatively few studies have assessed the effects of neuromodulation on auditory responses to acoustic social signals. To address this issue, we measured the influence of the serotonergic system on the responses of neurons in a mouse auditory midbrain nucleus, the inferior colliculus (IC), to vocal signals. Broadband vocalizations (BBVs) are human-audible signals produced by mice in distress as well as by female mice in opposite-sex interactions. The production of BBVs is context-dependent in that they are produced both at early stages of interactions as females physically reject males and at later stages as males mount females. Serotonin in the IC of males corresponds to these events, and is elevated more in males that experience less female rejection. We measured the responses of single IC neurons to five recorded examples of BBVs in anesthetized mice. We then locally activated the 5-HT1A receptor through iontophoretic application of 8-OH-DPAT. IC neurons showed little selectivity for different BBVs, but spike trains were characterized by local regions of high spike probability, which we called "response features." Response features varied across neurons and also across calls for individual neurons, ranging from 1 to 7 response features for responses of single neurons to single calls. 8-OH-DPAT suppressed spikes and also reduced the numbers of response features. The weakest response features were the most likely to disappear, suggestive of an "iceberg"-like effect in which activation of the 5-HT1A receptor suppressed weakly suprathreshold response features below the spiking threshold. Because serotonin in the IC is more likely to be elevated for mounting-associated BBVs than for rejection-associated BBVs, these effects of the 5-HT1A receptor could contribute to the differential auditory processing of BBVs in different behavioral subcontexts.

Keywords: 5-HT1A; auditory; inferior colliculus; serotonin receptor; vocalization.


Conflict of interest statement

The authors declare that the research was conducted in the absence of any commercial or financial relationships that could be construed as a potential conflict of interest.

Figures

FIGURE 1
FIGURE 1
BBVs played to mice. (A) Oscillograms (top part of each panel) and spectrograms (lower part of each panel) of the five recorded BBVs used as stimuli for IC neurons. Calls varied in amplitude envelope as well as in duration, spectrotemporal structure, and whether deterministic chaos was present (in the latter portions of calls 3, 4, and 5). Colors represent relative intensity of specific call components. (B) Histogram of the characteristic frequencies (CF) of neurons responding to BBVs, which also responded to tones for estimation of CF.
FIGURE 2
FIGURE 2
Selectivity of IC neurons for the five BBVs. (A) Raster plots of a neuron that responded to all five BBVs. (B) Raster plot of a neuron that responded robustly only to Call 5. (C) Selectivity index across a group of 69 neurons illustrating a low degree of selectivity, with most neurons responding to all calls. (D) Preference index, showing the mean per cent difference in spiking among pairs of calls across a group of 69 neurons. (E) Mean spike counts for responses across calls show significant differences, with Calls 1 and 3 evoking fewer spikes than Call 5. *p < 0.05.
FIGURE 3
FIGURE 3
Approach for measuring response features. (A) Raster plots were used to generate spike density functions. (B) Spike density function with three clear peaks (arrows) illustrating periods of high spike probability. (C) Response features were identified from the first derivative of the spike density functions as null crossings that were higher and lower than the threshold criterion (gray bar). Red arrows mark identified response features. The time axis is the same in all plots.
FIGURE 4
FIGURE 4
(A) Color map of numbers of response features for the responses of 30 neurons (y-axis) across the five BBVs (x-axis). Blue indicates single response features and white through red indicate increasing numbers of features, up to seven. Gray indicates the lack of response to a specific call. (B) Normalized spike density functions for two neurons indicated by the gray boxes in (A). Spike density functions for the responses to all five calls are plotted together. For the neuron in (i), the number of response features was one for four of the calls, and two for one of the calls. For the neuron in (ii), the numbers of response peaks across calls ranged from two to seven.
FIGURE 5
FIGURE 5
Response features vary among neurons and calls. Oscillograms (top) and normalized spike density functions for 30 neurons across five calls. Specific colors represent spike density functions of single neurons with a range of peak response times. A given color represents responses of the same neuron across calls. Gray spike density functions are from the remaining 26 neurons.
FIGURE 6
FIGURE 6
Activation of the 5-HT1A receptor reduces the numbers of sound-evoked spikes. (A) For a single neuron, the 5-HT1A agonist 8-OH-DPAT abolishes the response to a BBV. Iontophoresis of the 5-HT1A antagonist NAD-299 precluded the reduction in the number of spikes when it was iontophoresed before 8-OH-DPAT. The BBV was call 5 (see Figure 1), played at 10 dB above threshold. (B) Left panel: 8-OH-DPAT reduced the numbers of spikes significantly less on average when applied in the presence of NAD-299. Right panel: Application of vehicle solutions slightly increases but does not significantly alter the numbers of sound-evoked spikes relative to a no-drug baseline. *p < 0.05.
FIGURE 7
FIGURE 7
(A) Comparison of numbers of spikes in response to specific calls in the baseline (no drug application) versus during 8-OH-DPAT application. Symbols below the line with a slope of 1 represent a suppression of spikes during drug application. Different colors represent responses to different calls. (B) Selectivity index and preference index in a subset of 41 neurons in baseline and during exposure to 8-OH-DPAT.
FIGURE 8
FIGURE 8
Effects of 8-OH-DPAT on response features. (A) Raster plots of the responses of a neuron in (i) the baseline condition and (ii) during iontophoresis of 8-OH-DPAT. (iii) Spike density functions derived from the rater plots in (i) and (ii). The neuron in (A) showed proportionally similar suppressions of all response features, with the loss of the smallest feature. Call 4 evoked this response. (B) Neuron showing selective decreases of response features in the middle of its spike train. Call 4 evoked this response. (C) Neuron showing a reorganization of its spike train in the presence of 8-OH-DPAT. Call 5 evoked this response. Time scale is the same for all panels.
FIGURE 9
FIGURE 9
Proportional spike densities for response features that disappeared or remained during iontophoresis of 8-OH-DPAT. The peak spike densities of response features were normalized to the largest response feature in their respective spike trains.

References

    1. Albert P. R., Vahid-Ansari F. (2019). The 5-HT1A receptor: signaling to behavior. Biochimie 161 34–45. 10.1016/j.biochi.2018.10.015 - DOI - PubMed
    1. Alluri R. K., Rose G. J., Hanson J. L., Leary C. J., Vasquez-Opazo G. A., Graham J. A., et al. (2016). Phasic, suprathreshold excitation and sustained inhibition underlie neuronal selectivity for short-duration sounds. Proc. Natl. Acad. Sci. U.S.A. 113 E1927–E1935. 10.1073/pnas.1520971113 - DOI - PMC - PubMed
    1. Andoni S., Li N., Pollak G. D. (2007). Spectrotemporal receptive fields in the inferior colliculus revealing selectivity for spectral motion in conspecific vocalizations. J. Neurosci. 27 4882–4893. 10.1523/JNEUROSCI.4342-06.2007 - DOI - PMC - PubMed
    1. Barr H. J., Woolley S. C. (2018). Developmental auditory exposure shapes responses of catecholaminergic neurons to socially-modulated song. Sci. Rep. 8:11717. 10.1038/s41598-018-30039-y - DOI - PMC - PubMed
    1. Bartlett E. L. (2013). The organization and physiology of the auditory thalamus and its role in processing acoustic features important for speech perception. Brain Language 126 29–48. 10.1016/j.bandl.2013.03.003 - DOI - PMC - PubMed

Publication types

LinkOut - more resources