. 2021 Aug 27:12:646042.
doi: 10.3389/fphys.2021.646042. eCollection 2021.

Biomechanical Response of the Lower Extremity to Running-Induced Acute Fatigue: A Systematic Review

Affiliations

Biomechanical Response of the Lower Extremity to Running-Induced Acute Fatigue: A Systematic Review

Salil Apte et al. Front Physiol. .

Abstract

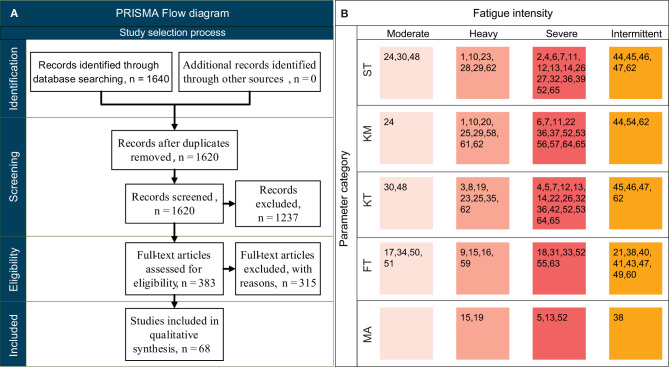
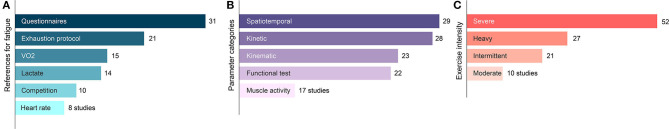
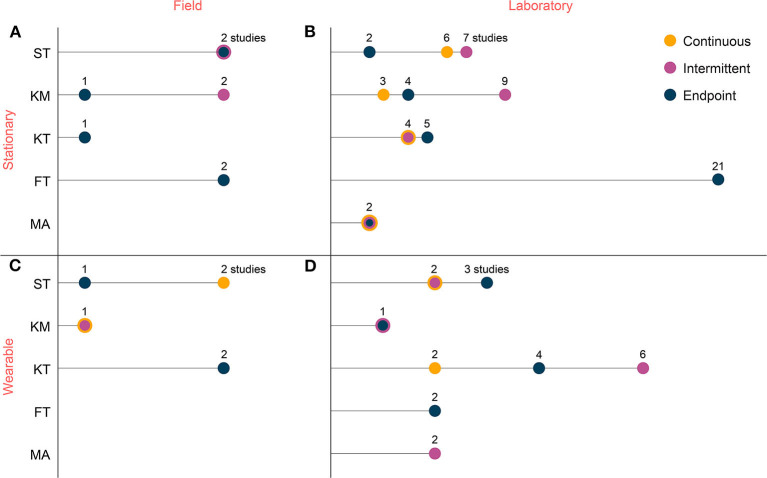
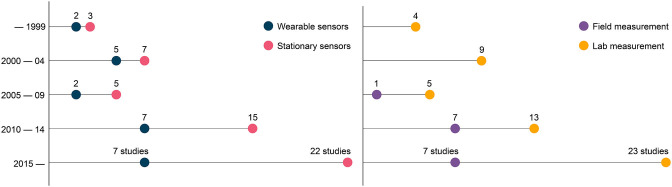
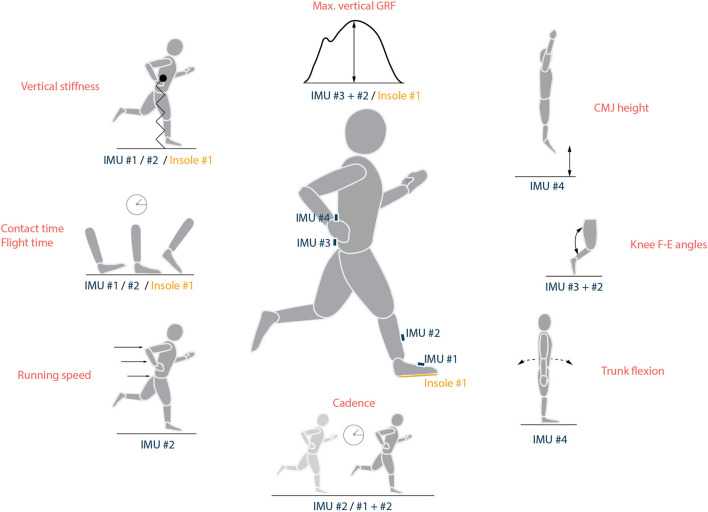
Objective: To investigate (i) typical protocols used in research on biomechanical response to running-induced fatigue, (ii) the effect of sport-induced acute fatigue on the biomechanics of running and functional tests, and (iii) the consistency of analyzed parameter trends across different protocols. Methods: Scopus, Web of Science, Pubmed, and IEEE databases were searched using terms identified with the Population, Interest and Context (PiCo) framework. Studies were screened following the Preferred Reporting Items for Systematic Reviews and Meta-Analyses (PRISMA) guidelines and appraised using the methodological index for non-randomized studies MINORS scale. Only experimental studies with at least 10 participants, which evaluated fatigue during and immediately after the fatiguing run were included. Each study was summarized to record information about the protocol and parameter trends. Summary trends were computed for each parameter based on the results found in individual studies. Results: Of the 68 included studies, most were based on in-lab (77.9%) protocols, endpoint measurements (75%), stationary measurement systems (76.5%), and treadmill environment (54.4%) for running. From the 42 parameters identified in response to acute fatigue, flight time, contact time, knee flexion angle at initial contact, trunk flexion angle, peak tibial acceleration, CoP velocity during balance test showed an increasing behavior and cadence, vertical stiffness, knee extension force during MVC, maximum vertical ground reaction forces, and CMJ height showed a decreasing trend across different fatigue protocols. Conclusion: This review presents evidence that running-induced acute fatigue influences almost all the included biomechanical parameters, with crucial influence from the exercise intensity and the testing environment. Results indicate an important gap in literature caused by the lack of field studies with continuous measurement during outdoor running activities. To address this gap, we propose recommendations for the use of wearable inertial sensors.

Keywords: biomechanics; fatigue research; functional tests; running; systematic review; wearable sensors.


Conflict of interest statement

The authors declare that the research was conducted in the absence of any commercial or financial relationships that could be construed as a potential conflict of interest.

Figures

Figure 1
Figure 1
(A) PRISMA flow chart for study selection, adapted from Page et al. (2021). (B) References for the included 68 studies (1. Siler and Martin, , 2. Verkerke et al., , 3. Voloshin et al., , 4. Willson and Kernozek, , 5. Mizrahi et al., , 6. Mizrahi et al., , 7. Derrick et al., , 8. Dutto and Smith, , 9. Gómez et al., , 10. Avogadro et al., ; 11. Borrani et al., , 12. Mercer et al., , 13. Weist et al., , 14. Gerlach et al., , 15. Racinais et al., , 16. Bisiaux and Moretto, , 17. Nagel et al., , 18. Strang et al., , 19. Wu et al., , 20. Dierks et al., , 21. Perrey et al., , 22. Abt et al., , 23. Alfuth and Rosenbaum, , 24. Chan-Roper et al., ; 25. Clansey et al., , 26. Clansey et al., , 27. Hayes and Caplan, , 28. Stirling et al., , 29. Strohrmann et al., , 30. Willems et al., , 31. Dittrich et al., , 32. Rabita et al., , 33. Steib et al., , 34. Easthope et al., , 35. Garcia-Perez et al., , 36. Hanley and Mohan, , 37. Koblbauer et al., , 38. Timmins et al., ; 39. Ammann and Wyss, , 40. Goodall et al., , 41. Johnston et al., , 42. Anbarian and Esmaeili, , 43. García-Pinillos et al., , 44. García-Pinillos et al., , 45. Girard et al., , 46. Girard et al., , 47. Girard et al., , 48. Rosenbaum et al., , 49. Rosso et al., , 50. Rousanoglou et al., , 51. Anna et al., , 52. Jewell et al., , 53. Radzak et al., ; 54. Bailey et al., , 55. Hamacher et al., , 56. Hoenig et al., , 57. Maas et al., , 58. Mo and Chow, , 59. Ribeiro et al., , 60. Sánchez-Sánchez et al., , 61. Bovalino et al., , 62. Riazati et al., , 63. Yu et al., , 64. Yu et al., , 65. Möhler et al., 2021), presented according to the fatigue intensity and the parameter category, where ST, spatiotemporal; KM, kinematic; KT, kinetic; FT, functional test; MA, muscle activity parameters. Studies that utilized machine-learning approaches (66. Eskofier et al., , 67. Buckley et al., , 68. Op De Beeck et al., 2018) and considered only statistical features in place of traditional metrics are not included in the table as they do not fit into any of the five parameter categories.
Figure 2
Figure 2
Number of studies investigating the different aspects of a fatigue research protocol (A). Reference methods used to ascertain the fatigue intensity; (B) Parameter categories studied by the included protocols; (C) Exercise intensity investigated.
Figure 3
Figure 3
Number of studies per parameters category grouped in terms of the timing of the measurement (continuous, intermittent, and endpoint), sensors (wearable vs. stationary), and location (field vs. laboratory). (A) Field and stationary, (B) laboratory and stationary, (C) field and wearable, and (D) laboratory and wearable. The four sub-figures do not necessarily have the same scale on the x-axis. ST, gait spatiotemporal; KM, kinematics; KT, kinetics; FT, functional test; MA, muscle activity.
Figure 4
Figure 4
Number of studies utilizing wearable and/or stationary measurement systems and conducting research in lab and/or in field. The number of studies has increased drastically after 2010, yet the number of field studies and of those using wearable sensors has remained low.
Figure 5
Figure 5
Parameters that show a consistent trend in response to acute fatigue and a potential wearable sensor setup to measure them. Stride length can be estimated by multiplying running speed and gait cycle time for each stride, while tibial acceleration can be measured directly from IMU#2. IMU, inertial measurement unit.

References

    1. Abt J. P., Sell T. C., Chu Y., Lovalekar M., Burdett R. G., Lephart S. M. (2011). Running kinematics and shock absorption do not change after brief exhaustive running. J. Strength Cond. Res. 25, 1479–1485. 10.1519/JSC.0b013e3181ddfcf8 - DOI - PubMed
    1. Alfuth M., Rosenbaum D. (2011). Long distance running and acute effects on plantar foot sensitivity and plantar foot loading. Neurosci. Lett. 503, 58–62. 10.1016/j.neulet.2011.08.010 - DOI - PubMed
    1. Alonso J. M., Tscholl P. M., Engebretsen L., Mountjoy M., Dvorak J., Junge A. (2010). Occurrence of injuries and illnesses during the 2009 IAAF World Athletics Championships. Br. J. Sports Med. 44, 1100–1105. 10.1136/bjsm.2010.078030 - DOI - PubMed
    1. Ammann R., Wyss T. (2015). Running asymmetries during a 5-km time trial and their changes over time, in icSPORTS 2015 – Proc. 3rd Int. Congr. Sport Sci. Res. Technol. Support (Lisbon: ), 161–164. 10.5220/0005634401610164 - DOI
    1. Anbarian M., Esmaeili H. (2016). Effects of running-induced fatigue on plantar pressure distribution in novice runners with different foot types. Gait Posture 48, 52–56. 10.1016/j.gaitpost.2016.04.029 - DOI - PubMed

Publication types