. 2021 Aug 27:12:701265.
doi: 10.3389/fmicb.2021.701265. eCollection 2021.

Effects of Simulated Microgravity on the Physiology of Stenotrophomonas maltophilia and Multiomic Analysis

Affiliations

Effects of Simulated Microgravity on the Physiology of Stenotrophomonas maltophilia and Multiomic Analysis

Xiaolei Su et al. Front Microbiol. .

Abstract

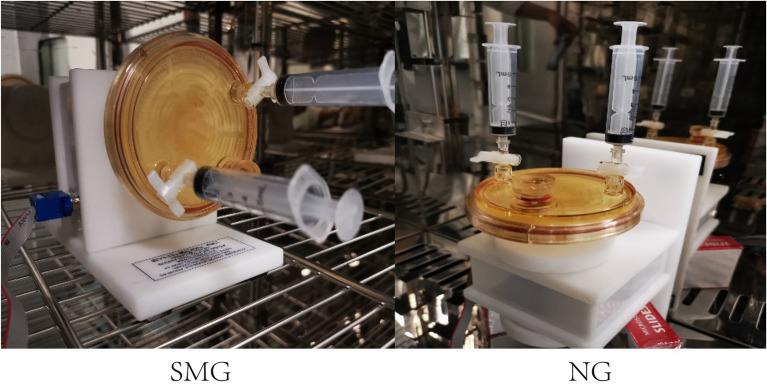
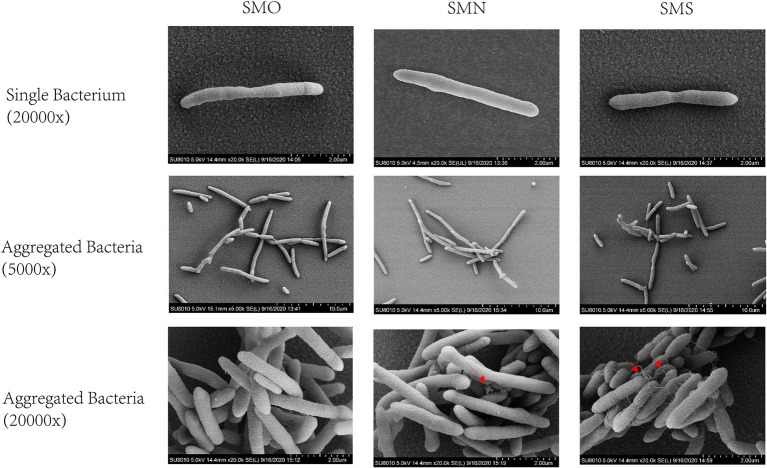
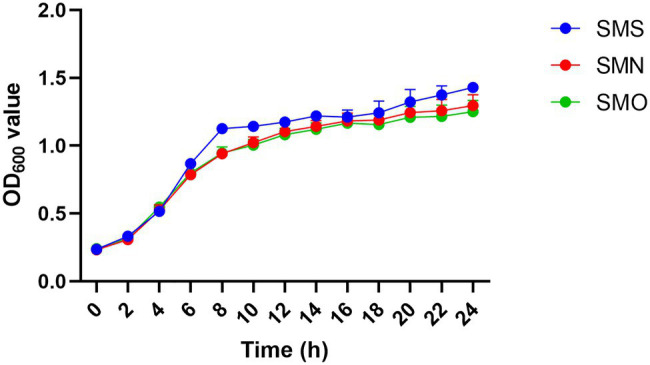
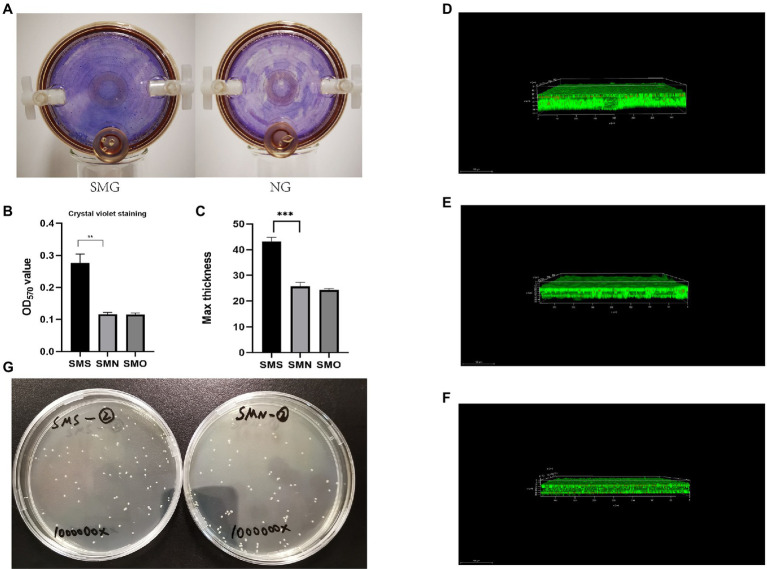
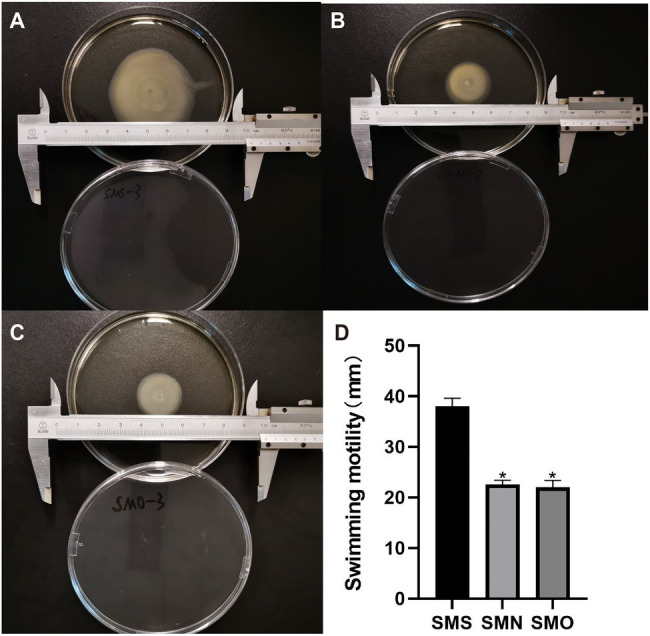
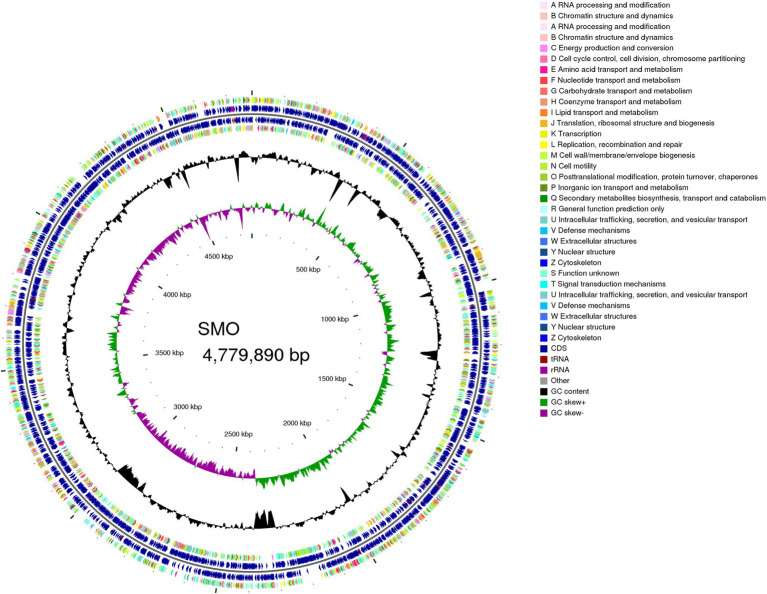
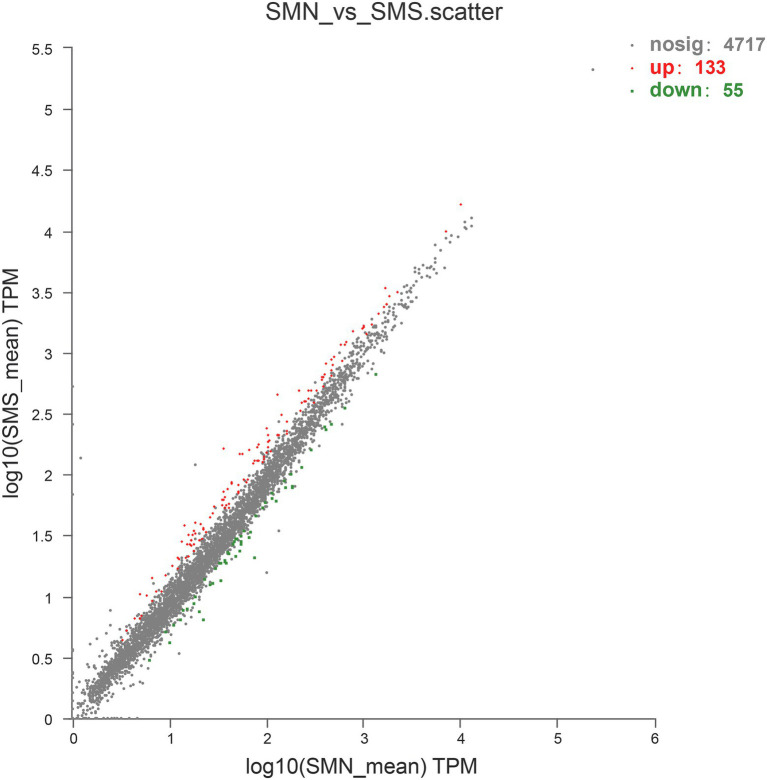
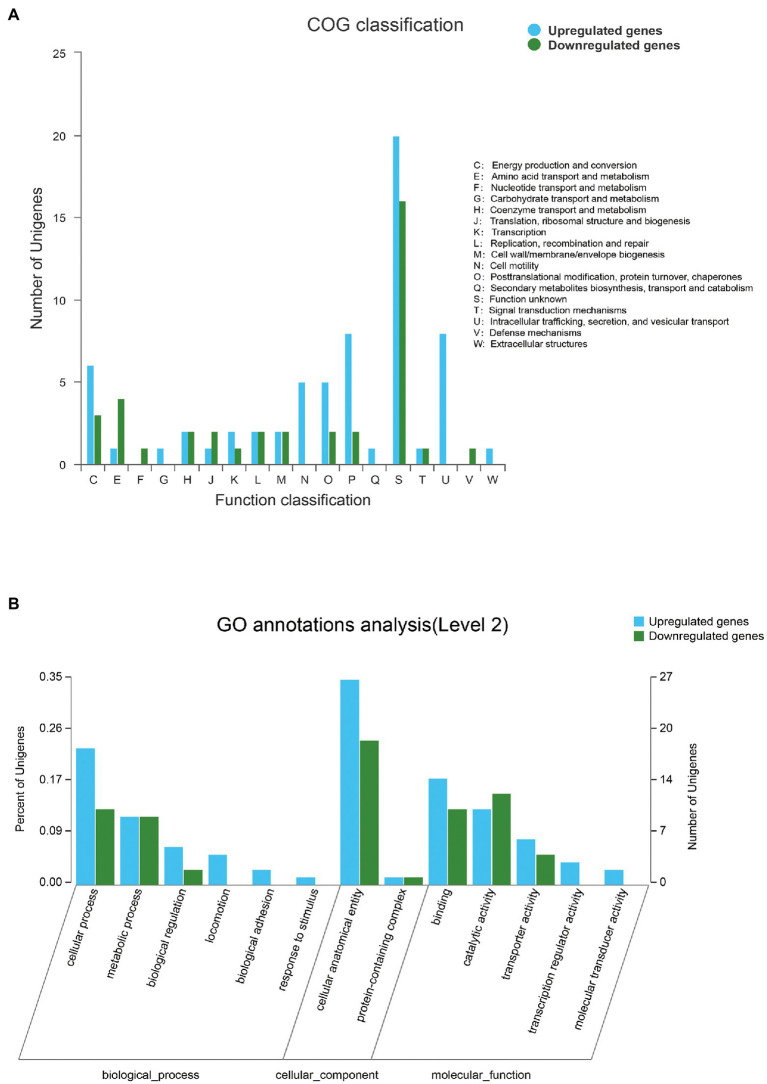
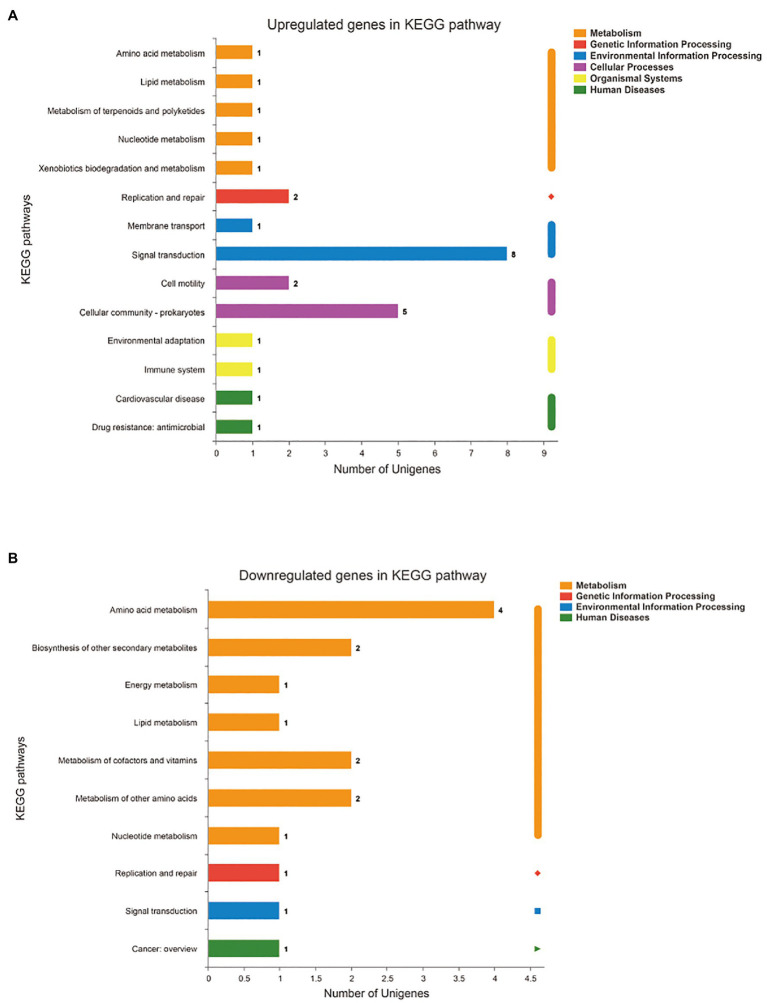
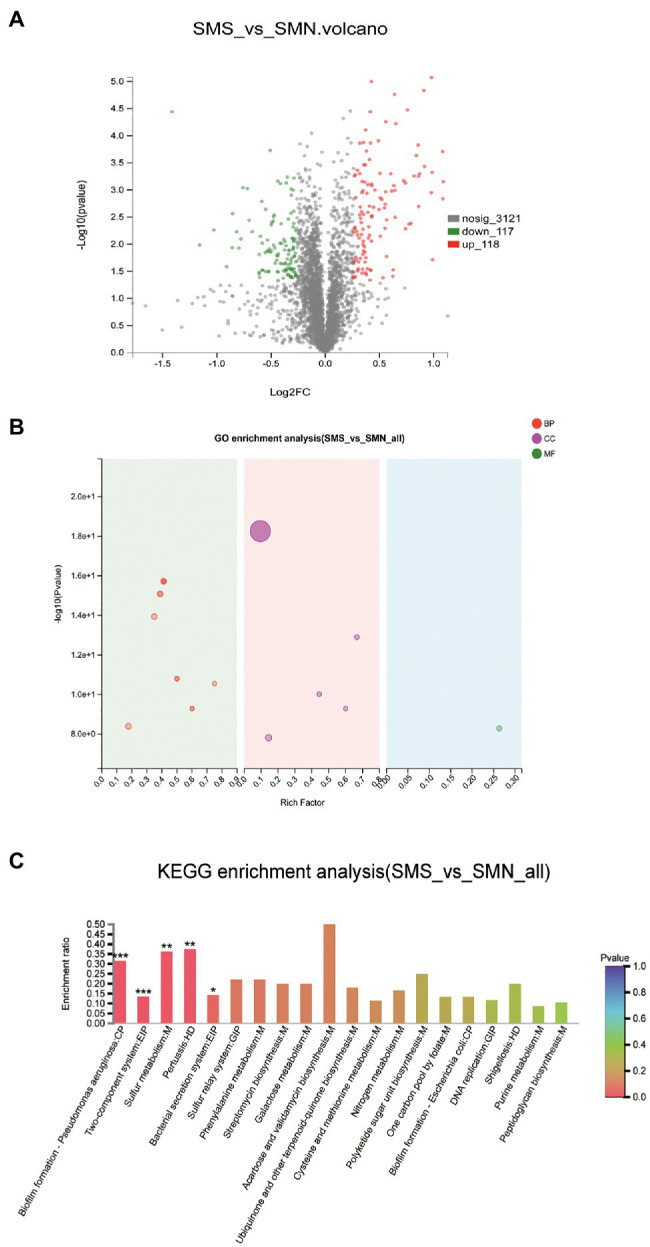
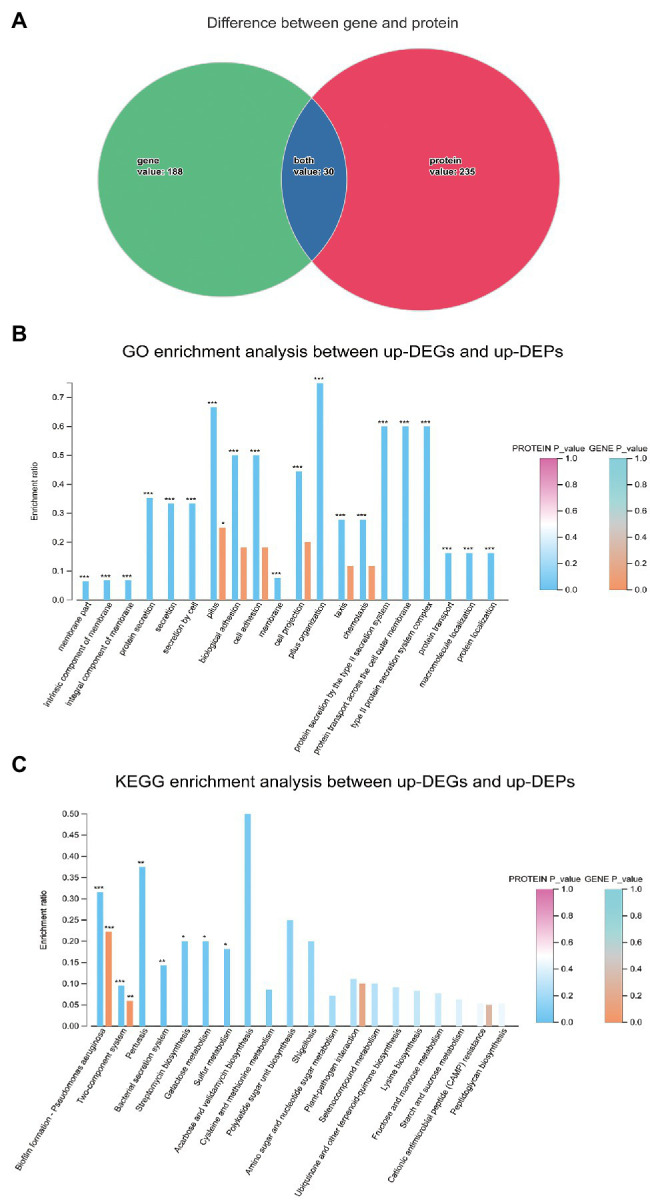
Many studies have shown that the space environment plays a pivotal role in changing the characteristics of conditional pathogens, especially their pathogenicity and virulence. However, Stenotrophomonas maltophilia, a type of conditional pathogen that has shown to a gradual increase in clinical morbidity in recent years, has rarely been reported for its impact in space. In this study, S. maltophilia was exposed to a simulated microgravity (SMG) environment in high-aspect ratio rotating-wall vessel bioreactors for 14days, while the control group was exposed to the same bioreactors in a normal gravity (NG) environment. Then, combined phenotypic, genomic, transcriptomic, and proteomic analyses were conducted to compare the influence of the SMG and NG on S. maltophilia. The results showed that S. maltophilia in simulated microgravity displayed an increased growth rate, enhanced biofilm formation ability, increased swimming motility, and metabolic alterations compared with those of S. maltophilia in normal gravity and the original strain of S. maltophilia. Clusters of Orthologous Groups (COG) annotation analysis indicated that the increased growth rate might be related to the upregulation of differentially expressed genes (DEGs) involved in energy metabolism and conversion, secondary metabolite biosynthesis, transport and catabolism, intracellular trafficking, secretion, and vesicular transport. Gene Ontology (GO) and Kyoto Encyclopedia of Genes and Genomes (KEGG) enrichment analyses showed that the increased motility might be associated the upregulation of differentially expressed proteins (DEPs) involved in locomotion, localization, biological adhesion, and binding, in accordance with the upregulated DEGs in cell motility according to COG classification, including pilP, pilM, flgE, flgG, and ronN. Additionally, the increased biofilm formation ability might be associated with the upregulation of DEPs involved in biofilm formation, the bacterial secretion system, biological adhesion, and cell adhesion, which were shown to be regulated by the differentially expressed genes (chpB, chpC, rpoN, pilA, pilG, pilH, and pilJ) through the integration of transcriptomic and proteomic analyses. These results suggested that simulated microgravity might increase the level of corresponding functional proteins by upregulating related genes to alter physiological characteristics and modulate growth rate, motility, biofilm formation, and metabolism. In conclusion, this study is the first general analysis of the phenotypic, genomic, transcriptomic, and proteomic changes in S. maltophilia under simulated microgravity and provides some suggestions for future studies of space microbiology.

Keywords: Stenotrophomonas maltophilia; biofilm; mobility; multiomic analysis; physiology; simulated microgravity.


Figures

Figure 1
Figure 1
HARV bioreactors in the experimental setup. HARV system used to generate simulated microgravity (SMG) and normal gravity (NG) conditions.
Figure 2
Figure 2
Scanning electron micrographs (SEM) images of Stenotrophomonas maltophilia. The red arrow indicates the intercellular mucus-like substances. The first row showed the morphology of single bacterium under 20,000x SEM. The middle row showed the morphology of aggregated bacteria under 5,000x SEM. The last row showed the morphology of aggregated bacteria under 20,000x SEM.
Figure 3
Figure 3
Growth curves of three S. maltophilia samples. Growth curves of Stenotrophomonas maltophilia in simulated microgravity (SMS; blue), S. maltophilia in normal gravity (SMN; red), and original strain of S. maltophilia (SMO; green) were determined by measuring the OD600 value.
Figure 4
Figure 4
Biofilm formation assay. (A) Quantitative analysis of biofilm formation ability via crystal violet. The three groups were cultured in 24-well plate at 37°C and 200rpm for 24h. Biofilm formation ability was measured by determining the OD570 of crystal violet. (B) Quantitative analysis of biofilm formation ability via crystal violet. The three groups were cultured in 24-well plate at 37°C and 200rpm for 24h. Biofilm formation ability was measured by determining the OD570 of crystal violet. (C) Biofilms of SMS, SMN, and SMO cultured in 35-mm confocal dished. Cells were stained with a Filmtracer™ (LIVE/DEAD Biofilm Viability Kit), and biofilm formation ability was detected using confocal laser-scanning microscopy (CLSM). Green fluorescence indicates live cells and red fluorescence indicates dead cells. The maximum thickness of biofilm of SMS, SMN, and SMO were (43.17±2.73; 25.75±1.59), and (25.36±1.56) μm, respectively. **p<0.01 and ***p<0.001. (D) Analysis of biofilm formation ability of SMS samples using CLSM. (E) Analysis of biofilm formation ability of SMN samples using CLSM. (F) Analysis of biofilm formation ability of SMO samples using CLSM. (G) Colony forming unit (CFU) assay of SMS and SMN samples.
Figure 5
Figure 5
Effect of SMG on mobility of S. maltophilia. For the swimming motility, three groups were inoculated on a surface of 0.1% (w/v) Bacto agar plates. Swimming haloes were gauged after 48h of incubation at 37°C. Zone diameters (means±SD; n=3) are listed for each group. (A) SMS (37.96±1.34mm), (B) SMN (22.56±0.68mm), and (C) SMO (21.96±1.13mm). (D) Asterisks (*) indicate statistically significant change (p<0.05) compared to that of SMS group. *p<0.05.
Figure 6
Figure 6
Genome map of SMO. From outer to inner circle: CDS on the positive-strand, different colors indicate different Clusters of Orthologous Groups (COG) function classifications (ring 1), CDS, transfer RNA (tRNA), ribosome RNA (rRNA) on the positive-strand (ring 2), CDS, tRNA, and rRNA on the negative-strand (ring 3), CDS on the negative-strand, different colors indicate different COG function classifications (ring 4), GC content (ring 5), GC-Skew (ring 6).
Figure 7
Figure 7
Upregulated and downregulated genes expressed in SMS compared with that in SMN. The values of the abscissa and ordinate have been algorithmized, and each point represents a specific gene. The abscissa corresponding to a specific point is the expression level of the gene in SMN, and the ordinate is the expression level of the gene in SMS.
Figure 8
Figure 8
(A) Distribution of differentially expressed genes (DEGs) between SMS and SMN in the cluster of COG. The X-axis represents the functional type of COG, and the Y-axis represents the number of genes. (B) Distribution of DEGs in Gene Ontology (GO) functional categories. The X-axis represents the secondary classification terms of GO, the Y-axis on the left represents the percentage of genes included in the secondary classification, the right represents the number of genes compared with the secondary classification, and the three colors represent the three major classifications.
Figure 9
Figure 9
Functional annotation and enrichment of genes of SMS. (A) Kyoto Encyclopedia of Genes and Genomes (KEGG) pathway of upregulated genes in SMS. (B) KEGG pathway of downregulated genes in SMS. The X-axis of (A) and (B) is the number of genes annotated to the KEGG pathway, the Y-axis of (A) and (B) is the name KEGG metabolic pathway.
Figure 10
Figure 10
Comparative proteomic analysis. (A). Differentially expressed proteins (DEPs) between SMS and SMN. The X-axis is the fold change value of the difference in the protein expression between the two groups. The Y-axis is the statistical test value of the DEPs. The value of abscissa and ordinate have been logarithmized. Each point in the figure represents a specific protein. The green points are downregulated proteins and red points represent upregulated proteins. (B). GO enrichment analysis of SMS and SMN. The X-axis is the rich factor. The Y-axis is -log10 (value of p). Each bubble in the figure represents a secondary GO category. The size of the bubble is directly proportional to the number of concentrated proteins enriched in this GO secondary classification (BP, biological process; CC, cellular component; and MF, molecular function). (C). KEGG enrichment analysis of DEPs between SMS and SMN.
Figure 11
Figure 11
Integration of transcriptomic and proteomic analysis. (A). The overlapping genes expressed differently in both the transcriptome and proteome. (B). GO enrichment analysis between up-DEGs and up-DEPs. (C). KEGG enrichment analysis between up-DEGs and up-DEPs.

References

    1. Amin R., Waters V. (2016). Antibiotic treatment for Stenotrophomonas maltophilia in people with cystic fibrosis. Cochrane Database Syst. Rev. 7:Cd009249. 10.1002/14651858.CD009249.pub4, PMID: - DOI - PMC - PubMed
    1. An X., Tian C., Xu J., Dong F., Liu X., Wu X., et al. . (2020). Characterization of hexaconazole-degrading strain Sphingobacterium multivorum and analysis of transcriptome for biodegradation mechanism. Sci. Total Environ. 722:137171. 10.1016/j.scitotenv.2020.137171, PMID: - DOI - PubMed
    1. Benoit M. R., Klaus D. M. (2007). Microgravity, bacteria, and the influence of motility. Adv. Space Res. 39, 1225–1232. 10.1016/j.asr.2006.10.009 - DOI
    1. Brown R. B., Klaus D., Todd P. (2002). Effects of space flight, clinorotation, and centrifugation on the substrate utilization efficiency of E. coli. Microgravity Sci. Technol. 13, 24–29. 10.1007/BF02881678, PMID: - DOI - PubMed
    1. Cao C., Wang J., Liu Y., Kwok L. Y., Zhang H., Zhang W. (2020). Adaptation of Lactobacillus plantarum to ampicillin involves mechanisms that maintain protein homeostasis. mSystems 5, e00853–e00819. 10.1128/mSystems.00853-19 - DOI - PMC - PubMed

LinkOut - more resources