. 2021 Aug 26:12:715991.
doi: 10.3389/fmicb.2021.715991. eCollection 2021.

Brazilian Semi-Arid Mangroves-Associated Microbiome as Pools of Richness and Complexity in a Changing World

Affiliations

Brazilian Semi-Arid Mangroves-Associated Microbiome as Pools of Richness and Complexity in a Changing World

Tallita Cruz Lopes Tavares et al. Front Microbiol. .

Abstract

Mangrove microbiomes play an essential role in the fate of mangroves in our changing planet, but the factors regulating the biogeographical distribution of mangrove microbial communities remain essentially vague. This paper contributes to our understanding of mangrove microbiomes distributed along three biogeographical provinces and ecoregions, covering the exuberant mangroves of Amazonia ecoregion (North Brazil Shelf) as well as mangroves located in the southern limit of distribution (Southeastern ecoregion, Warm Temperate Southwestern Atlantic) and mangroves localized on the drier semi-arid coast (Northeastern ecoregion, Tropical Southwestern Atlantic), two important ecotones where poleward and landward shifts, respectively, are expected to occur related to climate change. This study compared the microbiomes associated with the conspicuous red mangrove (Rhizophora mangle) root soils encompassing soil properties, latitudinal factors, and amplicon sequence variants of 105 samples. We demonstrated that, although the northern and southern sites are over 4,000 km apart, and despite R. mangle genetic divergences between north and south populations, their microbiomes resemble each other more than the northern and northeastern neighbors. In addition, the northeastern semi-arid microbiomes were more diverse and displayed a higher level of complexity than the northern and southern ones. This finding may reflect the endurance of the northeast microbial communities tailored to deal with the stressful conditions of semi-aridity and may play a role in the resistance and growing landward expansion observed in such mangroves. Minimum temperature, precipitation, organic carbon, and potential evapotranspiration were the main microbiota variation drivers and should be considered in mangrove conservation and recovery strategies in the Anthropocene. In the face of changes in climate, land cover, biodiversity, and chemical composition, the richness and complexity harbored by semi-arid mangrove microbiomes may hold the key to mangrove adaptability in our changing planet.

Keywords: Rhizophora mangle; amplicon sequence variants; blue carbon; network co-occurrence analysis; red mangrove; soil microbial community.


Conflict of interest statement

The authors declare that the research was conducted in the absence of any commercial or financial relationships that could be construed as a potential conflict of interest.

Figures

FIGURE 1
FIGURE 1
Map indicating the geographical locations of the sampling sites. Five sampling points were sampled at each mangrove, each comprising three subsamples. A total of seven mangroves were studied; in the North: Salinópolis (SAL) and Bragança (BRA); in the Northeast: Cocó (COC), Jaguaribe (JAG), and Icapuí (ICA); and in the South: Paranaguá (PAR) and Guaratuba (GUA).
FIGURE 2
FIGURE 2
Triplot diagram of the Principal component analysis (PCA) indicating the orientation pattern based on the variability of abiotic variables in the seven studied mangroves. The two first principal components are plotted with the proportion of variance explained by each component shown in parentheses in the axis titles. Abbreviated abiotic variables: Tmin (Minimum Temperature); PCT (Precipitation); Evapotrans (Potential Evapotranspiration); Fe (iron); N (Total Nitrogen); OC (Organic Carbon); SiltClay (Silt and Clay content); and S (Sulfur).
FIGURE 3
FIGURE 3
Box plots showing the richness (Observed richness and Chao1) and alpha diversity (Shannon and Inverted Simpson indices) of microbial communities in the root zone of Rhizophora mangle from seven mangroves in the north (green), northeast (red), and south (blue) Brazilian regions. Taxonomic diversity is based on ASV level. Error bars represent the standard deviation of 15 independent replicates (five sampling points with three replicates from each mangrove). Different lowercase letters refer to significant differences between treatments based on Tukey’s HSD test (P < 0.05) for the Shannon and Inverted Simpson indices and the Kruskal–Wallis test for Observed richness and Chao1.
FIGURE 4
FIGURE 4
Relationships between Shannon index and Salinity, Potential Evapotranspiration, Precipitation, and Minimum temperature in the Rhizophora mangle root-associated soil microbiomes. The black lines represent linear regressions, and the shaded areas show the 95% confidence interval.
FIGURE 5
FIGURE 5
Box plots showing the abundance distribution of the main indicator genera of Rhizophora mangle root-associated soil microbiomes at North (N), Northeast (NE), and South (S).
FIGURE 6
FIGURE 6
Triplot diagram of the canonical correspondence analysis (CCA) calculated from the dataset containing 35 samples (five sampling points from each mangrove) containing only significant explanatory variables (P < 0.05) and prokaryotic ASV composition for samples from the seven studied mangroves [BRA = Bragança (N); SAL = Salinópolis (N); COC = Cocó (NE); JAG = Jaguaribe (NE); ICA = Icapuí (NE); GUA = Guaratuba (S); and PAR = Paranaguá (S)]. CCA 1 (F = 3.0563, P = 0.001) and CCA 2 (F = 2.5695, P = 0.001) axes were significant and explained 62.85% of the data. Abbreviated abiotic variables: Tmin (Minimum Temperature); PCT (Precipitation); Evapotrans (Potential Evapotranspiration); and OC (Organic Carbon).
FIGURE 7
FIGURE 7
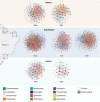
Co-occurrence network based on correlation analysis. A connection stands for a Spearman’s correlation with magnitude >0.7 (positive correlation–blue edges) or <–0.7 (negative correlation–red edges) and statistically significant (P < 0.01). The size of each node is proportional to the number of connections (degree). Each node was labeled at the phylum level.

References

    1. Adame M. F., Connolly R. M., Turschwell M. P., Lovelock C. E., Fatoyinbo T., Lagomasino D., et al. (2021). Future carbon emissions from global mangrove forest loss. Glob. Chang. Biol. 2021 1–11. 10.1111/gcb.15571 - DOI - PMC - PubMed
    1. Allard S. M., Costa M. T., Bulseco A. N., Helfer V., Wilkins L. G. E., Hassenrück C., et al. (2020). Introducing the Mangrove Microbiome Initiative: Identifying Microbial Research Priorities and Approaches To Better Understand, Protect, and Rehabilitate Mangrove Ecosystems. mSystems 5:20. 10.1128/mSystems.00658-20 - DOI - PMC - PubMed
    1. Alongi D. M. (2008). Mangrove forests: Resilience, protection from tsunamis, and responses to global climate change. Estuar. Coast. Shelf Sci. 76 1–13. 10.1016/j.ecss.2007.08.024 - DOI
    1. Alongi D. M. (2014). Carbon Cycling and Storage in Mangrove Forests. Ann. Rev. Mar. Sci. 6 195–219. 10.1146/annurev-marine-010213-135020 - DOI - PubMed
    1. Alongi D. M. (2015). The Impact of Climate Change on Mangrove Forests. Curr. Clim. Chang. Rep. 1 30–39. 10.1007/s40641-015-0002-x - DOI

LinkOut - more resources