. 2021 Jul 6;12(8):4700-4712.
doi: 10.1364/BOE.431534. eCollection 2021 Aug 1.

Estimation of core body temperature by near-infrared imaging of vein diameter change in the dorsal hand

Affiliations

Estimation of core body temperature by near-infrared imaging of vein diameter change in the dorsal hand

Mohiuddin Khan Shourav et al. Biomed Opt Express. .

Abstract

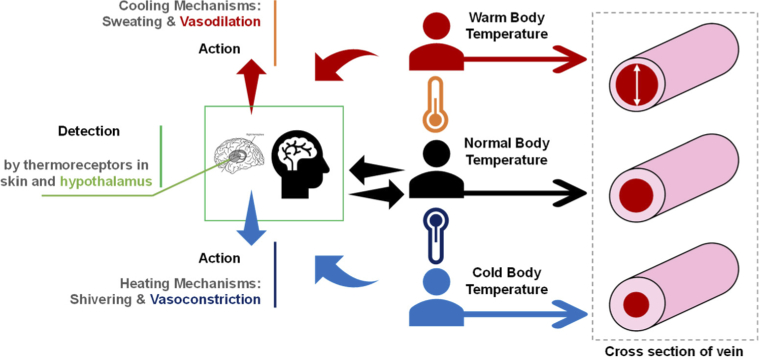
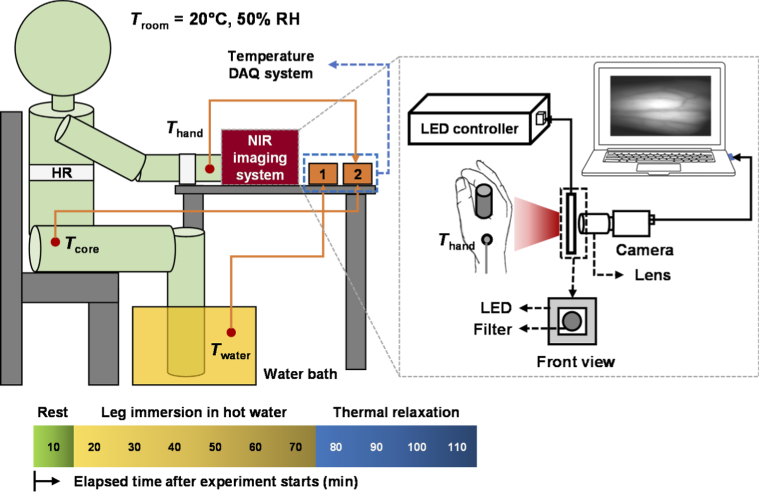
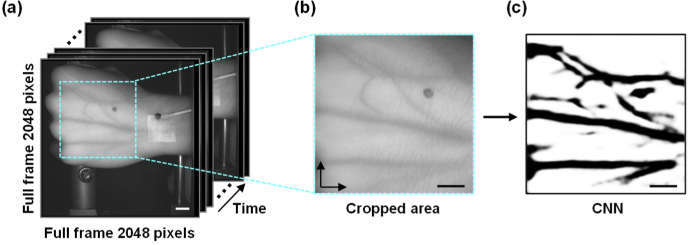
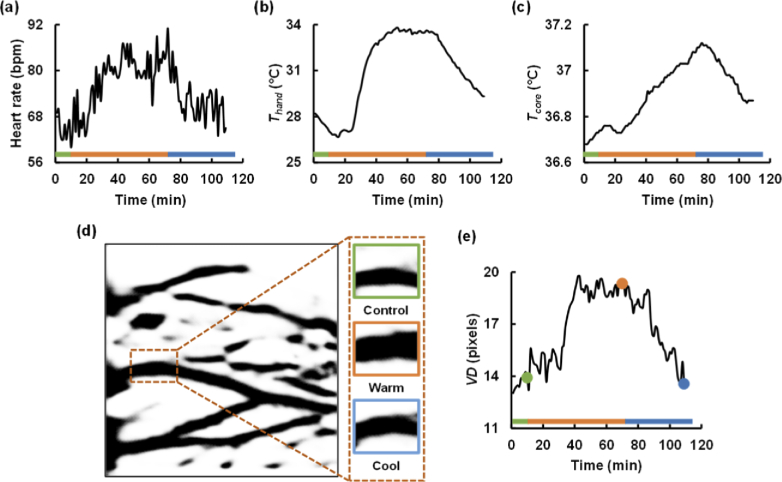
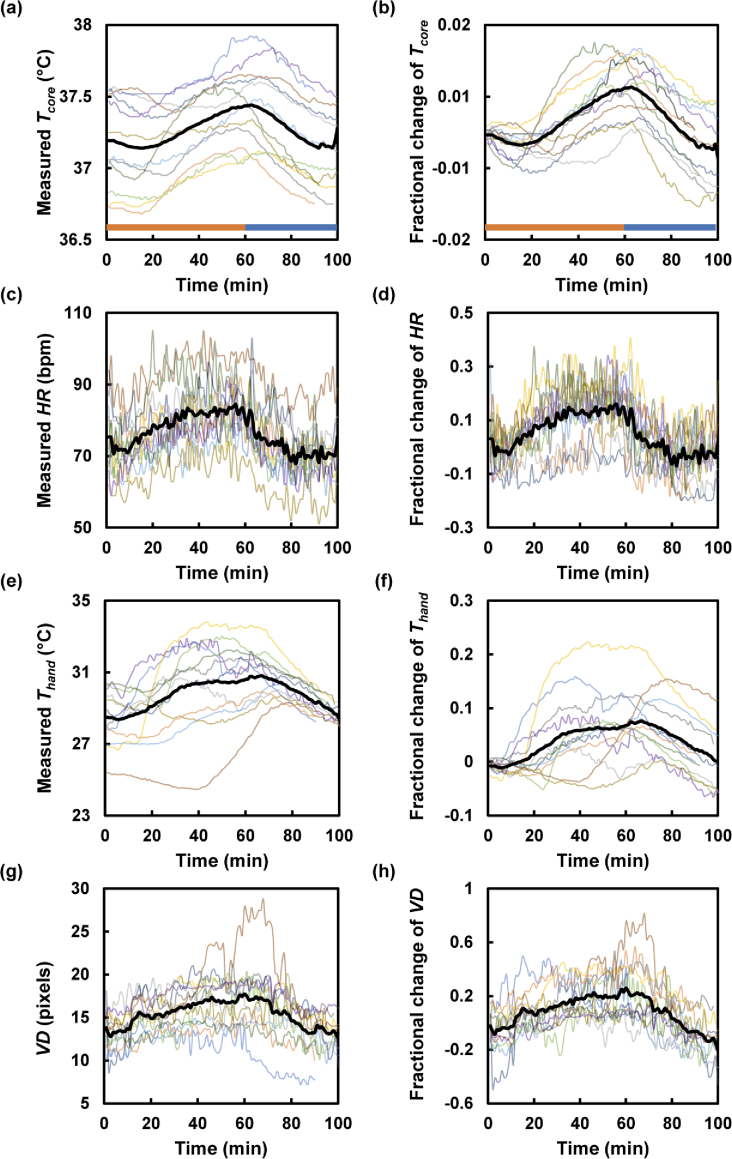
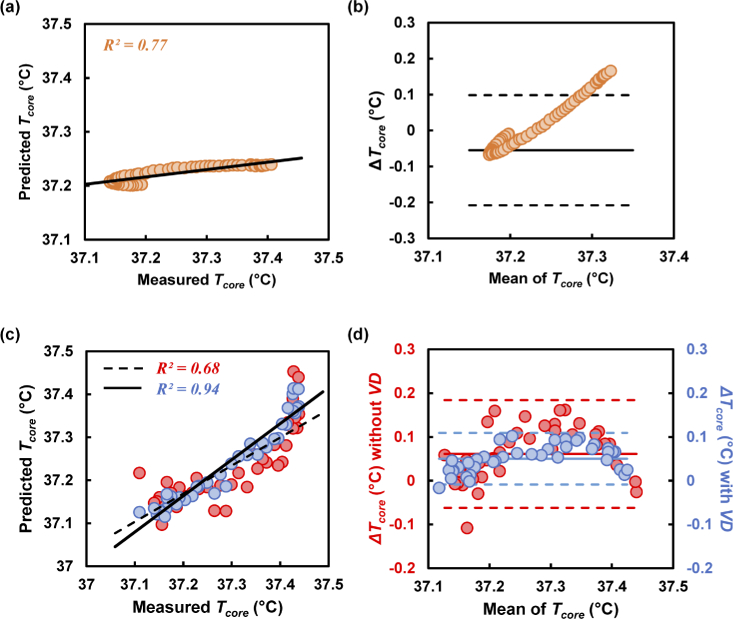
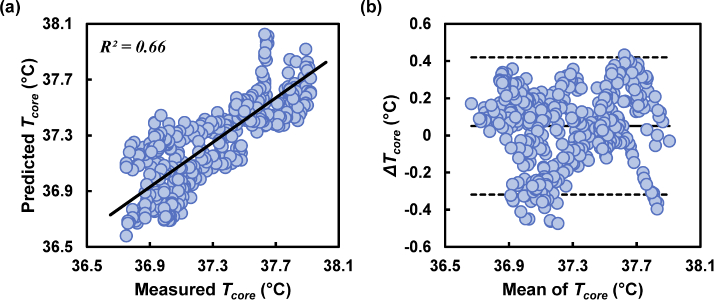
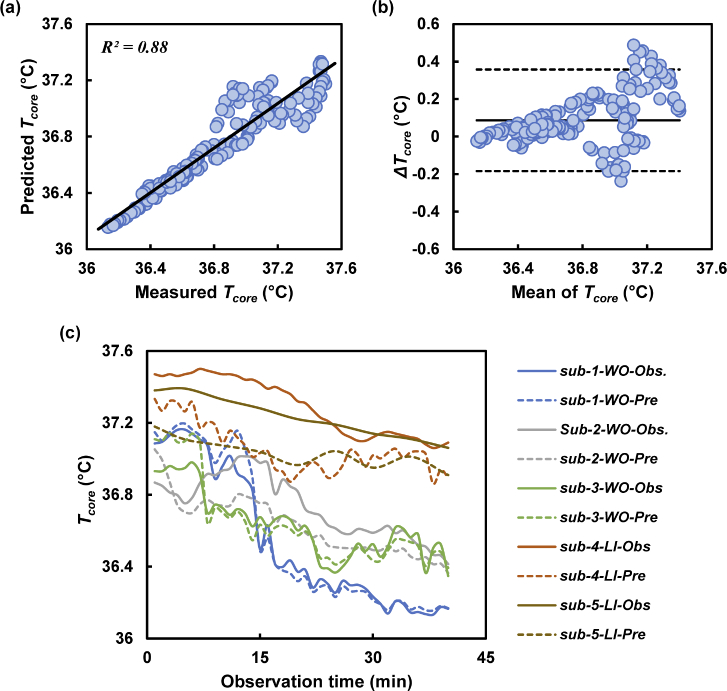
Core body temperature (Tcore ) is a key indicator of personal thermal comfort and serves as a monitor of thermal strain. Multi-parametric sensors are not practical for estimating core temperature because they require long data collection times and a wide variety of settings. This study introduces dorsal hand vein dynamics as a novel indicator along with heart rate (HR) and dorsal hand skin temperature (Thand ) for predicting Tcore during rest following Tcore elevation. Twelve healthy males aged 27 ± 9 years old participated in the experiment. The experimental procedure consisted of a 10-min rest followed by 60 min of passive heat stress induced by leg immersion in hot water at 42°C and a 40-min thermal relaxation period after the legs were removed from the water. A near-infrared (NIR) imaging system was configured to monitor the dorsal hand veins during the entire experimental session. The values of HR, Thand , and Tcore were continuously monitored while the ambient temperature and relative humidity (RH) were maintained in a climate chamber at 20°C and 50%, respectively. Our selected predictor parameters demonstrated similar patterns in the Tcore such that the value increased as a result of passive heat stress and decreased in the thermal relaxation phase. The experimental data were divided into two phases: thermal stress and relaxation. At the resting condition, inclusion of the hand vein diameter (VD) improved the multiple linear regression value (R2 ) about 26%. At the relaxation phase, however, training regressions R2 = 0.68 and R2 = 0.94 were observed in the regression model with and without considering VD, respectively. The test regression value of R2 = 0.88 and the root mean square error (RMSE) of 0.18°C showed good agreement with the predicted values. These findings demonstrate acceptable validity of the non-invasive Tcore estimation at the resting condition. In particular, the inclusion of VD as a predictor in the regression analysis increases the prediction accuracy with a lower RMSE value.


Conflict of interest statement

The authors declare no conflicts of interest.

Figures

Fig. 1.
Fig. 1.
Schematic diagram describing the role of vein dynamics in thermoregulation.
Fig. 2.
Fig. 2.
Schematic diagram of the experimental setup for elevating core temperature (Tcore) by hot water leg immersion and for near-infrared (NIR) imaging of the dorsal hand veins. Thermocouple temperature sensors were connected to a data logger for recording Tcore and the skin temperature in dorsal hand (Thand). Another temperature sensor was placed in the water bath to monitor the water temperature (Twater). For data collection, a heart rate (HR) measurement sensor was attached to the subject’s chest, and a monitor was secured around the wrist.
Fig. 3.
Fig. 3.
(a) Region of interest (ROI) set in the sequential images based on the visibility and existence of the vein. (b) Cropped image focusing on the vein pattern in the ROI. (c) The cropped images were further processed to enhance the veins using the convolutional neural network (CNN). Scale bar = 10 mm.
Fig. 4.
Fig. 4.
Thermal response of one subject to core temperature (Tcore) elevation. The green, orange, and blue bars in the panels indicate the resting, heat stress, and relaxation phases, respectively. Heart rate (HR), hand skin temperature (Thand), and Tcore increased at the thermal stress phase and decreased at the relaxation phase, as shown in (a), (b), and (c), respectively. (d) Processed images of dorsal metacarpal vein in a region of interest (ROI) under control, warm, and cool conditions. The insets are cropped images of the veins in the ROI at different time points indicated in (e). (e) Vein diameter (VD) versus time plot, showing that the VD variation follows the trend of Tcore change.
Fig. 5.
Fig. 5.
Thermal responses of all subjects (n = 12) after leg immersion in hot water for 60 min. The plots in (a), (c), (e), and (g) include raw data for Tcore, HR, Thand, and VD response measured every 1 min, respectively. The plots in (b), (d), (f), and (h) show fractional changes in Tcore, HR, Thand, and VD, respectively. The orange and blue bars in (a) and (b) indicate the thermal stress and relaxation phases, respectively. The black solid lines show the average of the thermal responses of all subjects.
Fig. 6.
Fig. 6.
(a) Tcore prediction at the thermal phase. (b) Difference between predicted and measured TcoreTcore) plotted against the mean Tcore. (c) Scatter plot between measured and predicted Tcore at the relaxing phase. The red and blue circles represent the predicted values excluding and including VD, respectively. The black straight and dashed lines in the scatter plot represent agreement between the measured and predicted values including and excluding VD. (d) Bland–Altman plot showing the limit of agreement for predicting Tcore including and excluding VD in the MLR model.
Fig. 7.
Fig. 7.
Multiple linear regression analysis and prediction accuracy according to Bland–Altman analysis. (a) Accuracy of R2 prediction by considering VD in the MLR prediction model. (b) Bland–Altman plot showing the maximum possible difference from the measured values.
Fig. 8.
Fig. 8.
Prediction model validated using the test data. (a) Good linearity (R2 = 0.88) shown with the test sets of data for predicting Tcore. (b) The error was measured within an acceptable range. (c) Time course of Tcore measurement plotted to observe similar trends between the measured (solid line) and predicted (dotted line) values.

References

    1. Taylor N. A. S., Tipton M. J., Kenny G. P., “Considerations for the measurement of core, skin and mean body temperatures,” Journal of Thermal Biology 46, 72–101 (2014).10.1016/j.jtherbio.2014.10.006 - DOI - PubMed
    1. Yokota M., Berglund L., Cheuvront S., Santee W., Latzka W., Montain S., Kolka M., Moran D., “Thermoregulatory model to predict physiological status from ambient environment and heart rate,” Comput. Biol. Med. 38(11-12), 1187–1193 (2008).10.1016/j.compbiomed.2008.09.003 - DOI - PubMed
    1. Welles A. P., Xu X., Santee W. R., Looney D. P., Buller M. J., Potter A. W., Hoyt R. W., “Estimation of core body temperature from skin temperature, heat flux, and heart rate using a Kalman filter,” Comput. Biol. Med. 99, 1–6 (2018).10.1016/j.compbiomed.2018.05.021 - DOI - PubMed
    1. Niedermann R., Wyss E., Annaheim S., Psikuta A., Davey S., Rossi R. M., “Prediction of human core body temperature using non-invasive measurement methods,” Int J Biometeorol 58(1), 7–15 (2014).10.1007/s00484-013-0687-2 - DOI - PubMed
    1. Yokota M., Berglund L. G., Santee W. R., Buller M. J., Karis A. J., Roberts W. S., Cuddy J. S., Ruby B. C., Hoyt R. W., “Applications of real-time thermoregulatory models to occupational heat stress: validation with military and civilian field studies,” J. Strength Cond. Res. 26, S37–S44 (2012).10.1519/JSC.0b013e31825ceba4 - DOI - PubMed

LinkOut - more resources