

Rapid pseudo-H&E imaging using a fluorescence-inbuilt optical coherence microscopic imaging system
- PMID: 34513247
- PMCID: PMC8407814
- DOI: 10.1364/BOE.431586
Rapid pseudo-H&E imaging using a fluorescence-inbuilt optical coherence microscopic imaging system
Abstract
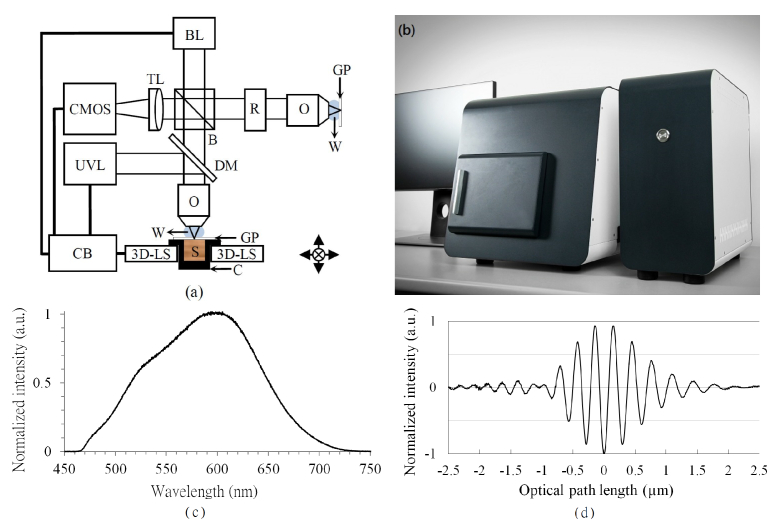
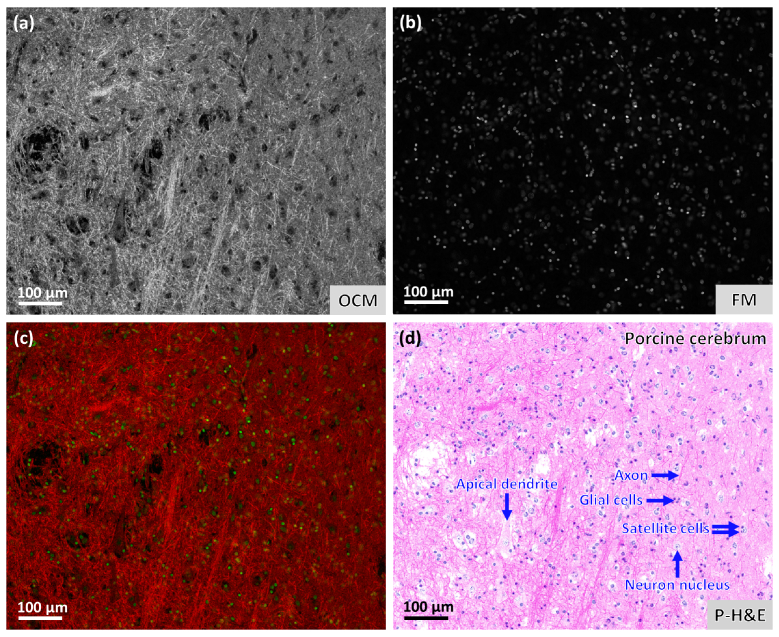
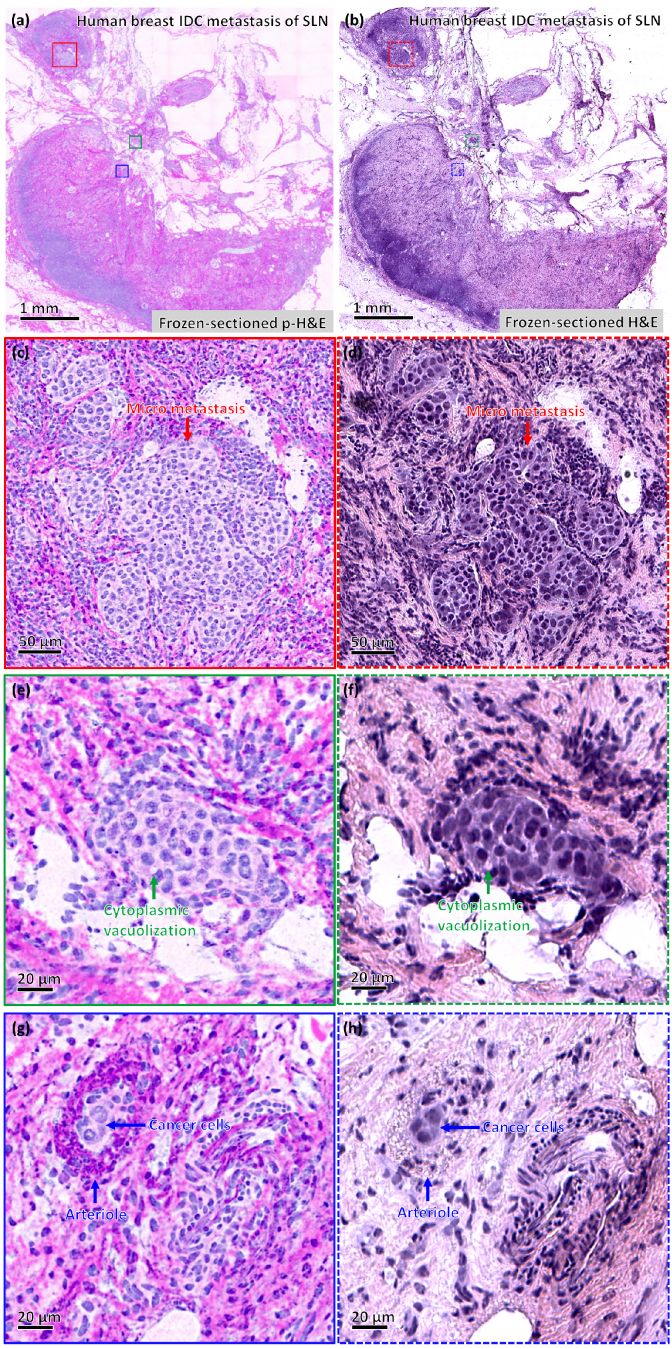
A technique using Linnik-based optical coherence microscopy (OCM), with built-in fluorescence microscopy (FM), is demonstrated here to describe cellular-level morphology for fresh porcine and biobank tissue specimens. The proposed method utilizes color-coding to generate digital pseudo-H&E (p-H&E) images. Using the same camera, colocalized FM images are merged with corresponding morphological OCM images using a 24-bit RGB composition process to generate position-matched p-H&E images. From receipt of dissected fresh tissue piece to generation of stitched images, the total processing time is <15 min for a 1-cm2 specimen, which is on average two times faster than frozen-section H&E process for fatty or water-rich fresh tissue specimens. This technique was successfully used to scan human and animal fresh tissue pieces, demonstrating its applicability for both biobank and veterinary purposes. We provide an in-depth comparison between p-H&E and human frozen-section H&E images acquired from the same metastatic sentinel lymph node slice (∼10 µm thick), and show the differences, like elastic fibers of a tiny blood vessel and cytoplasm of tumor cells. This optical sectioning technique provides histopathologists with a convenient assessment method that outputs large-field H&E-like images of fresh tissue pieces without requiring any physical embedment.
© 2021 Optical Society of America under the terms of the OSA Open Access Publishing Agreement.
Conflict of interest statement
The authors declare no conflicts of interest related to this article.
Figures


Similar articles
-
Feasibility of Breast Cancer Metastasis Assessment of Ex Vivo Sentinel Lymph Nodes through a p-H&E Optical Coherence Microscopic Imaging System.Cancers (Basel). 2022 Dec 10;14(24):6081. doi: 10.3390/cancers14246081. Cancers (Basel). 2022. PMID: 36551567 Free PMC article.
-
Rapid digital pathology of H&E-stained fresh human brain specimens as an alternative to frozen biopsy.Commun Med (Lond). 2023 May 30;3(1):77. doi: 10.1038/s43856-023-00305-w. Commun Med (Lond). 2023. PMID: 37253966 Free PMC article.
-
Integrated local binary pattern texture features for classification of breast tissue imaged by optical coherence microscopy.Med Image Anal. 2017 May;38:104-116. doi: 10.1016/j.media.2017.03.002. Epub 2017 Mar 8. Med Image Anal. 2017. PMID: 28327449 Free PMC article.
-
Multimodal optical imaging with multiphoton microscopy and optical coherence tomography.J Biophotonics. 2012 May;5(5-6):396-403. doi: 10.1002/jbio.201100138. Epub 2012 Mar 28. J Biophotonics. 2012. PMID: 22461146 Review.
-
[Full-field OCT].Med Sci (Paris). 2006 Oct;22(10):859-64. doi: 10.1051/medsci/20062210859. Med Sci (Paris). 2006. PMID: 17026940 Review. French.
Cited by
-
Feasibility of Breast Cancer Metastasis Assessment of Ex Vivo Sentinel Lymph Nodes through a p-H&E Optical Coherence Microscopic Imaging System.Cancers (Basel). 2022 Dec 10;14(24):6081. doi: 10.3390/cancers14246081. Cancers (Basel). 2022. PMID: 36551567 Free PMC article.
-
Experimental and numerical investigation of wavelength and resolution dependency of dynamic optical coherence tomography signals.Biomed Opt Express. 2025 Jul 7;16(8):3084-3104. doi: 10.1364/BOE.564030. eCollection 2025 Aug 1. Biomed Opt Express. 2025. PMID: 40809984 Free PMC article.
-
Harnessing the power of optical microscopy for visualization and analysis of histopathological images.Biomed Opt Express. 2023 Sep 26;14(10):5451-5465. doi: 10.1364/BOE.501893. eCollection 2023 Oct 1. Biomed Opt Express. 2023. PMID: 37854561 Free PMC article. Review.
-
Tissue harvest with a laser microbiopsy.J Biomed Opt. 2022 Dec;27(12):125001. doi: 10.1117/1.JBO.27.12.125001. Epub 2022 Dec 14. J Biomed Opt. 2022. PMID: 36530344 Free PMC article.
References
-
- Fercher A. F., Hitzenberger C. K., Kamp G., El-Zaiat S. Y., “Measurement of intraocular distances by backscattering spectral interferometry,” Opt. Commun. 117(1-2), 43–48 (1995).10.1016/0030-4018(95)00119-S - DOI
LinkOut - more resources
Full Text Sources