. 2022 Jan 18;107(2):e619-e630.
doi: 10.1210/clinem/dgab673.

Early Changes in Immune Cell Count, Metabolism, and Function Following Sleeve Gastrectomy: A Prospective Human Study

Affiliations

Early Changes in Immune Cell Count, Metabolism, and Function Following Sleeve Gastrectomy: A Prospective Human Study

Tammy Lo et al. J Clin Endocrinol Metab. .

Abstract

Objective: To characterize longitudinal changes in blood biomarkers, leukocyte composition, and gene expression following laparoscopic sleeve gastrectomy (LSG).

Background: LSG is an effective treatment for obesity, leading to sustainable weight loss and improvements in obesity-related comorbidities and inflammatory profiles. However, the effects of LSG on immune function and metabolism remain uncertain.

Methods: Prospective data were collected from 23 enrolled human subjects from a single institution. Parameters of weight, comorbidities, and trends in blood biomarkers and leukocyte subsets were observed from preoperative baseline to 1 year postsurgery in 3-month follow-up intervals. RNA sequencing was performed on pairs of whole blood samples from the first 6 subjects of the study (baseline and 3 months postsurgery) to identify genome-wide gene expression changes associated with undergoing LSG.

Results: LSG led to a significant decrease in mean total body weight loss (18.1%) at 3 months and among diabetic subjects a reduction in hemoglobin A1c. Improvements in clinical inflammatory and hormonal biomarkers were demonstrated as early as 3 months after LSG. A reduction in neutrophil-lymphocyte ratio was observed, driven by a reduction in absolute neutrophil counts. Gene set enrichment analyses of differential whole blood gene expression demonstrated that after 3 months LSG induced transcriptomic changes not only in inflammatory cytokine pathways but also in several key metabolic pathways related to energy metabolism.

Conclusions: LSG induces significant changes in the composition and metabolism of immune cells as early as 3 months postoperatively. Further evaluation is required of bariatric surgery's effects on immunometabolism and the consequences for host defense and metabolic disease.

Keywords: bariatric surgery; inflammation; leukocytes; metabolism; sleeve gastrectomy; transcriptomics.


Figures

Figure 1.
Figure 1.
Weight change (A) and percentage total body weight loss (B) for each subject over 12 months following sleeve gastrectomy. Dark blue dots indicate values measured at baseline (preoperatively) and dark red dots indicate values measured during follow-up (postoperatively). Dashed lines between dots indicate missing data for a given subject. Data for each time point are summarized as means and 95% CIs. Significant differences adjusted for multiple testing were marked with the following thresholds: *P < 0.05, **P < 0.01, ***P < 0.001, ****P < 0.0001. Abbreviations: T0, baseline; T3, 3 months postoperatively; T6, 6 months postoperatively; T9, 9 months postoperatively; T12, 12 months postoperatively.
Figure 2.
Figure 2.
Changes in key serum clinical inflammatory markers and leukocytes composition: white blood cells (A), C reactive protein (B), interleukin-6 (C), neutrophil counts (D), lymphocyte counts (E), and neutrophil to lymphocyte ratio (F) from baseline to 12 months after undergoing sleeve gastrectomy. Dark blue dots indicate values measured at baseline (preoperatively) and dark red dots indicate values measured during follow-up (postoperatively). Dashed lines between dots indicate missing data for a given subject. Data for each time point are summarized as means and 95% CIs. Significant differences adjusted for multiple testing were marked with the following thresholds: *P < 0.05, **P < 0.01, ***P < 0.001, ****P < 0.0001. Abbreviations: T0, baseline; T3, 3 months postoperatively; T6, 6 months postoperatively; T9, 9 months postoperatively; T12, 12 months postoperatively.
Figure 3.
Figure 3.
Changes in serum levels of leptin (A) and ghrelin (B) from baseline to 12 months after undergoing sleeve gastrectomy. Blue bars indicate values at baseline (preoperatively). Dark blue dots indicate values measured at baseline (preoperatively) and dark red dots indicate values measured during follow-up (postoperatively). Dashed lines between dots indicate missing data for a given subject. Data for each time point are summarized as means and 95% CIs. Significant differences adjusted for multiple testing were marked with the following thresholds: *P < 0.05,**P < 0.01, ***P < 0.001, ****P < 0.0001. Abbreviations: T0, baseline; T3, 3 months postoperatively; T6, 6 months postoperatively; T9, 9 months postoperatively; T12, 12 months postoperatively.
Figure 4.
Figure 4.
Differential expression of 36 593 gene transcripts in whole blood from 6 subjects at 3 months following sleeve gastrectomy. The dashed horizontal line corresponds to a false discovery rate (FDR) of 5% (corresponding to nominal P = 0.0093). The dashed vertical line corresponds to a log2 fold-change (FC) = 1.0. Transcripts showing significant and substantive differential expression (FDR < 5%, log2 FC > 1.0) are plotted in red. All other transcripts not meeting these 2 criteria are plotted in light gray.
Figure 5.
Figure 5.
Heatmap of 112 individual transcript counts from strongest differential expression results in whole blood from 6 subjects at 3 months following sleeve gastrectomy (T3). Transcripts showing significant and substantive differential expression (false-discovery rate < 5%, log2 fold-change > 1.635) were chosen for display. All expression values are centered on the mean values across all 6 baseline (T0) samples. Red coloring in the heatmap indicates increased expression compared to the baseline mean (beige) across all subjects and blue indicates decreased expression. Samples (columns) are also annotated according to their time point: T0 (dark blue) and T3 (dark red).
Figure 6.
Figure 6.
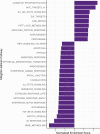
A set of 28 hallmark gene sets significantly enriched for differential expression in whole blood from 6 subjects at 3 months following sleeve gastrectomy at a false discovery rate < 5%. Negative normalized enrichment scores indicate decreased expression of genes in the set following surgery, and positive score indicate increased expression. Abbreviation: MSigDB, Molecular Signatures Database.

Update of

References

    1. Xu H, Barnes GT, Yang Q, et al. Chronic inflammation in fat plays a crucial role in the development of obesity-related insulin resistance. J Clin Invest. 2003;112(12):1821-1830. - PMC - PubMed
    1. Hotamisligil GS, Shargill NS, Spiegelman BM. Adipose expression of tumor necrosis factor-alpha: direct role in obesity-linked insulin resistance. Science. 1993;259(5091):87-91. - PubMed
    1. Hotamisligil GS. Inflammation, metaflammation and immunometabolic disorders. Nature. 2017;542(7640):177-185. - PubMed
    1. Weisberg SP, McCann D, Desai M, Rosenbaum M, Leibel RL, Ferrante AW Jr. Obesity is associated with macrophage accumulation in adipose tissue. J Clin Invest. 2003;112(12):1796-1808. - PMC - PubMed
    1. Tse L. Chronic inflammation in fat plays a crucial role in development of obesity. Screen 2003;112(12):1821-1830. - PMC - PubMed

Publication types

MeSH terms