

Porin threading drives receptor disengagement and establishes active colicin transport through Escherichia coli OmpF
- PMID: 34515361
- PMCID: PMC8561637
- DOI: 10.15252/embj.2021108610
Porin threading drives receptor disengagement and establishes active colicin transport through Escherichia coli OmpF
Abstract
Bacteria deploy weapons to kill their neighbours during competition for resources and to aid survival within microbiomes. Colicins were the first such antibacterial system identified, yet how these bacteriocins cross the outer membrane (OM) of Escherichia coli is unknown. Here, by solving the structures of translocation intermediates via cryo-EM and by imaging toxin import, we uncover the mechanism by which the Tol-dependent nuclease colicin E9 (ColE9) crosses the bacterial OM. We show that threading of ColE9's disordered N-terminal domain through two pores of the trimeric porin OmpF causes the colicin to disengage from its primary receptor, BtuB, and reorganises the translocon either side of the membrane. Subsequent import of ColE9 through the lumen of a single OmpF subunit is driven by the proton-motive force, which is delivered by the TolQ-TolR-TolA-TolB assembly. Our study answers longstanding questions, such as why OmpF is a better translocator than OmpC, and reconciles the mechanisms by which both Tol- and Ton-dependent bacteriocins cross the bacterial outer membrane.
Keywords: Gram-negative bacteria; bacteriocins; cryo-electron microscopy; fluorescent microscopy; outer membrane.
© 2021 The Authors. Published under the terms of the CC BY 4.0 license.
Conflict of interest statement
The authors declare that they have no conflict of interest.
Figures
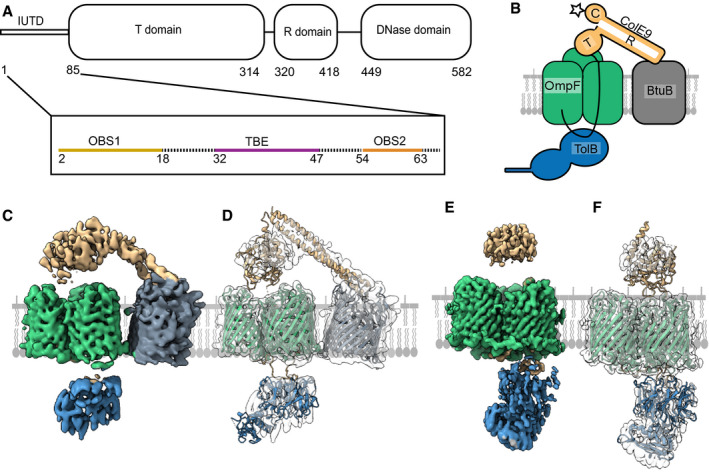
Schematic of the ColE9 sequence showing its constituent domains: an intrinsically unstructured translocation domain (IUTD) at the N‐terminus is followed by three structured domains involved in translocation (T), receptor (R) binding and cytotoxicity (C). The IUTD houses three linear protein‐protein interaction epitopes, two OmpF‐binding sites (OBS1, OBS2) flank a TolB‐binding epitope (TBE). Residue numbers denote position in ColE9 sequence.
Cartoon of the ColE9 OM translocon. ColE9 (orange) exploits the vitamin B12 transporter BtuB (grey) as its extracellular receptor and the porin OmpF (green) for threading its N‐terminal IUTD (solid black line) through to the periplasm where it captures TolB (blue). Star represents the primary site on the ColE9 DNase domain (K469C) where fluorophores were covalently attached throughout this study.
Cryo‐EM map of the fully assembled ColE9 translocon, with local resolution range 4.5–16 Å. Component proteins are coloured as in panel B. The structure shows extracellular ColE9 creating a protein bridge between the two OMPs, BtuB and OmpF. The β‐barrel of BtuB is tilted 35° relative to that of OmpF. TolB is located on the periplasmic side of OmpF, with no associations to BtuB. ColE9 and TolB regions of the map have weaker density than those of the β‐barrels.
Model of the intact ColE9 translocon generated after docking and rigid‐body refinement of individual structures of ColE9 residues 85–580 (PDB ID 5EW5), OmpF (3K19), BtuB (PDB ID 2YSU) and TolB (PBD ID 4JML).
Cryo‐EM map of the partial ColE9 translocon with an average resolution of 3.7 Å, which has density consistent with OmpF, TolB, and ColE9 residues 3–314. Map is coloured based on component parts shown in panel B. TolB is much better resolved here than in the full translocon map in panel C, although ColE9 density is weaker. ColE9 and TolB density align on the extracellular and periplasmic side of OmpF, respectively.
The refined structure of the partial translocon, generated by docking and refinement of ColE9 residues 85–580 (PDB ID 5EW5), OmpF (PDB ID 3K19) and TolB‐ColE9 TBE (PDB ID 4JML). ColE9 residues 3–67 were built de novo.
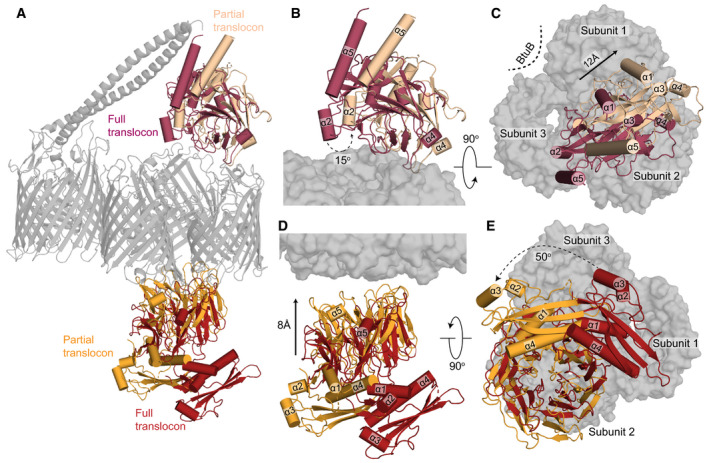
Superposition of the complete and partial ColE9 translocon structures (grey) aligned on OmpF. TolB in red and orange denote the full and partial translocons, respectively, ColE9 T‐domain is presented in crimson and pale orange for the full and partial translocons, respectively.
Side view comparison showing the relative positions of the ColE9 T‐domain (residues 85–316) in the two structures and highlighting the 15° rotation that occurs transitioning from the full (crimson) to the partial (pale orange) translocon.
Extracellular view of the ColE9 T‐domain position, with the OmpF trimer shown in the background. The loss of BtuB from the translocon complex elicits a 12 Å movement along the axis of rotation (black arrow) that results in repositioning of the T‐domain from a central location (crimson) to above subunit two of OmpF (pale orange).
TolB undergoes both rotation and translation when transitioning from the full (red) to the partial translocon (orange). The C‐terminal β‐propeller domain of TolB, which binds the ColE9 TBE, moves towards OmpF in the OM by ˜8 Å along the rotation axis.
View along the rotation axis from the periplasmic side of OmpF (grey surface) highlighting the 50° rotation that TolB undergoes upon loss of BtuB from the translocon complex.
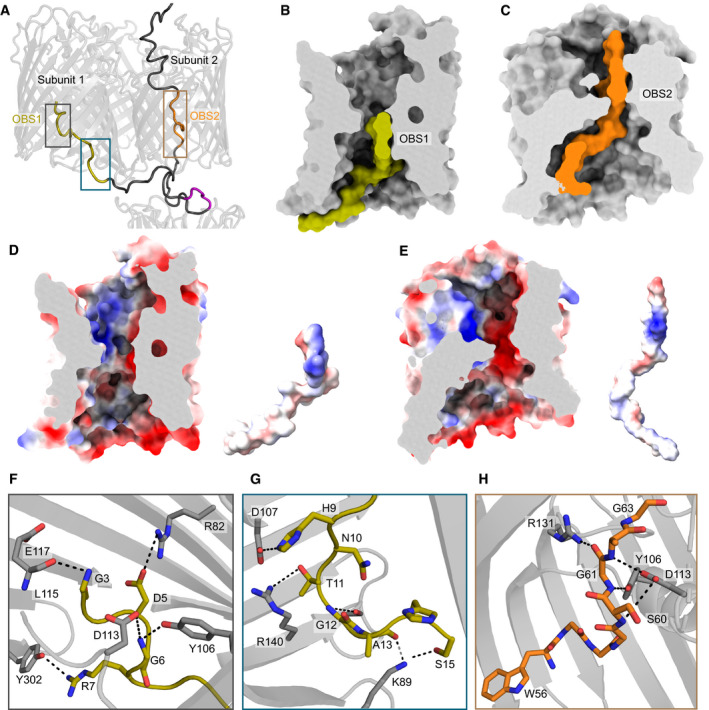
ColE9 residues 3–67 of the IUTD in the partial translocon structure pass through OmpF subunit 2 and then back up into subunit 1. As a result, OBS1 (gold) docks within subunit 1 and OBS2 (orange) within subunit 2. The ColE9 TBE motif (pink) interacts with TolB and is positioned below subunit 2, above which the ColE9 T‐domain is located.
Surface representation of OmpF subunit 1 (grey) and ColE9 residues 3–24 (gold) containing OBS1 sequence. ColE9 OBS1 binds the inner vestibule of OmpF subunit 1 such that it runs along the edge of the vestibule, stopping at the eyelet.
ColE9 residues 45–67 (orange) encompassing OBS2 traverse the pore of OmpF subunit 2 (grey). After passing through the eyelet, OBS2 tracks more centrally in the inner vestibule unlike in panel C where residues 3–24 trail the side of the pore.
OmpF subunit 1 displayed as an electrostatic surface (same cut‐through as in B), revealing a patch of negative charge located on the extracellular side of the eyelet that interacts with OBS1, also shown as an electrostatic surface adjacent to the subunit.
OmpF subunit 2 displayed as an electrostatic surface (same cut‐through as in C), with OBS2 also shown as an electrostatic surface adjacent to the subunit. Projecting out of the page for OBS2 is a positively charged region flanked by negative charges.
A zoom‐in of grey box in panel A highlighting hydrogen bonding network between residues 3–7 of OBS1 (gold sticks) and nearby residues within OmpF subunit 1 (grey sticks).
OBS1 residues 11–17 (gold sticks) also interact with the base of OmpF subunit 1 (grey sticks) in the periplasm. Region is a zoom‐in of blue box in panel A.
OmpF subunit 2 residues (grey sticks) form a hydrogen bond network with the backbone of residues of ColE9 OBS2. Region is a zoom‐in of brown box in panel A. All electrostatic surfaces shown in panels D and E were calculated using the APBS plugin within Pymol.
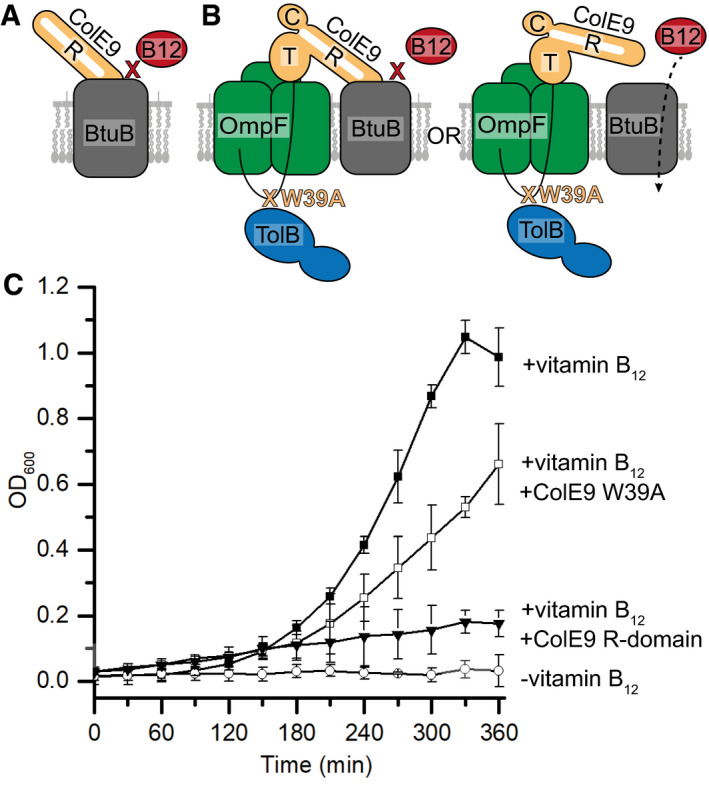
Cartoon depicting the basis for the control where excess ColE9 R‐domain (residues 348–418, orange) blocks binding of vitamin B12 (red) to BtuB (grey), impairing growth of E. coli 113/3, a B12‐dependent strain (Penfold et al, 2000).
Cartoon schematic of the two possible translocon outcomes for binding of ColE9 W39A to BtuB and their implications on vitamin B12 import in E. coli 113/3. The W39A mutation within the TBE of ColE9 (orange) impairs TolB (blue) binding thereby uncoupling the OM components of the translocon from the energised TolQ‐TolR‐TolA complex in the inner membrane. If threading of the ColE9 IUTD through OmpF (green) has no impact on ColE9 binding to BtuB (grey) then vitamin B12 (red) cannot enter cells to support growth. In contrast, if OmpF threading disengages ColE9 from BtuB then vitamin B12 can enter cells to support growth.
Growth curves for E. coli 113/3 in defined media and in the presence or absence of B12 (■ and ○, respectively). When challenged with 40 nM isolated R‐domain (▾), cell growth was largely impaired whereas growth in the presence of 40 nM ColE9 W39A (□) approached that of the no‐colicin control, consistent with OmpF threading causing the disengagement of ColE9 from BtuB. Error bars represent the standard deviation across three biological replicates.
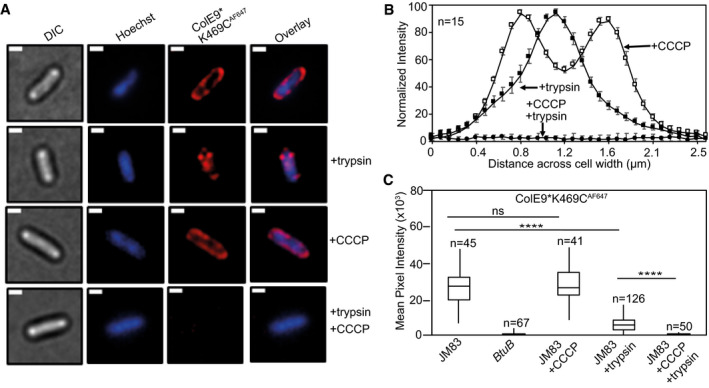
Widefield fluorescence microscopy images of E. coli JM83 cells labelled with ColE9* K469CAF647 (1.5 µM) and Hoechst DNA stain (20 µM) for 30 min at 37°C with or without trypsin treatment with or without prior treatment with CCCP. Each panel shows the same cell in DIC (grey), Hoechst DNA stain (blue) and ColE9* K469CAF647 fluorescence (red). Overlays of Hoechst and ColE9* K469CAF647 fluorescence are also shown. ColE9* K469CAF647 remains bound to the OM in the presence of CCCP but this signal is lost on treatment with trypsin. Trypsin treatment in the absence of CCCP yields some cell‐associated ColE9* K469CAF647 fluorescence that likely represents internalised molecules (see text). Scale bar, 1 µm.
Normalised fluorescence intensity profiles across E. coli JM83 cell widths for CCCP and/or trypsin treated cells. Fluorescence was measured in ImageJ for 15 cells per condition and normalised to more clearly show distribution profiles for each condition. CCCP‐treated cells showed peripheral ColE9* K469CAF647 fluorescence consistent with the colicin being bound at the OM. Trypsin treatment of cells in the absence of CCCP results in loss of this peripheral fluorescence but the presence of mid‐cell signal consistent with internalisation. Treatment with CCCP and trypsin removed all ColE9* K469CAF647 fluorescence from cells, as in A. Error bars represent % SEM.
Box and whisker plots showing mean pixel intensities for ColE9* K469CAF647 fluorescence per cell measured for the indicated cells and condition used, whiskers represent minimum and maximum mean pixel intensity, box shows 1st and 3rd quartile with the median shown as a line. From left to right: E. coli JM83 cells; E. coli btuB deletion strain showing loss of all ColE9* K469CAF647 cell‐associated fluorescence; E. coli JM83 cells in the presence of CCCP; E. coli JM83 cells following trypsin treatment showing significant ColE9* K469CAF647 fluorescence remains associated with cells indicative of import; E. coli JM83 cells treated with CCCP and trypsin showing the complete loss of internalised ColE9* K469CAF647 fluorescence. n, number of cells used, typically from 2 to 4 biological replicates. **** indicates a t value < 0.05 in a Student’s t‐test as a statistically significant result, ns indicates no significant difference as determined by Student’s t‐test.
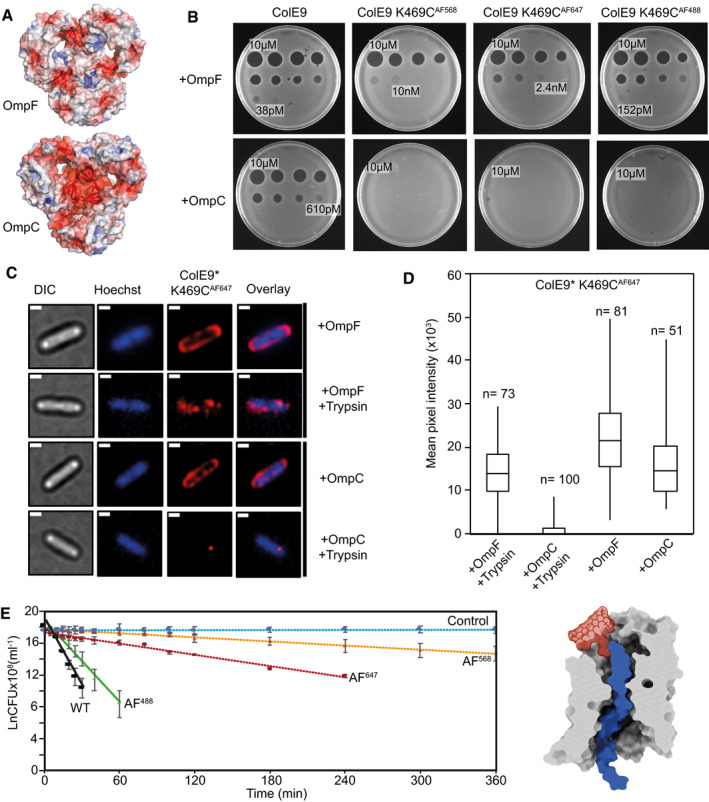
Cut‐through molecular surface images showing the distribution of charged residues (acidic, red; basic, blue) at the eyelets of trimeric OmpF (PDB ID 3K19) and OmpC (PDB ID 2J1N). The eyelet of OmpC is significantly more electronegative than that of OmpF. Electrostatic surfaces were calculated using the APBS plugin within Pymol.
Overnight plate assays comparing the cytotoxic activity of wild‐type ColE9 with ColE9 K469C labelled with AF488, AF568 or AF647 against a lawn of E. coli with either OmpF (JW2203) or OmpC (JW0912) in the outer membrane (shown as +OmpF and +OmpC, respectively). Each plate was spotted with a serial dilution of the colicin (10 µM–2.4 pM, 4‐fold dilution per spot). Wild‐type ColE9 was more active against E. coli cells with OmpF in the outer membrane than OmpC. Labelling ColE9 K469C with fluorophores reduced colicin activity in cells with OmpF in the outer membrane but largely abolished colicin activity in cells with OmpC.
Widefield fluorescence microscopy images of E. coli JW2203 (+OmpF) and JW0912 (+OmpC) cells labelled with ColE9* K469CAF647 (1.5 µM) and Hoechst stain (20 µM) for 30 min at 37°C with or without trypsin treatment. Each panel shows the same cell in DIC (grey), Hoechst DNA stain (blue) and fluorescence of ColE9* K469CAF647 (red). Overlays of Hoechst and ColE9* K469CAF647 fluorescence are also shown. Data show that following trypsin treatment, significant ColE9* K469CAF647 fluorescence remains associated with ompF‐expressing E. coli, whereas little or no fluorescence remains associated with ompC‐expressing E. coli. Scale bar, 1 µm.
Box and whisker plots of E. coli JW2203 and E. coli JW0912 cells labelled with ColE9* K469CAF647 with and without trypsin treatment: whiskers represent minimum and maximum mean pixel intensity, box shows 1st and 3rd quartile with the median shown as a line. Microscopy data were collected as in C. The mean pixel intensity of ColE9* K469CAF647 per cell was measured for each cell condition. n, number of cells, typically from 3 or 4 biological replicates. Data show that ColE9* K469CAF647 translocates across the OM through OmpF and that this is impeded when E. coli has OmpC in the outer membrane.
First‐order cell death kinetics for wild‐type ColE9 or ColE9 K469C labelled with different AF dyes (AF488, AF568, AF647) against E. coli JW2203 with OmpF in the outer membrane. Cultures were incubated with 80 nM toxin at pH 7.5 and 37°C and at various time points the reaction stopped using trypsin at 37°C for 30 min, cells plated out and CFUs recorded. All time courses were conducted in the presence of chloramphenicol (20 µg/ml) to reversibly block cell division, which would otherwise compete with cell killing. Control data shown are for cells with no ColE9 added but where growth was inhibited by the presence of chloramphenicol. Cell‐killing half‐lives, obtained from the fitted first‐order plots shown (error bars represent the standard deviation across two biological replicates), were as follows: wild‐type ColE9, 2.5 min; ColE9 K469CAF488, 4.1 min; ColE9 K469CAF647, 29.6 min; ColE9 K469CAF568, 78.8 min. The data show that the chemical nature of the fluorophore in the C‐terminal DNase domain of ColE9 has a dramatic effect on the cell‐killing kinetics of the colicin. The schematic shown alongside the kinetic data is a surface representation of AF568 (model Generated in coot), the fluorophore with the biggest impact on OmpF‐mediated killing, manually grafted onto the structure of ColE9 OBS2 bound within subunit 2 of OmpF. The slow cell death kinetics of ColE9 K469CAF568 likely reflects the time taken to pass this bulky molecule through the narrow eyelet of the porin.
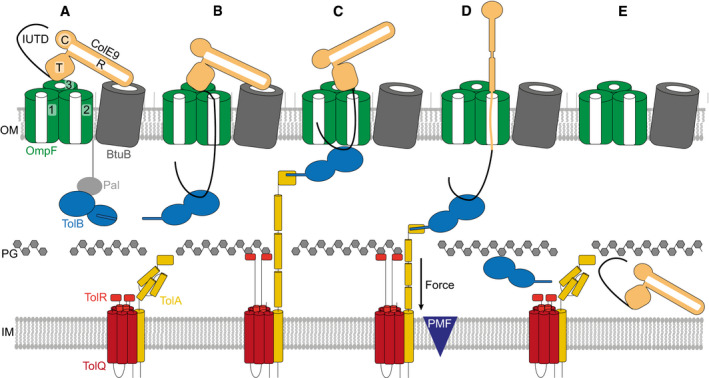
ColE9 R‐domain binds BtuB with nM affinity, positioning the T‐domain and IUTD above a neighbouring OmpF trimer.
The ColE9 IUTD translocates through subunit 2 of OmpF to deposit the TBE in the periplasm and capture TolB at the expense of the OM lipoprotein Pal. The TBE allosterically promotes displacement of TolB’s N‐terminus which constitutes the TolA binding site. We propose this complex equates to the full translocon cryo‐EM structure.
ColE9 OBS1 binds subunit 1 of OmpF from the periplasm. Threading through two of OmpFs three subunits triggers dissociation of the ColE9 R‐domain‐BtuB complex and reorients the T‐domain above subunit 2 below which TolB is positioned in the periplasm. The docking of OBS1 also results in TolB moving closer to the opening of subunit 2. This complex, which we propose equates to the partial translocon cryo‐EM structure, is now primed for contact with TolA in the inner membrane. TolA extension through the periplasm is coupled to the PMF via its stator proteins, TolQ and TolR.
Retraction of TolA (the molecular mechanism of which remains to be established) provides the driving force for pulling ColE9 bound to TolB into the periplasm through subunit 2 of OmpF, accompanied by unfolding of its constituent domains. It is at this point the immunity protein Im9 (not shown) would be displaced at the cell surface.
The TolA‐TolB complex is thought to retract through the cell wall, which would bring ColE9 close to the cytoplasmic membrane. The toxin likely refolds prior to transport across the cytoplasmic membrane, which involves the AAA+ATPase/protease FtsH (not shown) (Walker et al, 2007).
References
-
- Basle A, Rummel G, Storici P, Rosenbusch JP, Schirmer T (2006) Crystal structure of osmoporin OmpC from E. coli at 2.0 A. J Mol Biol 362: 933–942 - PubMed
Publication types
MeSH terms
Substances
Associated data
- Actions
- Actions
Grants and funding
LinkOut - more resources
Full Text Sources
Other Literature Sources
Molecular Biology Databases
