

Hepsin regulates TGFβ signaling via fibronectin proteolysis
- PMID: 34515392
- PMCID: PMC8567232
- DOI: 10.15252/embr.202152532
Hepsin regulates TGFβ signaling via fibronectin proteolysis
Abstract
Transforming growth factor-beta (TGFβ) is a multifunctional cytokine with a well-established role in mammary gland development and both oncogenic and tumor-suppressive functions. The extracellular matrix (ECM) indirectly regulates TGFβ activity by acting as a storage compartment of latent-TGFβ, but how TGFβ is released from the ECM via proteolytic mechanisms remains largely unknown. In this study, we demonstrate that hepsin, a type II transmembrane protease overexpressed in 70% of breast tumors, promotes canonical TGFβ signaling through the release of latent-TGFβ from the ECM storage compartment. Mammary glands in hepsin CRISPR knockout mice showed reduced TGFβ signaling and increased epithelial branching, accompanied by increased levels of fibronectin and latent-TGFβ1, while overexpression of hepsin in mammary tumors increased TGFβ signaling. Cell-free and cell-based experiments showed that hepsin is capable of direct proteolytic cleavage of fibronectin but not latent-TGFβ and, importantly, that the ability of hepsin to activate TGFβ signaling is dependent on fibronectin. Altogether, this study demonstrates a role for hepsin as a regulator of the TGFβ pathway in the mammary gland via a novel mechanism involving proteolytic downmodulation of fibronectin.
Keywords: TGFβ; breast cancer; fibronectin; hepsin; tumor microenvironment.
© 2021 The Authors. Published under the terms of the CC BY NC ND 4.0 license.
Conflict of interest statement
Dr. Klefström’s research projects received funding from AbbVie, Orion Pharma, and Roche/Genentech. Dr. Klefström has served as a member of scientific advisory board or consultant to AbbVie, Astra‐Zeneca, MSD, Orion Pharma, Pfizer, Roche/Genentech, and UPM Biomedicals. Dr. Pouwels has consulted for Biomedicum Genomics. Other authors declare no conflicts of interest.
Figures
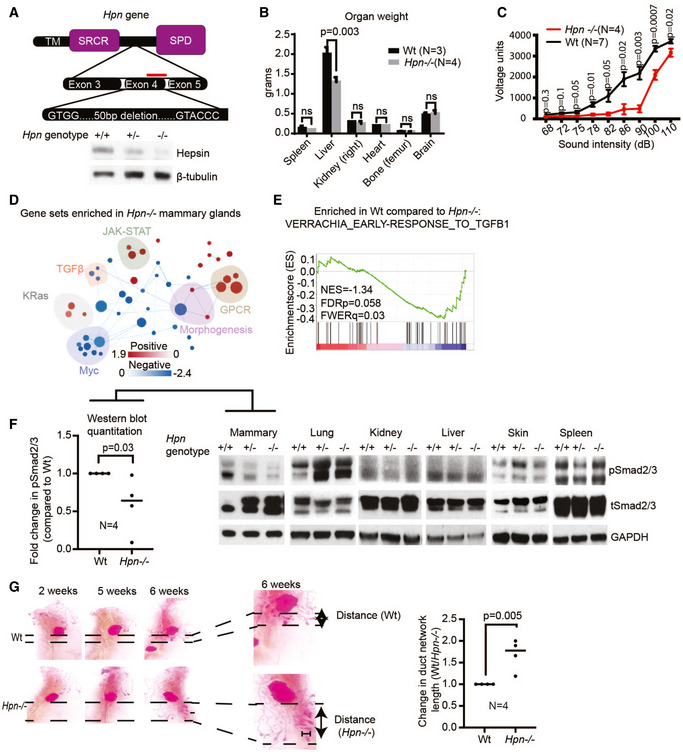
Hepsin knockout mice harbor a 50 bp frameshift deletion in the 4th exon of the Hpn gene (TM = transmembrane domain, SRCR = scavenger receptor cysteine‐rich domain, SPD = serine protease domain; red bar indicates gRNA‐binding site). Immunoblot from whole mammary lysates against hepsin protein (Hpn +/+ = Wt, Hpn +/− = heterozygous deletion, Hpn −/− = homozygous deletion) (representative of 3 mice per group).
Weight of indicated organs isolated from Wt (N = 3) and Hpn −/− (N = 4) mice.
Acoustic startle reflex test to compare hearing ability between Wt (N = 7) and Hpn −/− (N = 4) mice.
Cytoscape enrichment map of pathways affected in Hpn −/− whole mammary glands compared with Wt controls (N = 3 per group). Node size correlates with the number of genes in the signature; node color correlates with either gene set enrichment (red) or reduction (blue) in Hpn −/− mammary glands. A full list of gene signatures affected in Hpn −/− mammary glands is shown in Table EV1.
Gene Set Enrichment Analysis (GSEA) graphs showing enrichment of indicated TGFβ1 signaling gene sets in Hpn −/− mammary glands compared with Wt mammary glands (FDRp—P‐value; FWERq—false discovery rate; NES—normalized enrichment score).
Immunoblot analysis of phospho‐Smad2/3 (TGFβ pathway signaling marker) and total Smad2/3 in lysates from indicated tissues isolated from Wt, Hpn +/−, and Hpn −/− mice. GAPDH was used as the loading control. The histogram depicts quantification of pSmad2/3 compared to Wt, normalized to total Smad2/3.
Representative Carmine alum stained mammary gland whole mounts from Wt and Hpn −/− mice. The histogram depicts quantification of duct length normalized to duct length in Wt mammary glands. The scale bar represents 1 mm. Data in (B, C, F, G) are represented as mean ± SD, and Student’s t‐test was used for statistical analyses.

Immunoblot analysis of hepsin in Wt and Hpn −/− tissues.
Photographs of representative 6‐week‐old Wt and Hpn −/− mice. Scale bar is equal to 3 cm.
Graph showing body composition and body weight analysis of 6‐week‐male and female Wt and Hpn −/− mice using the Bruker minispec LF50 NMR Body Composition Analyzer (N = 5 mice each).
Representative H&E stainings of paraffin tissue sections from the mammary gland, lung, skin, kidney, spleen, and liver from female Wt and Hpn −/− mice (6‐week‐old littermates). Scale bar equals to 100 μm.
Liver mass (% of whole‐body weight) in 6‐week‐old virgin female Wt (N = 3) and Hpn −/− (N = 4) mice. Data in (C, E) are represented as mean ± SD, and Student’s t‐test was used for statistical analyses (n.s. = not significant).

Proteome profiling of whole mammary tissue lysates prepared from 6‐week‐old virgin female Wt and Hpn −/− littermates. Small rectangles indicate proteins with differential expression (see (B)).
Graph showing quantification of signal intensity from proteome profiling depicted in (A). Proteins were considered differently expressed starting from a 20% change in expression (indicated with red x‐axis labels).
Quantification of mRNA levels (read counts) corresponding to proteins quantified in the RPPA (A–B), normalized to the housekeeping gene Pum1 mRNA levels. Data were derived from bulk RNA sequencing data from whole mammary tissue lysates prepared from 6‐week‐old virgin female Wt and Hpn −/− mice (see Fig 1D and E). Data are presented as mean ± SD, and Student’s t‐test was used for statistical analyses (n.s. = not significant, N = 3 indicates the number of biological replicates).
Venn diagram showing differential expression of mRNAs (bulk RNA seq; Fig EV2C and D) and proteins (RPPA; Fig EV2A and B) in mammary tissue of 6‐week‐old virgin female Wt and Hpn −/− littermates. Resistin and IGFBP‐5 are differentially expressed both on mRNA and protein levels.

Schematic representation of the mouse experiment.
Immunoblot analysis of Wap‐Myc mammary tumor lysates for the indicated TGFβ signaling markers and hepsin (T# denotes individual tumors). GAPDH was used as the loading control. Lysates were derived from Wap‐Myc mammary tumors from six mice with and six mice without DOX‐induced hepsin overexpression (see (A)).
Gene Set Enrichment Analysis (GSEA) enrichment map of pathways upregulated in hepsin overexpressing Wap‐Myc tumors (DOX+) compared with control tumors (DOX−) (N = 5 tumors in each group). Node size correlates with the number of genes in the signature; node color red correlates with enrichment in hepsin overexpressing Wap‐Myc tumors.
GSEA graph comparing the expression of the HALLMARK_TGF_BETA_SIGNALING gene set in hepsin overexpressing (DOX+) to control (DOX−) Wap‐Myc tumors (N = 5 tumors per group; FDRp—P‐value; FWERq—false discovery rate; NES—normalized enrichment score).
Heatmap showing changes in expression of all genes in the HALLMARK_TGF_BETA_SIGNALING gene set in hepsin overexpressing (DOX+) compared with control (DOX−) Wap‐Myc tumors. Red color indicates upregulation, and blue color indicates the downregulation of the indicated genes.
- A, B
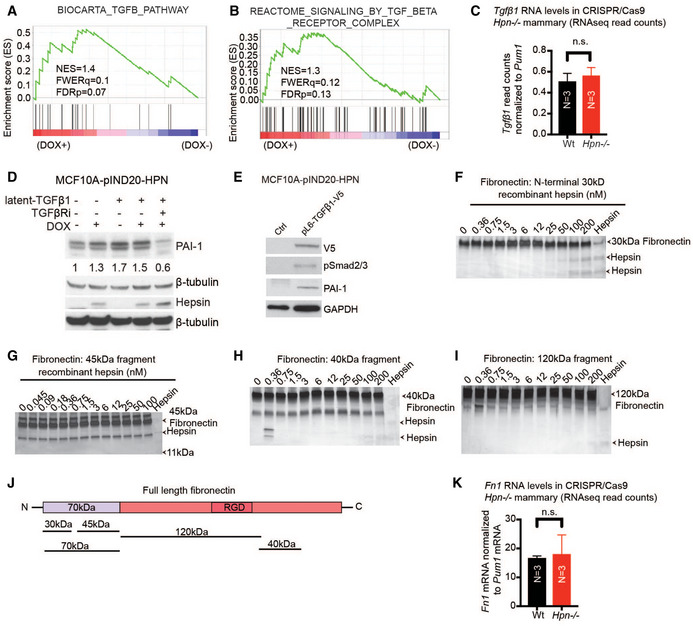
GSEA enrichment maps from tumors overexpressing hepsin (DOX+) and control tumors (DOX−).
- C
Graph depicting quantification of Tgfβ1 mRNA levels (mean ± SD mRNA read counts), normalized to the housekeeping gene Pum1, in mammary tissue of 6‐week‐old virgin female Wt and Hpn −/− mice. Student’s t‐test was used for statistical analyses (n.s. = not significant, N = 3 indicates the number of biological replicates).
- D
Immunoblot analysis of PAI‐1, hepsin, and β‐tubulin (loading control) in MCF10A‐pIND20‐HPN cells treated with doxycycline, galunisertib, and latent‐TGFβ (small latent complex) as indicated. Numbers below the PAI‐1 blot indicate PAI‐1 levels, normalized to β‐tubulin.
- E
Immunoblot analysis of TGFβ‐V5 (antibody detecting V5), pSmad2/3, PAI‐1, and GAPDH (loading control) in cell lysates from MCF10A‐pIND20‐HPN cells with or without TGFβ‐V5 overexpression.
- F–I
Silver‐stained protein gels with samples from in vitro protease activity assays with recombinant hepsin and fragments of fibronectin. The respective fragments (30 kDa (F), 45 kDa (G), 40 kDa (H), and 120 kDa (I); marked by arrowheads) were incubated (1 μg/reaction) with increasing concentrations of recombinant hepsin (nM).
- J
Schematic mapping of the fibronectin fragments used in (G–J) onto full‐length fibronectin. RGD indicates the RGD‐binding domain in fibronectin.
- K
Graph depicting quantification of Fn1 mRNA levels (mean ± SD mRNA read counts), normalized to the housekeeping gene Pum1, in mammary tissue of 6‐week‐old virgin female Wt and Hpn −/− mice. Student’s t‐test was used for statistical analyses (n.s. = not significant, N = 3 indicates the number of biological replicates).

Schematic illustration of proteins involved in TGFβ storage in the extracellular matrix. The small latent complex (SLC) is a non‐covalently linked tetramer of 2 LAP (latency‐associated peptide) (40 kDa) and 2 TGFβ1 (12 kDa). LTBP1 + SLC together form the large latent complex (LLC) through covalent bonds between LAP and LTBP1. LLC interacts with the ECM through non‐covalent interactions of LTBP with fibrillins and fibronectin.
Immunoblot analysis of LAP in mammary whole tissue lysates from Wt and Hpn −/− mouse. The 90 kDa band represents unprocessed pro‐TGFβ, and the 40 kDa band corresponds to mature TGFβ LAP peptide.
Schematic representation of the mouse experiment, showing orthotopic transplantation of Wt Wap‐Myc tumor cells into syngeneic Wt and Hpn −/− recipients.
Immunoblot analysis of phospho‐Smad2/3, total Smad2/3, and GAPDH (loading control) expression in Wt tumors transplanted into either Wt or Hpn −/− recipients (N = 10 tumors each).
Western blot analysis of phospho‐Smad2/3, total Smad2/3, hepsin, and β‐tubulin (loading control) in MCF10A‐pIND20‐HPN cells treated with 1 µg/ml doxycycline for 48 hours (DOX; overexpression of hepsin) and the TGFβR1 inhibitor galunisertib (TGFβR1i, 10 µM) as indicated.
Immunoblot analysis of conditioned medium (LAP peptide) and cell extracts (hepsin and vinculin) from control (DOX) or hepsin overexpressing (DOX+) MCF10A‐pIND20‐HPN supplemented with 100 ng/ml latent‐TGFβ (small latent complex). Ponceau was used as a loading control for the cell culture medium.
TGFβ ELISA assay to detect active and total TGFβ levels in conditioned medium from MCF10A‐pIND20‐HPN pL6‐TGFβ1 cells with (DOX+) or without (DOX−) hepsin overexpressing. The TGFβ ELISA assay detects active TGFβ levels (first 2 columns), but heat treatment of the conditioned medium activates all TGFβ, thus effectively measuring total TGFβ (right two columns). Data are presented as scatter plot (mean denoted by the black line), and paired Student’s t‐test was used for statistical analyses.
Silver‐stained protein gel with samples from an in vitro protease activity assay with recombinant SLC and hepsin. SLC was incubated with increasing concentrations of recombinant hepsin (numbers indicate the concentration of hepsin in nM). Western blots in (B, E, F) are representative of at least three repeats.

Coomassie‐stained protein gels with cell lysates and concentrated culture supernatants of MCF10A‐pIND20‐HPN cells, with (DOX+) or without (DOX−) hepsin overexpression. M indicates the media only control. R and NR above the gels indicate reducing and non‐reducing conditions, respectively. Numbered arrowheads indicate areas of the gel that were analyzed by mass spectrometry; corresponding proteins differently expressed in hepsin overexpressing cells are listed on the left. The image with two lanes on the right is a copy of the indicated area with supernatant under reducing conditions, highlighting the part from which fibronectin was identified. Red boxes indicate the lanes that were analyzed by mass spectrometry.
Immunoblot analyses of fibronectin expression in concentrated culture supernatant from MCF10A‐pIND20‐HPN cells with (DOX+) or without (DOX−) hepsin overexpression. Ponceau staining of the Western blot is shown as the loading control.
Immunoblot analysis of fibronectin, hepsin, and β‐tubulin (loading control) in cell lysates from MCF10A‐pIND20‐HPN cells with (DOX+) or without (DOX−) hepsin overexpression. The graph shows the quantification of fibronectin levels. Student’s t‐test was used for statistical analyses. Data are represented as mean ± SD.
Silver‐stained protein gel with samples from an in vitro protease activity assay with recombinant hepsin and either full length purified plasma fibronectin (upper panel) or the 70 kDa most N‐terminal fragment of fibronectin (lower panel). Full‐length fibronectin (1 μg) or the 70 kDa fibronectin fragment (1 μg) was incubated with increasing concentrations of recombinant hepsin. Arrowheads indicate full‐length fibronectin, the 70 kDa fragment, the 50 kDa cleavage fragment generated by hepsin, and hepsin. The schematic figure shows the full‐length fibronectin protein and the 70 KDa N‐terminal fragment. The red arrow indicates the location of the putative hepsin cleavage site. RGD indicates the RGD‐binding domain in fibronectin. Experiments in (B, C, D) are representative of at least three repeats.

Immunoblot analysis of fibronectin in indicated tissues isolated from Wt, Hpn +/− and Hpn −/− mouse (representative of at least three repeats). *As the same tissue lysates were used as in Fig 1F, the same GAPDH blot is used here as the loading control.
Immunoblot analysis of fibronectin and β‐tubulin (loading control) in lysates from Wt and Hpn −/− mouse mammary tissue (N = 5 animals each) from another hepsin knockout mouse model (Wu et al, 1998).
Immunoblot analysis of fibronectin, hepsin, and β‐tubulin (loading control) in prostate lysates of control mice or mice with prostate‐specific hepsin overexpression (Klezovitch et al, 2004). N = 2 mice each, the two prostate lobes were run separately (A and B).
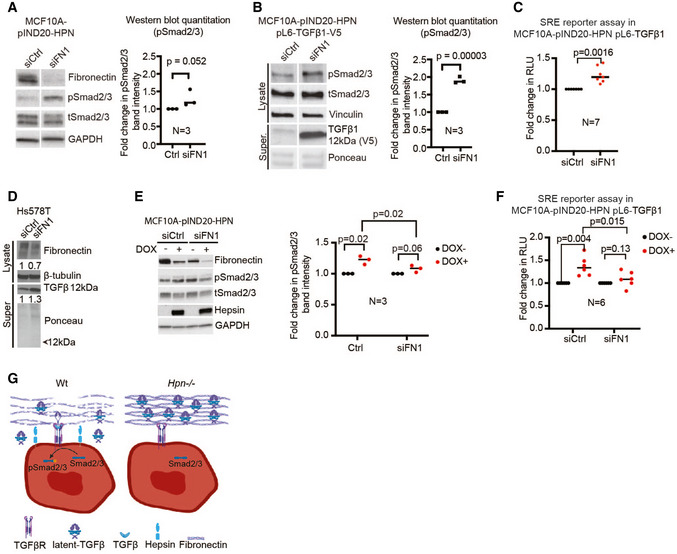
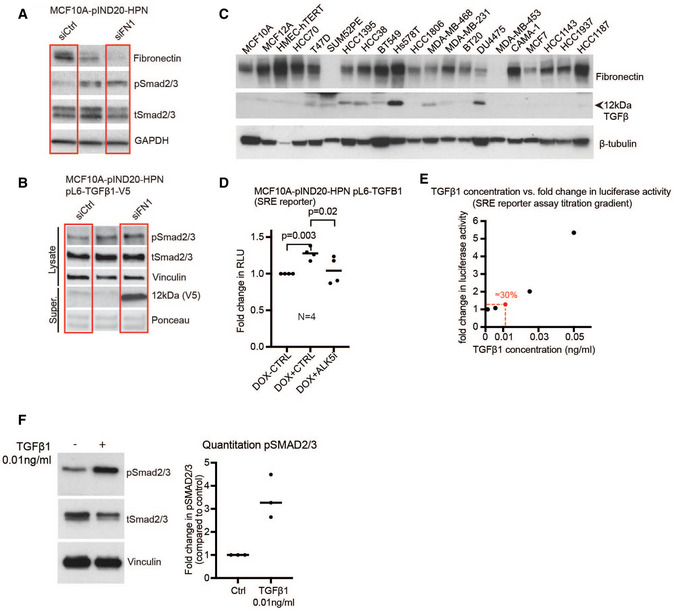
Immunoblot analysis of fibronectin, pSmad2/3, total Smad2/3, and GAPDH (loading control) in cell lysates from MCF10A‐pIND20‐HPN cells without hepsin overexpression. The graph depicts quantification of pSmad2/3 normalized to total Smad2/3 levels, compared to siCtrl (N = 3 biological repeats).
Immunoblot analysis of cell lysates (pSmad2/3, total Smad2/3, and vinculin as loading control) and concentrated cell culture supernatant (anti‐V5 for TGFβ) from MCF10A‐pIND20‐HPN pL6‐TGFβ1‐V5 cells without hepsin overexpression. Ponceau staining is shown as a loading control for the Western blot with concentrated culture supernatant. The graph depicts quantification of pSmad2/3 normalized to total Smad2/3 levels, compared to siCtrl (N = 3 biological repeats).
TGFβ luciferase reporter assay of control or fibronectin silenced MCF10A‐pIND20‐HPN pL6‐TGFβ1 (SRE) TGFβ1 reporter cells with (DOX+) or without (DOX−) hepsin overexpression (N = 7 biological repeats; Y‐axis shows fold change in relative light units (RLU)).
Immunoblot analysis of cell lysates (fibronectin and β‐tubulin (loading control)) and concentrated cell culture supernatant (TGFβ) from Hs578T cells with knockdown of fibronectin. Ponceau staining is shown as the loading control for the Western blot with concentrated culture supernatant. A representative blot from three biological repeats is shown.
Immunoblot analysis of fibronectin, pSmad2/3, total Smad2/3, hepsin, and GAPDH (loading control) in cell lysates from MCF10A‐pIND20‐HPN cells with (DOX+) and without (DOX−) hepsin overexpression, and with or without fibronectin silencing (siFN1). The graph depicts quantification of pSmad2/3 normalized to total Smad2/3 levels (N = 3 biological repeats).
TGFβ luciferase reporter assay of control or fibronectin silenced MCF10A‐pIND20‐HPN pL6‐TGFβ1 (SRE) TGFβ1 reporter cells, with (DOX+) and without (DOX−) hepsin overexpression. (N = 6 biological repeats; Y‐axis shows fold change in relative light units (RLU)).
Model figure depicting how hepsin regulates TGFβ signaling. Under Wt conditions, hepsin promotes degradation of fibronectin, which releases latent‐TGFβ from ECM stores, thus resulting in the induction of TGFβ signaling. In hepsin knockout mammary glands, TGFβ signaling is compromised as latent‐TGFβ cannot be released from ECM stores (Created with BioRender.com). Statistical analyses in (A, B, C, E, F) were done using Student’s t‐test. Data in (A, B, C, E, F) are presented as dot plots where black lines represent the mean.
Uncropped Western blot corresponding to Fig 6A.
Uncropped Western blot corresponding to Fig 6B. Red boxes indicate areas represented in the main Fig 6A and B.
Immunoblot analysis of fibronectin and the 12 kDa form of TGFβ in a panel of normal breast and breast cancer cell lines. β‐Tubulin was used as the loading control.
TGFβ luciferase reporter assay of MCF10A‐pIND20‐HPN pL6‐TGFβ1 reporter cells harboring a Smad‐response element (SRE), with (DOX+) and without (DOX−) hepsin overexpression, and with or without galunisertib (TGFβR/ALK5 inhibitor). (N = 4 biological repeats; Y‐axis shows fold change in relative light units (RLU)). The black line denotes the average. Paired Student’s t‐test was used for statistical analyses.
Titration of the TGFβ1 concentration in a luciferase assay with the MCF10A‐pIND20‐HPN pL6‐TGFβ1 (SRE) reporter cell line. Figure shows one biological repeat as a representative of three biological repeats; Y‐axis shows fold change in relative light units (RLU).
Immunoblot for pSmad2/3, total Smad2/3, and vinculin as loading control from 0.01 ng/ml TGFβ1 and control treated MCF10A‐pIND20‐HPN pL6‐TGFβ1 reporter cells. The graph depicts quantification of pSmad2/3 normalized to total Smad2/3 levels (N = 3 biological repeats)
References
-
- Andreasen PA, Kjøller L, Christensen L, Duffy MJ (1997) The urokinase‐type plasminogen activator system in cancer metastasis: a review. Int J cancer 72: 1–22 - PubMed
-
- Borgoño CA, Michael IP, Shaw JLV, Luo L‐Y, Ghosh MC, Soosaipillai A, Grass L, Katsaros D, Diamandis EP (2007) Expression and functional characterization of the cancer‐related serine protease, human tissue kallikrein 14. J Biol Chem 282: 2405–2422 - PubMed
Publication types
MeSH terms
Substances
LinkOut - more resources
Full Text Sources
Molecular Biology Databases
