. 2021 Sep 1;21(10):10.
doi: 10.1167/jov.21.10.10.

Dissecting (un)crowding

Affiliations

Dissecting (un)crowding

Oh-Hyeon Choung et al. J Vis. .

Abstract

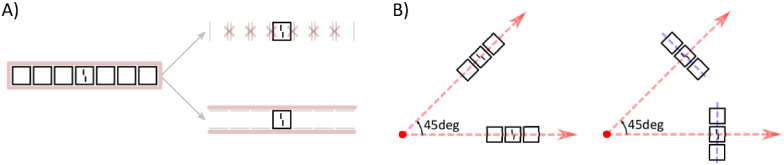
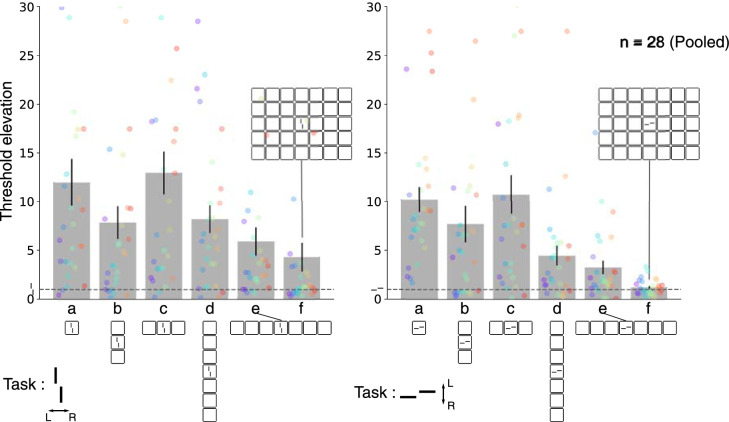
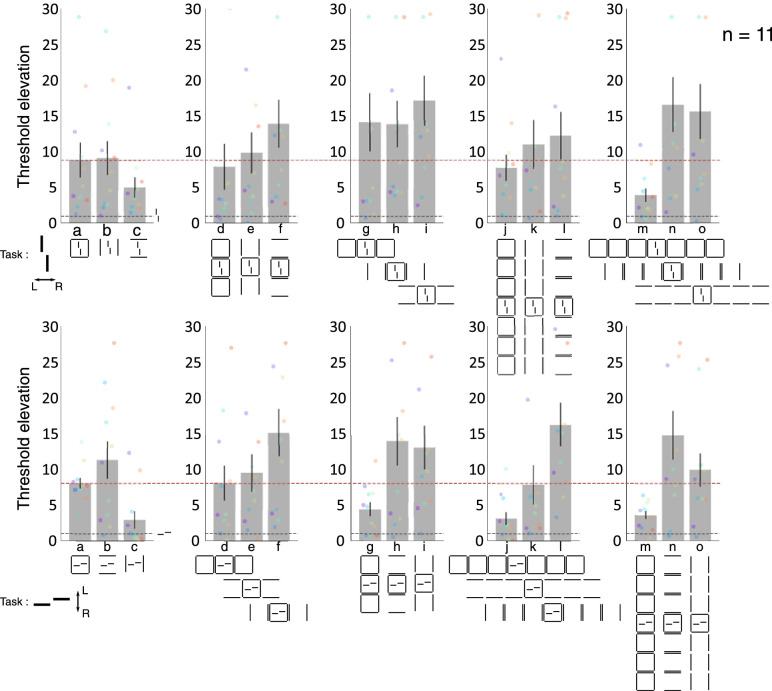
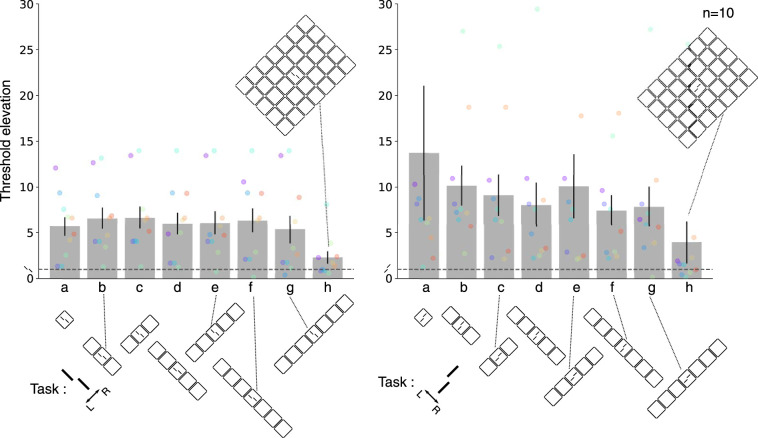
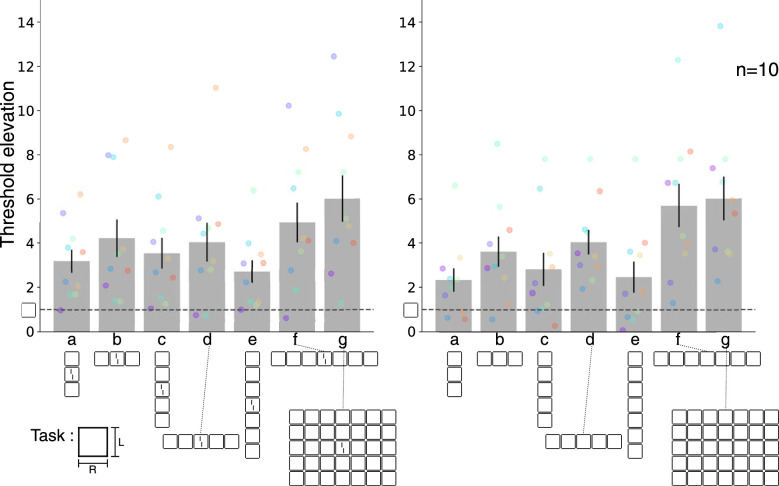
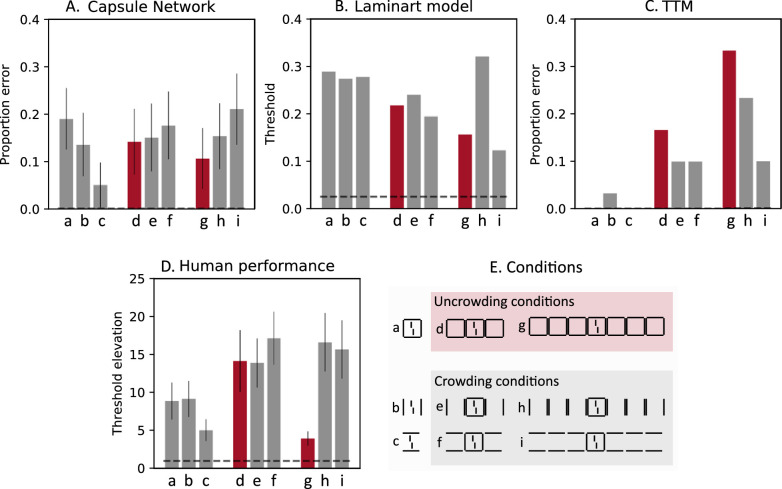
In crowding, perception of a target deteriorates in the presence of nearby flankers. Surprisingly, perception can be rescued from crowding if additional flankers are added (uncrowding). Uncrowding is a major challenge for all classic models of crowding and vision in general, because the global configuration of the entire stimulus is crucial. However, it is unclear which characteristics of the configuration impact (un)crowding. Here, we systematically dissected flanker configurations and showed that (un)crowding cannot be easily explained by the effects of the sub-parts or low-level features of the stimulus configuration. Our modeling results suggest that (un)crowding requires global processing. These results are well in line with previous studies showing the importance of global aspects in crowding.


Figures

Figure 1.
Figure 1.
Experimental conditions to test low-level impacts on (un)crowding. (A) Experiment 1: Dissecting global configurations to iso-target (upper) and ortho-target (lower) flankers to test if low-level interactions can explain uncrowding. For example, line-line detector inhibitions (iso-target; upper) such as divisive normalization may suppress the center square (Carandini & Heeger, 2012; Coen-Cagli et al., 2015) so that the target uncrowds from the flanker. Alternatively, contour-contour interactions (ortho-target; lower) may create an illusory contour, which can group the flankers together and segment them out from the target (Clarke, Herzog, et al., 2014; Doerig et al., 2019; Francis et al., 2017). (B) Experiment 1 & 2: Radial (left)-tangential (right) anisotropic effects on uncrowding either in cardinal (0°) or oblique (45°) orientations. Here, red dots represent the fixation point, red dotted line represents the radial axis, and blue dotted line represents the tangential axis.
Figure 2.
Figure 2.
Pooled conditions. The y-axis shows mean threshold elevation (± SEM) relative to the unflanked (Vernier alone) condition (gray dotted lines equal to 1). Larger thresholds represent poor performance (strong crowding), and smaller thresholds represent good performance (weak crowding). Also, performance improves the more squares are presented, independently of the flanker and the Vernier orientation; vertical Vernier left and horizontal Vernier right panel. Colored dots show individual data points.
Figure 3.
Figure 3.
Experiment 1. Systematic dissection of flanker configurations with a vertical (top) or horizontal (bottom) Vernier target. The y-axis shows threshold elevation relative to the unflanked (Vernier alone) condition. In the 1-flanker conditions (a, b, & c: crowding conditions), iso-target flankers lead to the same performance deterioration as the complete square (b vs. a). In the three- and seven-flankers conditions, complete squares (d, g, j, & m) lead to better performance than the iso-target flankers (e, h, k, & n) or ortho-target flankers (f, i, l, & o). Bars and error bars represent Mean ± SEM, colored dots represent individual data points. Red dotted lines show the performance of the 1 square condition.
Figure 4.
Figure 4.
Experiment 2. The left panel shows the –45° rotated Vernier conditions (tangential direction), and right the +45° rotated Vernier conditions (radial direction). The y-axis shows threshold elevation relative to the unflanked (Vernier alone) condition. Performance was poor in most conditions (a–g), regardless of the radial (c, e, g) or tangential (b, d, f) alignments, except with the 35 squares grid (h). Bars and error bars represent Mean ± SEM, colored dots represent individual data points.
Figure 5.
Figure 5.
Experiment 3b. The center square aspect ratio discrimination task with (left) and without (right) Vernier presentation. Performance deteriorated (the target was more crowded) as the number of squares increased in the horizontal dimension, independent of whether or not the Vernier was presented. The y-axis shows threshold elevation relative to the one square condition. Mean ± SEM, colored dots represent individual data points. Note the change of y-axis scaling.
Figure 6.
Figure 6.
Model performance: percent error for Capsule networks and TTM, Vernier offset thresholds for the Laminart model. For both measures, larger values indicate worse performances. Red bars represent conditions leading to uncrowding in humans (good performance), and gray bars represent crowding (poor performance). Gray dashed lines show the model performance for the Vernier only condition. (A) Performance of Capsule Networks. We averaged the proportion of errors from 10 separately trained networks (mean ± SEM). (B) Performance of the Laminart model. We used an inference mechanism as described in Francis et al. (2017), and averaged the results over 20 runs per condition. (C) Performance of the TTM. We created 15 mongrels per condition and per offset direction (in total, 30 mongrels per condition) and determined the proportion of errors using a template matching algorithm. (D) Human performance reordered from Figure 3. (E) Conditions tested. Vertically aligned flanker conditions were also tested and presented in Supplementary Figure S4.

References

    1. Andriessen, J.J., & Bouma, H. (1976). Eccentric vision: Adverse interactions between line segments. Vision Research, 16(1), 71–78, 10.1016/0042-6989(76)90078-X. - DOI - PubMed
    1. Astle, A. T., McGovern, D. P., & McGraw, P. V. (2014). Characterizing the role of disparity information in alleviating visual crowding. Journal of Vision, 14(6), 8–8, 10.1167/14.6.8. - DOI - PubMed
    1. Attneave, F., & Olson, R. K. (1967). Discriminability of stimuli varying in physical and retinal orientation. Journal of Experimental Psychology, 74(2p1), 149.
    1. Bach, M. (1996). The Freiburg Visual Acuity Test—Automatic Measurement of Visual Acuity. Optometry and Vision Science, 73(1), 49–53. - PubMed
    1. Ball, K., & Sekuler, R. (1982). A specific and enduring improvement in visual motion discrimination. Science, 218(4573), 697–698. - PubMed

Publication types