

GRASP55 regulates intra-Golgi localization of glycosylation enzymes to control glycosphingolipid biosynthesis
- PMID: 34516001
- PMCID: PMC8521277
- DOI: 10.15252/embj.2021107766
GRASP55 regulates intra-Golgi localization of glycosylation enzymes to control glycosphingolipid biosynthesis
Abstract
The Golgi apparatus, the main glycosylation station of the cell, consists of a stack of discontinuous cisternae. Glycosylation enzymes are usually concentrated in one or two specific cisternae along the cis-trans axis of the organelle. How such compartmentalized localization of enzymes is achieved and how it contributes to glycosylation are not clear. Here, we show that the Golgi matrix protein GRASP55 directs the compartmentalized localization of key enzymes involved in glycosphingolipid (GSL) biosynthesis. GRASP55 binds to these enzymes and prevents their entry into COPI-based retrograde transport vesicles, thus concentrating them in the trans-Golgi. In genome-edited cells lacking GRASP55, or in cells expressing mutant enzymes without GRASP55 binding sites, these enzymes relocate to the cis-Golgi, which affects glycosphingolipid biosynthesis by changing flux across metabolic branch points. These findings reveal a mechanism by which a matrix protein regulates polarized localization of glycosylation enzymes in the Golgi and controls competition in glycan biosynthesis.
Keywords: GRASP55; Golgi apparatus; glucosylceramide synthase; glycosphingolipids; glycosylation.
© 2021 The Authors. Published under the terms of the CC BY NC ND 4.0 license.
Conflict of interest statement
The authors declare that they have no conflict of interest.
Figures
- A
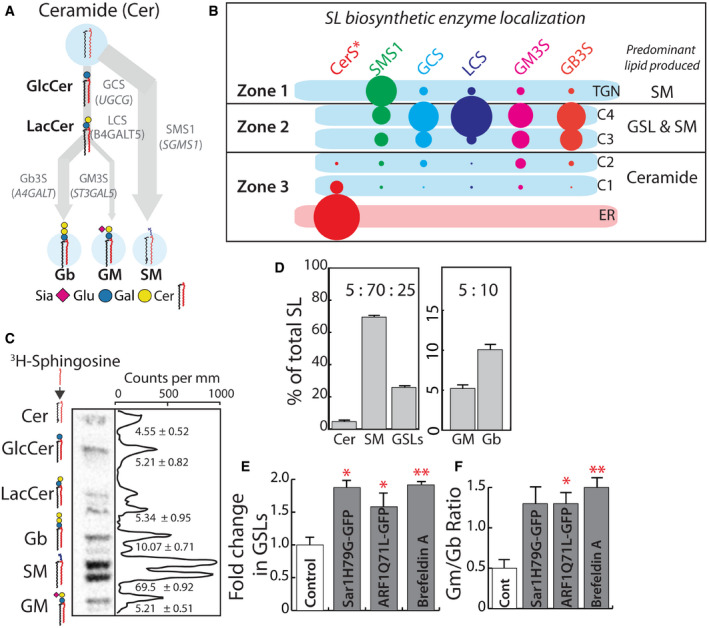
Schematic representation of GSL biosynthetic pathway in HeLa cells (Glu, glucose; Gal, galactose; Sia, N‐acetylneuraminic acid; Cer, ceramide). Products of biosynthesis are represented in bold and enzymes that catalyze the reactions in gray. The arrows represent the SL metabolic flux from ceramide.
- B
Schematic representation of GSL biosynthetic zones in HeLa, SM biosynthesis predominates in TGN, whereas GSL and SM productions happen in medial/trans‐Golgi (C3 and C4 cisternae). Cis‐Golgi/ER is where Ceramide biosynthesis happens with little, if any, SL production. CerS* refers to the group of Ceramide synthases localized to the ER. The size of the lipid label arbitrarily represents the proportion of the lipid expected to be synthesized in the compartment based on the localization of corresponding enzymes.
- C
High‐performance thin‐layer chromatography (HPTLC) profile of HeLa cells pulsed for 2 h with [3H]‐sphingosine and chased for 24 h. The peaks corresponding to each SL species are indicated, and numbers represent each SL species as percentage of total SL.
- D
The total radioactivity associated with Cer, SM, and GSLs (GluCer, LacCer, Gb, and GM), or GM and Gb were quantified and presented as percentages relative to total. Data represented as means ± SD of three independent experiments.
- E, F
Biosynthesis of SL in HeLa cells expressing GTP‐locked mutants of Sar1 or ARF1 or treated with Brefeldin A (BFA; 5 μg/ml) was measured by [3H]‐sphingosine pulse‐chase assay. Radioactivity associated with GSLs was quantified and represented as fold change with respect to control. (E) For BFA‐treated cells, the SL output was measured 8 h after pulse. Data represented as means ± SD of two independent experiments. *P < 0.05, **P < 0.01 (Student’s t‐test). (F) The ratio of GM/Gb is represented. Data represented as means ± SD of two independent experiments. *P < 0.05, **P < 0.01 (Student’s t‐test).
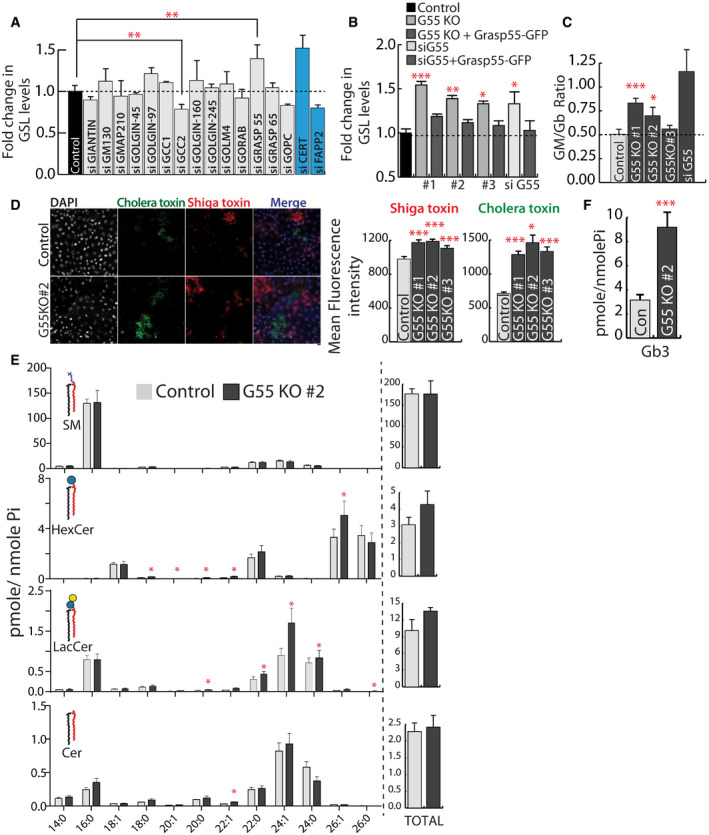
- A
HeLa cells were treated with control or indicated siRNA (pool of 4 or 2 as indicated in methods) for 72 h and SL biosynthesis measured by [3H]‐sphingosine pulse‐chase assay. GSL levels are expressed as fold changes with respect to control. CERT and FAPP2 knockdowns (blue bars) were used as controls. Data represented are mean ± SD of three independent experiments **P < 0.01 (Student’s t‐test).
- B, C
Effect of GRASP55 depletion on SL biosynthesis monitored by [3H]‐sphingosine pulse‐chase assay in GRASP55 KO cells or cells treated with GRASP55 siRNA or following expression of GRASP55‐GFP in GRASP55 depleted cells. GSL levels are expressed as fold changes with respect to control. Data represented are mean ± SD of three independent experiments *P < 0.05, **P < 0.01, ***P < 0.001 (Student’s t‐test). (C) The levels of GM and Gb were quantified and represented as GM/Gb ratio. Data represented are mean ± SD of three independent experiments *P < 0.05, ***P < 0.001 (Student’s t‐test).
- D
Control and GRASP55KO cells were processed for Cy3‐conjugated Shiga Toxin (ShTxB) and Alexa488‐conjugated Cholera Toxin (ChTxB) staining followed by flow cytometry analysis. Mean fluorescence intensity was measured and represented. Data represented are mean ± SD of three independent experiments *P < 0.05, ***P < 0.001 (Student’s t‐test). Scale bar: 10 μm.
- E, F
SL levels as assessed by LC/MS or MALDI‐MS (Gb3) in control and GRASP55 KO (#2) cells. Data represented are mean ± SD of three independent experiments *P < 0.05, ***P < 0.001 (Student’s t‐test).
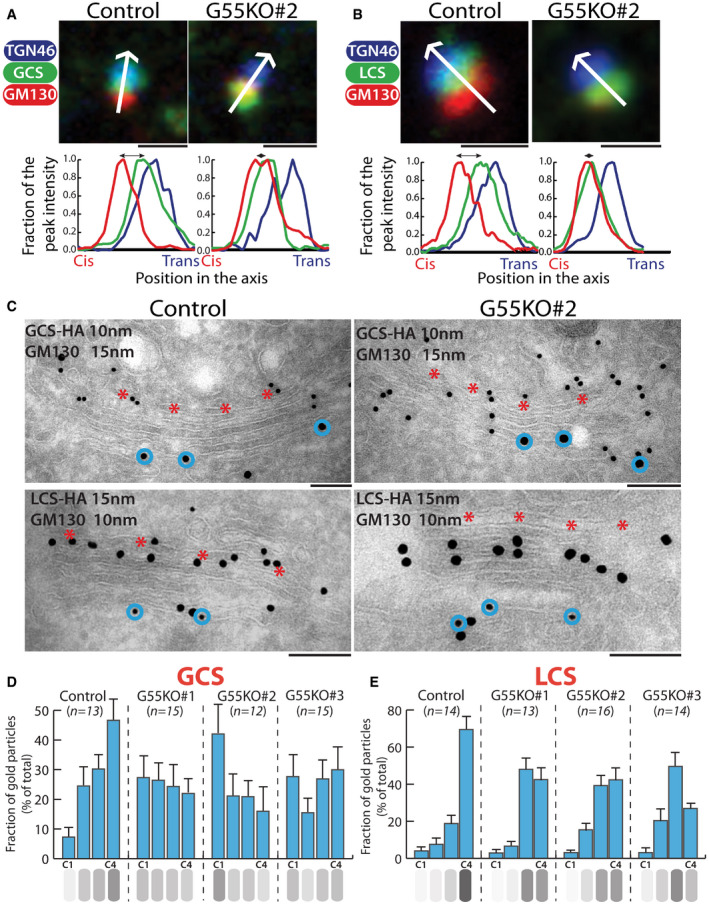
- A, B
Control and GRASP55 KO clones were transfected with HA‐tagged GSL biosynthetic enzymes, treated with nocodazole (33 µM) for 3 h, and processed for immunofluorescence with anti‐HA (green), anti‐GM130 (red), and anti‐TGN46 (blue) antibodies. The relative position of HA‐tagged enzymes with respect to GM130 and TGN46 was measured by line scanning and expressed as normalized positions of the peak intensity with the start of GM130 peak indicated as Cis and the end of TGN46 peak indicated as trans in the graph. The double‐headed arrows show the distance between the peak localization of GM130 and the enzymes. Scale bar 1 μm.
- C
Control and GRASP55 KO cells were transfected for 16 h with GCS‐HA or LCS‐HA and processed for cryoimmunolabeling with anti‐HA antibody (10‐nm gold particles) and anti‐GM130 antibody (15‐nm gold particles) in case of GCS‐HA and anti‐HA antibody (15‐nm gold particles) and anti‐GM130 antibody (10‐nm gold particles) in case of LCS‐HA. Representative images of the distribution of GCS‐HA and LCS‐HA are shown. Scale bar 200 nm. Red asterisk marks C4 cisterna and blue circles indicate GM130 labeling.
- D, E
Distribution of indicated enzymes across the Golgi stack was quantified and represented as fraction of Gold particles in each cisternae for GCS‐HA (D) and LCS‐ HA (E) (n indicated in the graph; data are Mean ± SEM).
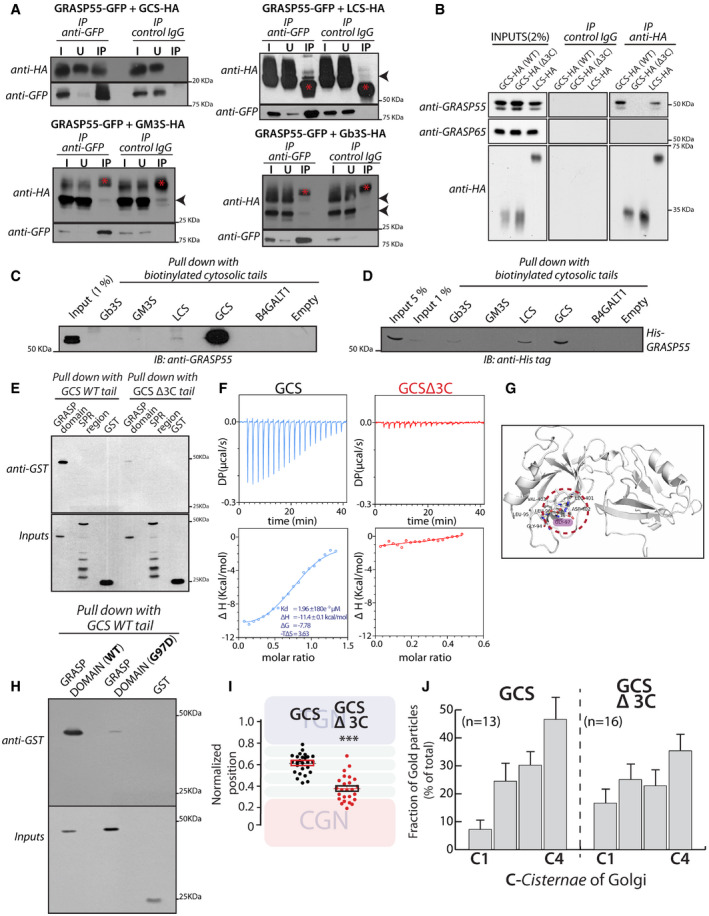
HeLa cells co‐transfected with indicated HA‐tagged enzymes (GCS, LCS, GM3S, and Gb3S) and GRASP55‐GFP were lysed, immunoprecipitated with anti‐GFP antibody or control IgG, and were analyzed by Western blotting for interaction by immunoblotting (IB) with anti‐HA antibody. I represents 5% on the input lysate, U 5% of the unbound fraction, and IP the immunoprecipitate. Red asterisks indicate IgG bands, and arrow heads indicate the expected position of HA‐tagged enzymes
WI‐26 fibroblasts transfected with the indicated HA‐tagged enzymes were lysed, immunoprecipitated with anti‐HA antibody or control IgG, and were analyzed by Western blotting for interaction by immunoblotting with the indicated antibodies.
Chemically synthesized biotinylated peptides corresponding to cytosolic portions of glycosylation enzymes were bound to avidin beads and were used to pull down interactors from HeLa cell lysates and subjected to immunoblotting with anti‐GRASP55 antibody.
The interaction of chemically synthesized biotinylated peptides, corresponding to cytosolic portions of glycosylation enzymes, with purified His‐tagged full‐length GRASP55 and their interaction was monitored by pulling down the biotinylated peptides bound to avidin beads followed by Western blotting with anti‐His tag antibody.
Chemically synthesized biotinylated peptides corresponding to cytosolic portions of GCS (WT and Δ3C) and indicated purified GST‐tagged GRASP domain or SPR region of GRASP55 were incubated together, and their interaction was monitored by pulling down the biotinylated peptides with avidin beads followed by Western blotting with an anti‐GST tag antibody.
ITC profile, representative of at least two independent experiments, for biotinylated GCS and GCS Δ3C cytosolic tails with recombinant GRASP55.
The molecular basis of interaction between GRASP55 and ceramide glucosyltransferase C‐terminal peptide is studied by building a model of GRASP55:GCS peptide structure in the absence of the complex crystal structure. The carboxylate group of Leu of “LDV” motif retains conserved hydrogen bonds with the backbone of 95LLGV98motif of GRASP55. Gly97 residue which crucial to GRASP:GCS interaction is highlighted (pink).
The interactions of chemically synthesized biotinylated peptides corresponding to cytosolic portions of GCS (WT) with the indicated purified GST‐tagged GRASP domain (WT) or GRASP domain (G97D) were monitored by pulling down the biotinylated peptides with avidin beads followed by Western blotting with an anti‐GST tag antibody.
HeLa cells were transfected with either WT GCS or GCS Δ3C, treated with nocodazole (33 µM) for 3 h and labeled for enzymes, GM130, and TGN46 (to mark CGN and TGN respectively). Line scan analysis was performed as in Fig 3A and B, and the relative position of enzymes was quantitated and plotted. The data are mean ± SD (n = 30) representative of two experiments. **P < 0.01, ***P < 0.001(Student’s t‐test) and ns signifies not statistically significant.
HeLa cells were transfected with either WT GCS or GCS Δ3C for 16 h and processed for cryoimmunolabeling. Distribution of indicated enzymes across the Golgi stack was quantified and represented as fraction of Gold particles in each cisterna (n indicated in the graph; data are Mean ± SEM).
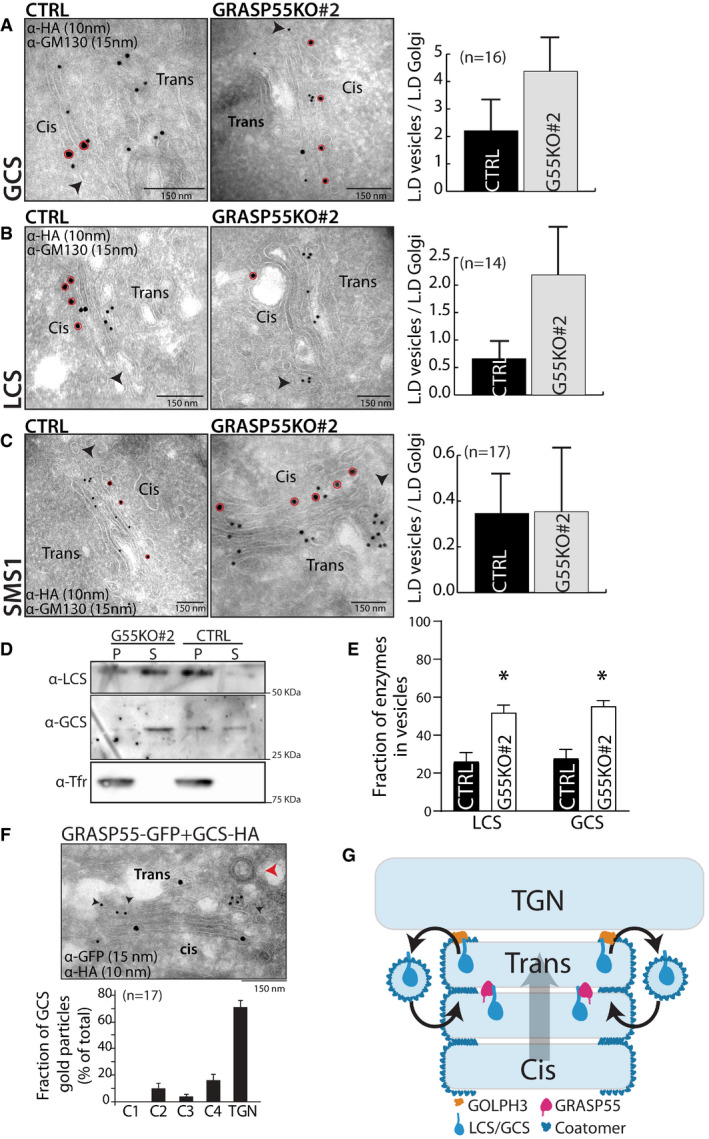
- A–C
Control and GRASP55 KO (#2) cells were transfected for 16 h with the indicated HA‐tagged enzymes and processed for cryoimmunolabeling with anti‐HA antibody (10‐nm gold particles) and anti‐GM130 antibody (15‐nm gold particles). Representative images of the distribution of HA‐tagged enzymes are shown. Red circles indicate GM130 labeling. Arrow heads represent the peri‐Golgi vesicles. Scale bar 150 nm. Quantification of the distribution of enzymes in vesicles represented as normalized linear density (n indicated in the graph; data are Mean ± SEM).
- D
COPI vesicles were reconstituted using the two‐stage incubation system (detailed in the Methods section). After the second‐stage incubation, samples were centrifuged to obtain the pellet fraction that contains Golgi membranes and the supernatant fraction that contains reconstituted COPI vesicles. Both fractions were immunoblotted for LCS, GCS, and transferrin receptor (Tfr) to show their relative distributions on Golgi membranes and in COPI vesicles.
- E
The COPI vesicle reconstitution system was performed as described above (in D), and then the fraction of LCS and GCS in COPI vesicles versus their total distribution (on Golgi membranes and in COPI vesicles) was calculated. The mean and standard error from three independent experiments are shown, *P < 0.05, Student’s t‐test.
- F
HeLa cells co‐transfected with HA‐tagged GCS and GRASP55‐GFP were incubated for 16 h and were processed for cryoimmunolabeling with anti‐HA antibody (10‐nm gold particles) and anti‐GFP antibody (15‐nm gold particles). Representative images of the distribution of GCS and GRASP55‐GFP are shown. Red arrowhead indicates the clathrin‐coated vesicle that marks the TGN area, and black arrowheads indicate the presence of GCS‐HA in TGN. Scale bar 150 nm. Distribution of GCS across the Golgi stack and TGN was quantified and represented as fraction of gold particles (n indicated in the graph; data are Mean ± SEM).
- G
Model represents GRASP55‐mediated compartmentalization of GCS and LCS. A cyclical and balanced activity of GRASP55 and GOLPH3 compartmentalizes LCS/GCS to the trans‐Golgi. The anterograde transport of enzymes (forward direction arrow; cis to trans direction) counterbalances their retrograde transport (reverse direction arrow; trans to cis direction) resulting in the compartmentalization of these enzymes.
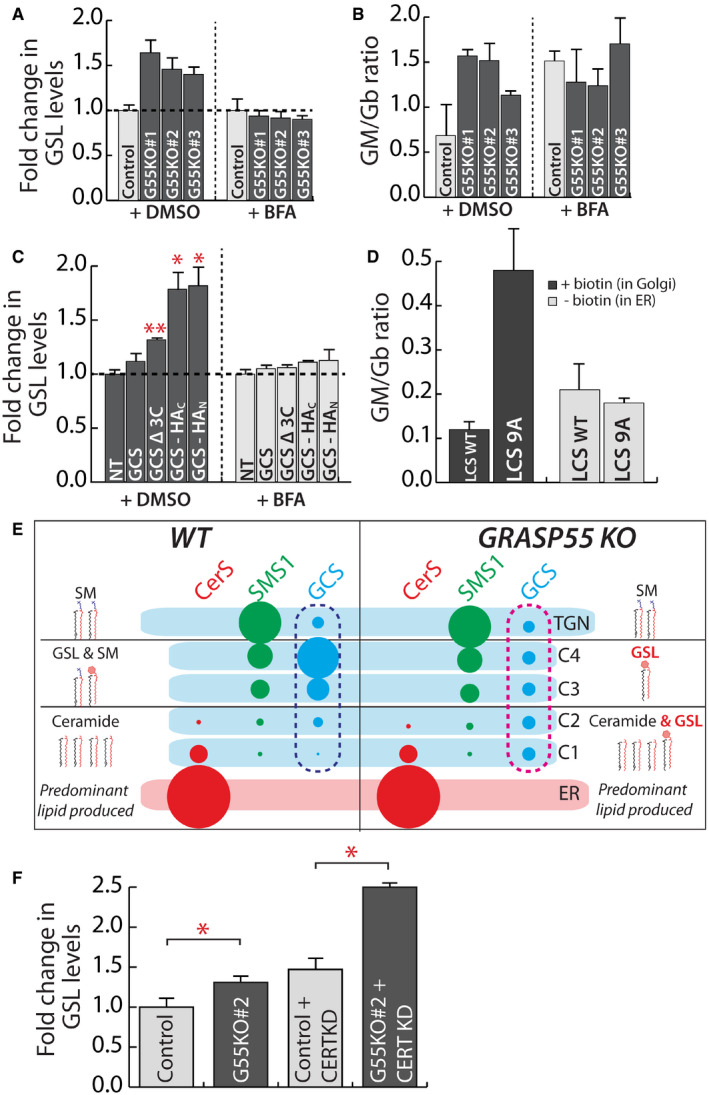
- A, B
Control and GRASP55 KO clones were pre‐treated with DMSO or BFA (5 μg/ml) for 30 min and SL output monitored by [3H]‐sphingosine pulse‐chase assay (8 h chase). Total GSL levels were quantified and expressed as fold changes with respect to control (A). The GM/Gb ratio was calculated and represented (B). Data are mean ± SD of two independent experiments.
- C
HeLa cells were transfected with indicated GCS constructs for 16 h and SL output monitored by [3H]‐sphingosine pulse‐chase assay (8 h chase) in the presence or absence of BFA (5 μg/ml). Total GSL levels were quantified and expressed as fold changes with respect to control. NT refers to non‐transfected cells. Data are mean ± SD of two independent experiments. *P < 0.05, **P < 0.01, (Student’s t‐test).
- D
HeLa cells KO for LCS were transfected with indicated LCS RUSH constructs for 16 h, and expressed enzymes were retained in the ER (‐biotin) or placed in the Golgi by the addition of biotin (40 μM) (+biotin) and SL output monitored by [3H]‐sphingosine pulse‐chase assay. The ratio of GM/Gb is represented. Data are mean ± SD of two independent experiments.
- E
Schematic representation of how the change in localization of GCS in GRASP55 KO with respect to control (pink dashed box versus blue dashed box) from trans‐ to cis‐Golgi results in preferential access to ceramide and thus an increased production of GSLs.
- F
CERT was silenced using siRNAs for 72 h in control and GRASP55 KO (#2) clone before subjecting to [3H]‐sphingosine pulse‐chase assay. GSLs were quantified and represented as fold change with respect to control. Values are mean ± SD (n = 3). *P < 0.05, (Student’s t‐test).
References
-
- Bielawski J, Szulc ZM, Hannun YA, Bielawska A (2006) Simultaneous quantitative analysis of bioactive sphingolipids by high‐performance liquid chromatography‐tandem mass spectrometry. Methods 39: 82–91 - PubMed
Publication types
MeSH terms
Substances
Grants and funding
LinkOut - more resources
Full Text Sources
Molecular Biology Databases
