. 2022 Feb;46(2):281-295.
doi: 10.1111/aor.14066. Epub 2021 Sep 21.

Clinical assessment of liver metabolism during hypothermic oxygenated machine perfusion using microdialysis

Affiliations

Clinical assessment of liver metabolism during hypothermic oxygenated machine perfusion using microdialysis

Damiano Patrono et al. Artif Organs. 2022 Feb.

Abstract

Background: While growing evidence supports the use of hypothermic oxygenated machine perfusion (HOPE) in liver transplantation, its effects on liver metabolism are still incompletely understood.

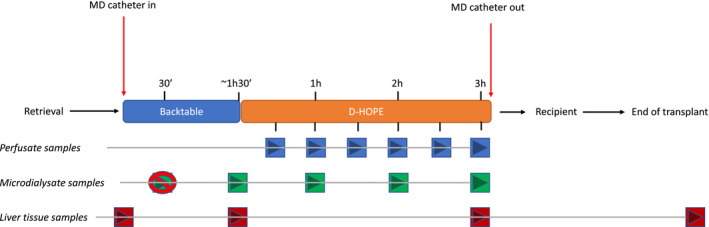
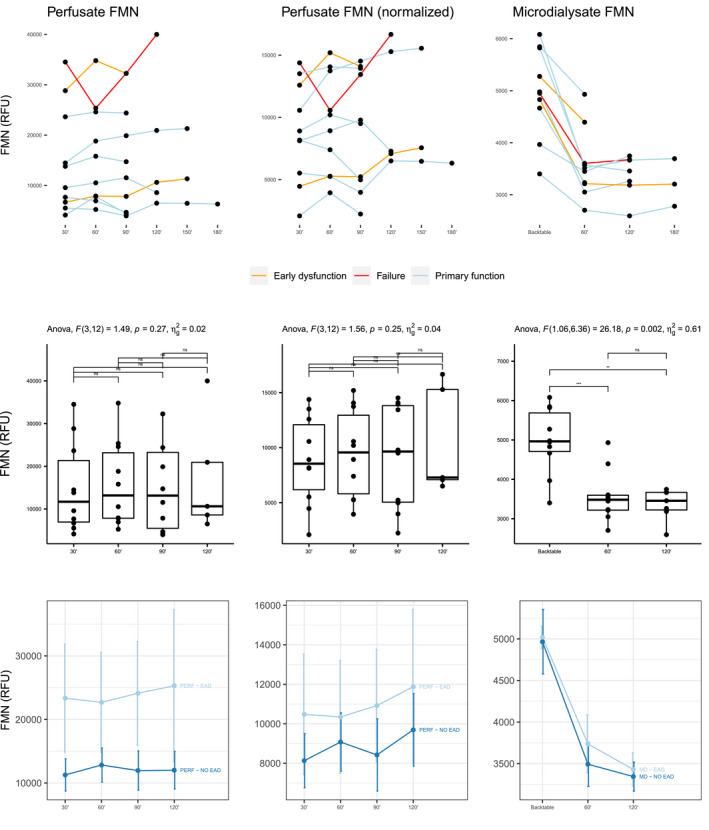
Methods: To assess liver metabolism during HOPE using microdialysis (MD), we conducted an open-label, observational pilot study on 10 consecutive grafts treated with dual-HOPE (D-HOPE). Microdialysate and perfusate levels of glucose, lactate, pyruvate, glutamate, and flavin mononucleotide (FMN) were measured during back table preparation and D-HOPE and correlated to graft function and patient outcome.

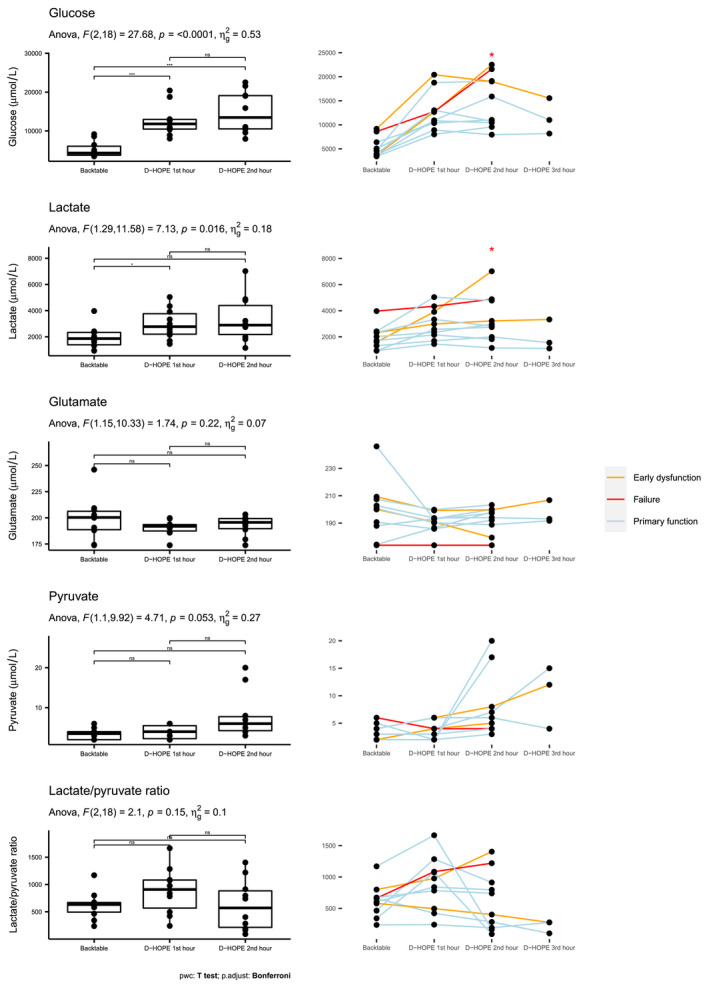
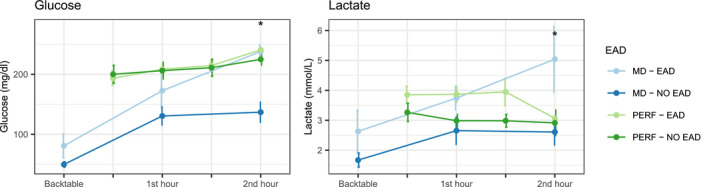
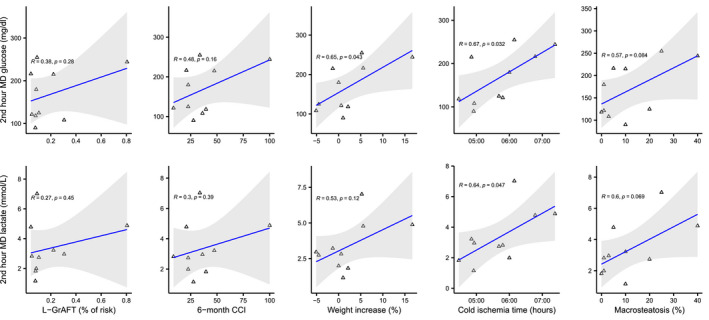
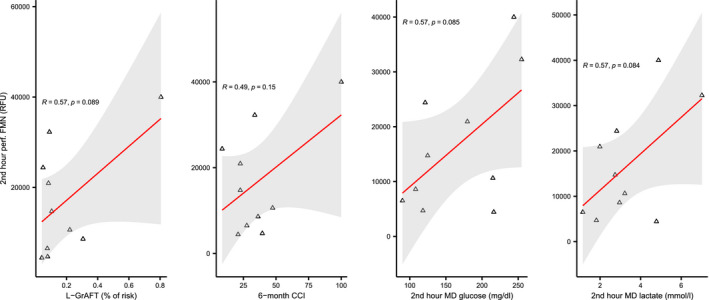
Results: Median (IQR) MD and D-HOPE time was 228 (210, 245) and 116 (103, 143) min. Three grafts developed early allograft dysfunction (EAD), with one requiring retransplantation. During D-HOPE, MD glucose and lactate levels increased (ANOVA = 9.88 [p = 0.01] and 3.71 [p = 0.08]). Their 2nd-hour levels were higher in EAD group and positively correlated with L-GrAFT score. 2nd-hour MD glucose and lactate were also positively correlated with cold ischemia time, macrovesicular steatosis, weight gain during D-HOPE, and perfusate FMN. These correlations were not apparent when perfusate levels were considered. In contrast, MD FMN levels invariably dropped steeply after D-HOPE start, whereas perfusate FMN was higher in dysfunctioning grafts.

Conclusion: MD glucose and lactate during D-HOPE are markers of hepatocellular injury and could represent additional elements of the viability assessment.

Keywords: extracellular fluid; flavin mononucleotide; liver metabolism; liver viability assessment; machine perfusion; microdialysis.


Conflict of interest statement

The authors of this manuscript have no conflicts of interest to disclose.

Figures

FIGURE 1
FIGURE 1
Synopsis of study design [Color figure can be viewed at wileyonlinelibrary.com]
FIGURE 2
FIGURE 2
Glucose, lactate, glutamate, pyruvate levels and lactate/pyruvate ratio in microdialysate during backtable preparation and subsequent machine perfusion. In the left column, levels across different timepoints are compared using ANOVA for repeated measures. Degrees of freedom, F‐statistic (F), p‐value, and generalized effect size squared (η 2) are provided for each biomarker. Levels of significance of pairwise t‐test across different time points is indicated as non‐significant (ns), <0.01 (**) or <0.001 (***). Y axis scale changes across different plots to improve data visualization. As only 3 grafts had a D‐HOPE time exceeding 2 h, the 3‐h timepoint is not visualized. In the right column, line plots depicting the trend of study metabolites in each patient are provided. Line colors identify patients who had primary graft function (light blue), early allograft dysfunction (orange), or required retransplantation (red). 2nd hour samples were collected 2 h after the beginning of D‐HOPE or at the end of machine perfusion when D‐HOPE time was <120 min. Asterisks indicate that glucose and lactate levels during the 2nd hour of D‐HOPE were significantly higher in patients developing early allograft dysfunction. pwc, pairwise comparison [Color figure can be viewed at wileyonlinelibrary.com]
FIGURE 3
FIGURE 3
Line plots depicting trend of glucose and lactate in perfusate (green and light green) and microdialysate (blue and light blue), according to subsequent development of early allograft dysfunction. In cases in which D‐HOPE time was <120 min, 2nd hour samples were collected at the end of machine perfusion. Values are represented as mean ± standard error (vertical error bars) [Color figure can be viewed at wileyonlinelibrary.com]
FIGURE 4
FIGURE 4
Correlation of 2nd hour MD metabolites with L‐GrAFT score, 6‐month CCI, and graft characteristics [Color figure can be viewed at wileyonlinelibrary.com]
FIGURE 5
FIGURE 5
Non‐adjusted (left column) and adjusted (middle column) flavin mononucleotide level in perfusate and in microdialysate (right column). Individual trends for each patient are presented in the first row, with colors differentiating cases according to early graft function. Levels across different timepoints are compared with ANOVA for repeated measures in the second row. In the third row, levels (mean ± standard error) are presented according to the development of early allograft dysfunction [Color figure can be viewed at wileyonlinelibrary.com]
FIGURE 6
FIGURE 6
Correlation of 2nd hour perfusate FMN with L‐GrAFT score, 6‐month CCI, and 2nd hour MD metabolites [Color figure can be viewed at wileyonlinelibrary.com]
FIGURE 7
FIGURE 7
Panel A. Representative histological images of liver grafts at the end of transplant (100× original magnification). Non‐EAD case (case 10; images A–C) showed mild signs of steatosis and reperfusion injury (A). PAS staining (B) enhanced cytoplasmatic hepatocytes’ glycogen deposits, confirmed with PAS‐D staining (C). Glycogen was diffusely distributed with a zone‐1‐to‐zone‐3 gradient pattern. EAD case (case 3; images D–F) was characterized by mild steatosis and focal parcellar necrosis (D). Glycogen was present in few periportal hepatocytes (E,F). Graft failure case (case 4; images G–I) showed severe steatosis (G) and minimal signs of glycogen deposits (H,I). Microscope liver histologic slides were scanned with the NanoZoomer S210 Digital slide scanner (Hamamatsu Photonics K.K.) using an objective lens with a numerical aperture of 0.75. Slides were focused at 400× original magnification (scanning resolution: 0.23 μm/pixel), and images were acquired with the NDP.scan image acquisition software (Hamamatsu Photonics K.K.). Then, contrast and brightness corrections were performed to the whole image and data exported with the NDP.view2 viewing software (Hamamatsu Photonics K.K.). Panel B. Cytokines levels at the start of backtable preparation (T1), before (T2) and after (T3) machine perfusion, and at the end of transplant operation (T4). No significant differences were observed between EAD and non‐EAD patients at any timepoint [Color figure can be viewed at wileyonlinelibrary.com]

References

    1. Schlegel A, Muller X, Kalisvaart M, Muellhaupt B, Perera MTPR, Isaac JR, et al. Outcomes of DCD liver transplantation using organs treated by hypothermic oxygenated perfusion before implantation. J Hepatol. 2019;70:50–7. - PubMed
    1. van Rijn R, Karimian N, Matton APM, Burlage LC, Westerkamp AC, van den Berg AP, et al. Dual hypothermic oxygenated machine perfusion in liver transplants donated after circulatory death. Br J Surg. 2017;104:907–17. - PMC - PubMed
    1. van Rijn R, Schurink IJ, de Vries Y, van den Berg AP, Cortes Cerisuelo M, Darwish Murad S, et al. Hypothermic machine perfusion in liver transplantation—a randomized trial. N Engl J Med. 2021;384:1391–401. - PubMed
    1. Patrono D, Surra A, Catalano G, Rizza G, Berchialla P, Martini S, et al. Hypothermic oxygenated machine perfusion of liver grafts from brain‐dead donors. Sci Rep. 2019;9:9337. - PMC - PubMed
    1. Ravaioli M, De Pace V, Angeletti A, Comai G, Vasuri F, Baldassarre M, et al. Hypothermic oxygenated new machine perfusion system in liver and kidney transplantation of extended criteria donors: first Italian clinical trial. Sci Rep. 2020;10:6063. - PMC - PubMed