. 2021 Sep 13;17(9):e1008913.
doi: 10.1371/journal.pcbi.1008913. eCollection 2021 Sep.

A statistical model for describing and simulating microbial community profiles

Affiliations

A statistical model for describing and simulating microbial community profiles

Siyuan Ma et al. PLoS Comput Biol. .

Abstract

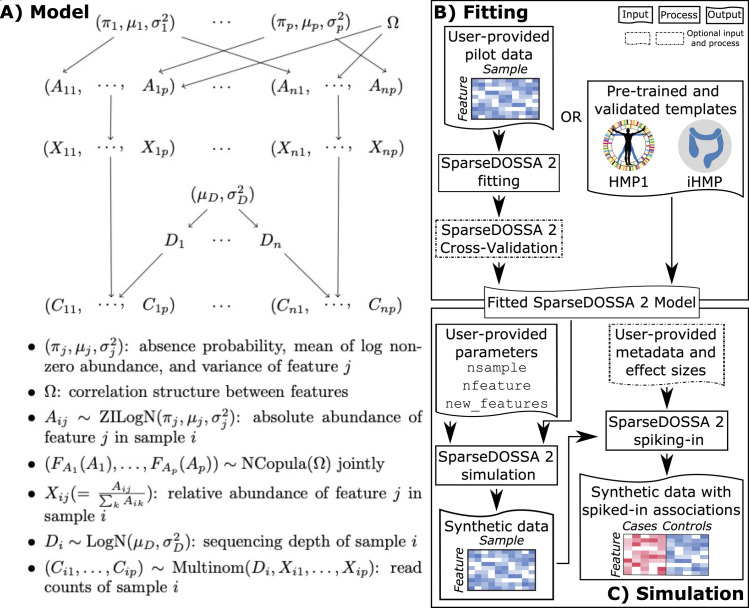
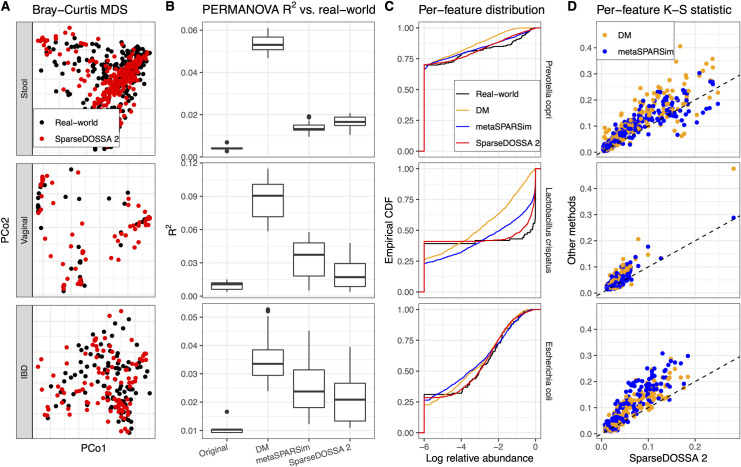
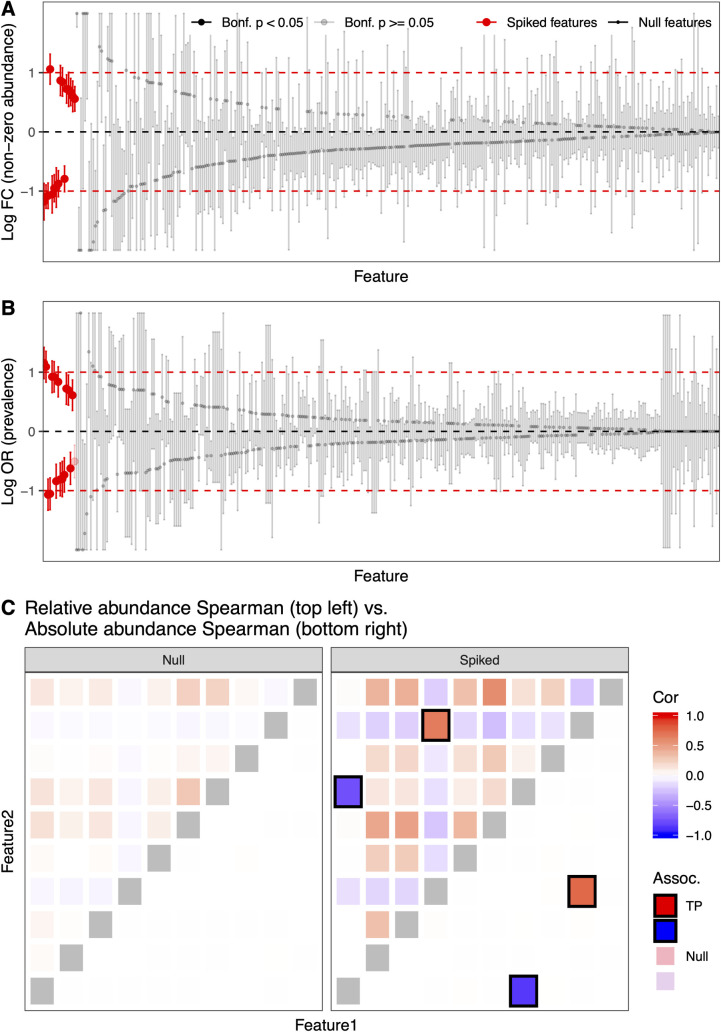
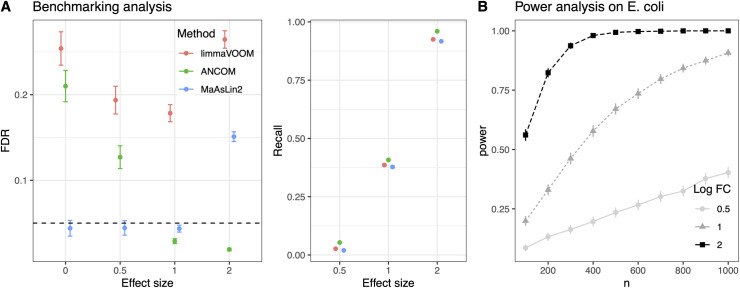
Many methods have been developed for statistical analysis of microbial community profiles, but due to the complex nature of typical microbiome measurements (e.g. sparsity, zero-inflation, non-independence, and compositionality) and of the associated underlying biology, it is difficult to compare or evaluate such methods within a single systematic framework. To address this challenge, we developed SparseDOSSA (Sparse Data Observations for the Simulation of Synthetic Abundances): a statistical model of microbial ecological population structure, which can be used to parameterize real-world microbial community profiles and to simulate new, realistic profiles of known structure for methods evaluation. Specifically, SparseDOSSA's model captures marginal microbial feature abundances as a zero-inflated log-normal distribution, with additional model components for absolute cell counts and the sequence read generation process, microbe-microbe, and microbe-environment interactions. Together, these allow fully known covariance structure between synthetic features (i.e. "taxa") or between features and "phenotypes" to be simulated for method benchmarking. Here, we demonstrate SparseDOSSA's performance for 1) accurately modeling human-associated microbial population profiles; 2) generating synthetic communities with controlled population and ecological structures; 3) spiking-in true positive synthetic associations to benchmark analysis methods; and 4) recapitulating an end-to-end mouse microbiome feeding experiment. Together, these represent the most common analysis types in assessment of real microbial community environmental and epidemiological statistics, thus demonstrating SparseDOSSA's utility as a general-purpose aid for modeling communities and evaluating quantitative methods. An open-source implementation is available at http://huttenhower.sph.harvard.edu/sparsedossa2.


Conflict of interest statement

The authors have declared that no competing interests exist.

Figures

Fig 1
Fig 1. A hierarchical model for microbial community feature profiles.
A) SparseDOSSA comprises a hierarchical model to capture the generation mechanism of microbial sequencing counts, including components for “hidden” absolute abundances, sequencing depth (and thus compositional relative abundances), zero inflation, and feature-feature and feature-environment interactions. Notations not defined in the figure: FAj(·): cumulative density function (CDF) for the absolute abundance of feature Aj. μD, σD2: mean and variance of the log normal sequencing depth distribution. B) SparseDOSSA can be fitted to varied microbial community types using cross-validation procedures by users; the software also provides pre-trained models are provided for human microbiome template datasets. This allows for C) simulation of either null or "true positive" association spiked-in synthetic datasets, to facilitate microbiome benchmarking or power analysis studies.
Fig 2
Fig 2. SparseDOSSA accurately recapitulates different microbial community structures.
We compared SparseDOSSA 2 simulated microbial counts versus those of three human microbiome training template datasets (Stool, Vaginal, and IBD). A) Bray-Curtis ordination shows global agreement between SparseDOSSA simulated microbial abundance profiles and those of their originating real-world populations. B) This was quantified by PERMANOVA R2 statistics, showing that SparseDOSSA simulated samples were significantly less systematically differentiated from their targets than existing DM and metaSPARSim methods in almost all cases (Wilcoxon rank sum test p-values included in S3 Table). R2 compared against randomly split original real-world data are included as baseline controls. C) Representative features from each environment are similarly distributed between real-world and SparseDOSSA simulated samples, as shown in empirical cumulative distribution functions (CDFs) of log-10 relative abundances (with pseudo value 1e-6 to visually represent zeros). D) Per-feature Kolmogorov-Smirnov summary statistics quantify that SparseDOSSA outperforms existing methods in simulating realistic feature-level relative abundance distributions. First, the similarity between the model-simulated feature abundance distribution versus that in the real-world dataset is quantified with K-S statistics. Then, the K-S statistics for SparseDOSSA and the other two models (DM and metaSPARSim) are plotted on the x- and y-axis, respectively (each point representing one feature, smaller K-S statistics represent better approximation). Lastly, the K-S statistics of SparseDOSSA versus other models are formally tested using Wilcoxon signed rank tests (p-values are significant and included in S4 Table).
Fig 3
Fig 3. SparseDOSSA can add feature-phenotype and feature-feature associations to modeled microbial community simulations.
A,B) SparseDOSSA 2 correctly simulated feature-phenotype associations targeting the prescribed non-zero relative abundance (A) and prevalence (B) effect sizes of the spiked features, while maintaining non-associations of null features. True associated (spiked) microbial features (red) are well differentiated from null features (black), through Bonferroni corrected p-values (non-significant features marked in gray; test based on linear/generalized linear regression against the spiked metadata variable, see Methods for details). The horizontal dashed lines indicate true spike-in effect sizes: red lines for the positive and negative true effect sizes, respectively, and the black line for null effect (0). C) SparseDOSSA can also prescribe feature-feature associations. Bottom right triangles are Spearman correlations in the simulated absolute abundances. As prescribed, only true association feature pairs are correlated. Top right triangles are Spearman correlations in the corresponding, simulated relative abundances. Note that in this example, Spearman correlation does not differentiate between true (“biological”) covariations versus those induced spuriously due to compositionality (as is also the case in the underlying data on which SparseDOSSA’s model is fit). As expected, both true signals and spurious correlations caused by compositionality can be observed for such data. TP: true positives.
Fig 4
Fig 4. SparseDOSSA enables comparative benchmarking and power analysis of microbial community statistical association tests.
For any originating community type of interest, datasets simulated based on a SparseDOSSA model fit can be spiked with known "phenotypes" and feature effect sizes to estimate methods performance (power, FPR, etc.) during (A) benchmarking as well as (B) power analysis, across controlled combinations of potential effect sizes and sample sizes. Points indicate average performance across simulation repetitions and error bars indicate standard error (Methods).
Fig 5
Fig 5. SparseDOSSA correctly models the effects of diet and time on the murine gut microbiome by reproducing effects from amplicon sequencing profiles.
A) SparseDOSSA 2 was fitted to subsets of samples from [24] that included up to three time points each from collections of mice fed chow, raw or cooked tubers, and meat. The resulting models were then used to simulate controlled microbial community profiles, which correctly reproduced the beta-diversity structures present in the original study (MDS ordination by Bray-Curtis dissimilarities, corresponding to Fig 1A of [24]). The SparseDOSSA model was also able to model and synthetically replicate changes in "Bacteroidetes" and "Firmicutes" phyla in response to raw vs. cooked diets, including B) overall community alpha-diversity (Shannon index), C) the resulting "Firmicutes" vs. "Bacteroidetes" ratio, and D) overall whole-community effective biomass. These correspond to [24]’s Fig 1F–1H, respectively. TRF = raw tuber (free-fd); TCF = cooked tuber (free-fed); TCR = cooked tuber (restricted ration).

References

    1. Mallick H, Ma S, Franzosa EA, Vatanen T, Morgan XC, Huttenhower C. Experimental design and quantitative analysis of microbial community multiomics. Genome Biol. 2017;18(1):228. Epub 2017/12/01. doi: 10.1186/s13059-017-1359-z; PubMed Central PMCID: PMC5708111. - DOI - PMC - PubMed
    1. Lloyd-Price J, Arze C, Ananthakrishnan AN, Schirmer M, Avila-Pacheco J, Poon TW, et al.. Multi-omics of the gut microbial ecosystem in inflammatory bowel diseases. Nature. 2019;569(7758):655–62. Epub 2019/05/31. doi: 10.1038/s41586-019-1237-9 ; PubMed Central PMCID: PMC6650278. - DOI - PMC - PubMed
    1. Wirbel J, Pyl PT, Kartal E, Zych K, Kashani A, Milanese A, et al.. Meta-analysis of fecal metagenomes reveals global microbial signatures that are specific for colorectal cancer. Nat Med. 2019;25(4):679–89. Epub 2019/04/03. doi: 10.1038/s41591-019-0406-6 . - DOI - PMC - PubMed
    1. Gloor GB, Macklaim JM, Pawlowsky-Glahn V, Egozcue JJ. Microbiome Datasets Are Compositional: And This Is Not Optional. Front Microbiol. 2017;8:2224. Epub 2017/12/01. doi: 10.3389/fmicb.2017.02224; PubMed Central PMCID: PMC5695134. - DOI - PMC - PubMed
    1. McMurdie PJ, Holmes S. Waste not, want not: why rarefying microbiome data is inadmissible. PLoS Comput Biol. 2014;10(4):e1003531. Epub 2014/04/05. doi: 10.1371/journal.pcbi.1003531; PubMed Central PMCID: PMC3974642. - DOI - PMC - PubMed

Publication types