. 2021 Sep 10;373(6560):1218-1224.
doi: 10.1126/science.abg7071. Epub 2021 Sep 9.

Regulation of biomolecular condensates by interfacial protein clusters

Affiliations

Regulation of biomolecular condensates by interfacial protein clusters

Andrew W Folkmann et al. Science. .

Abstract

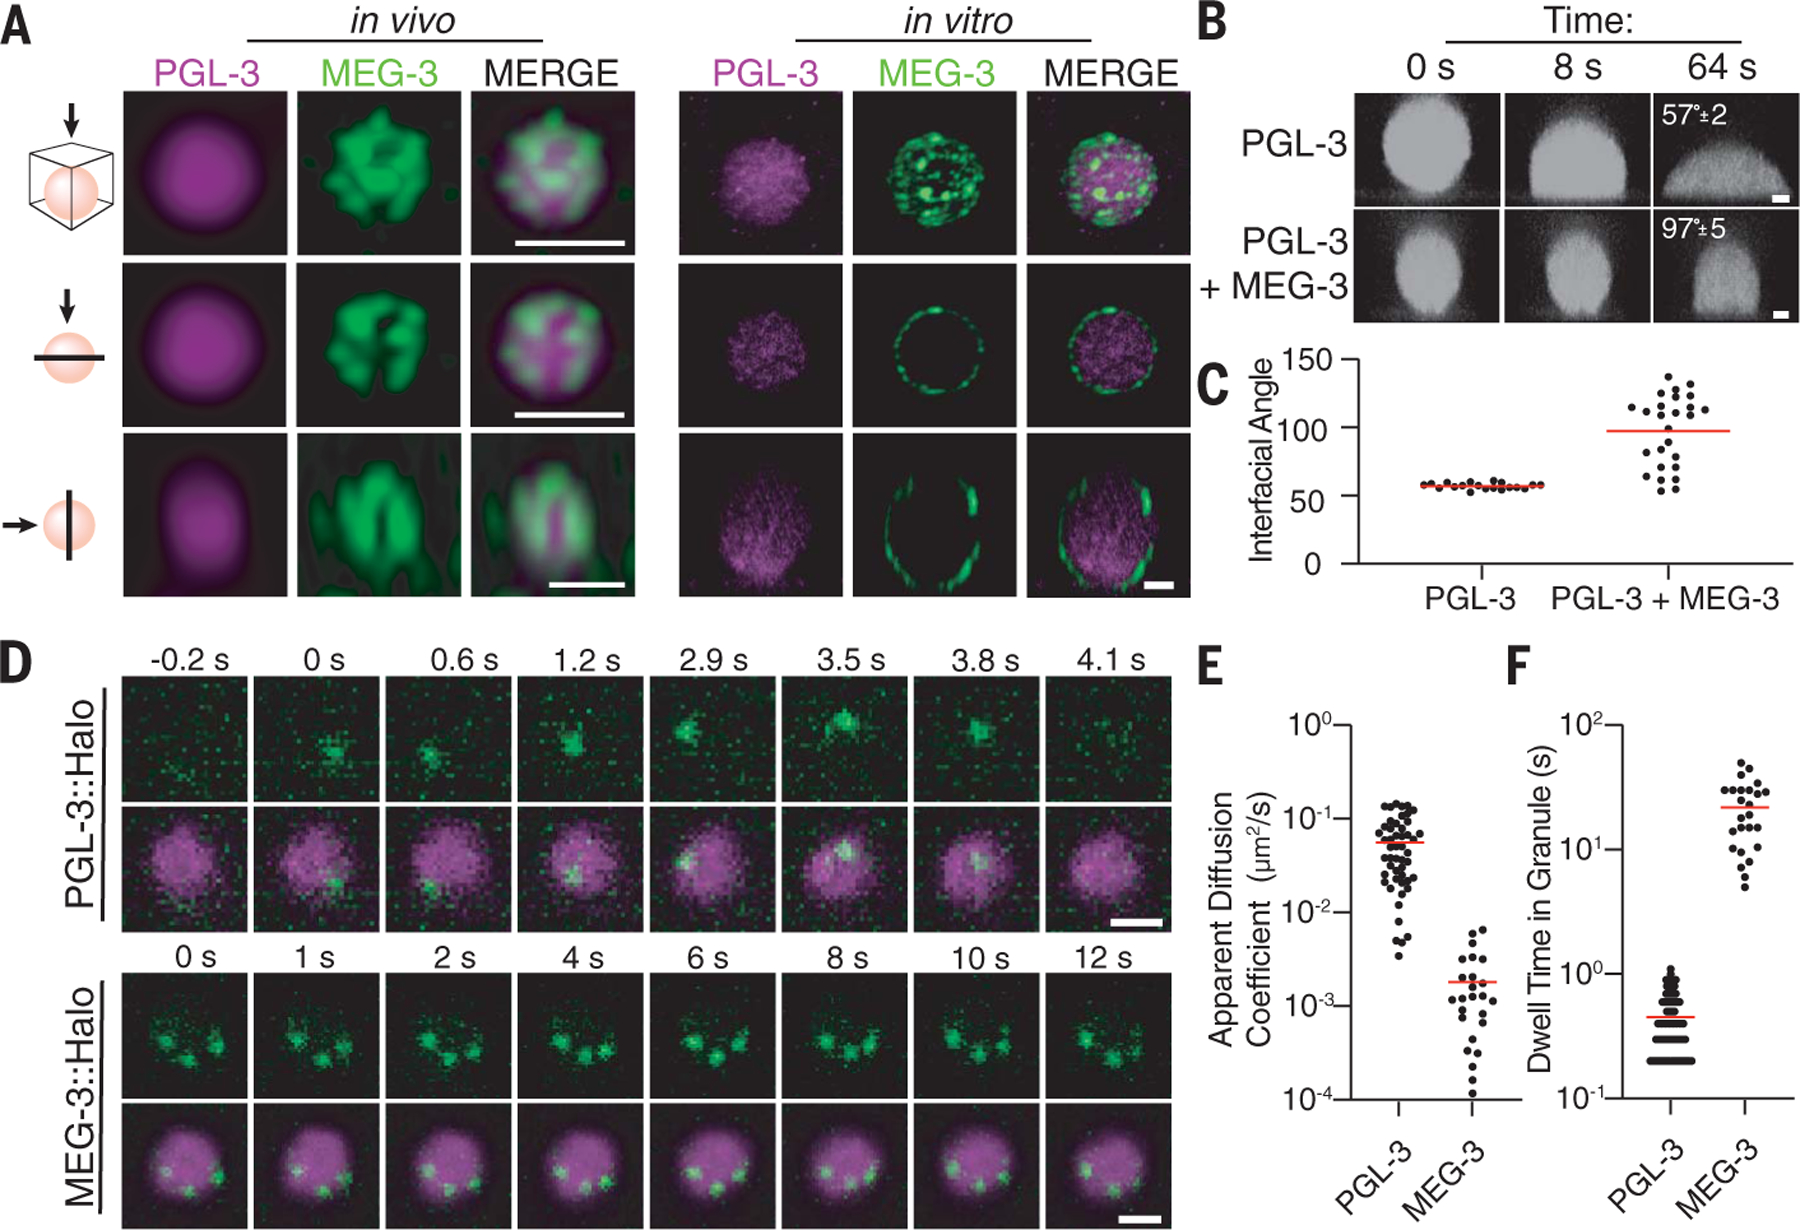
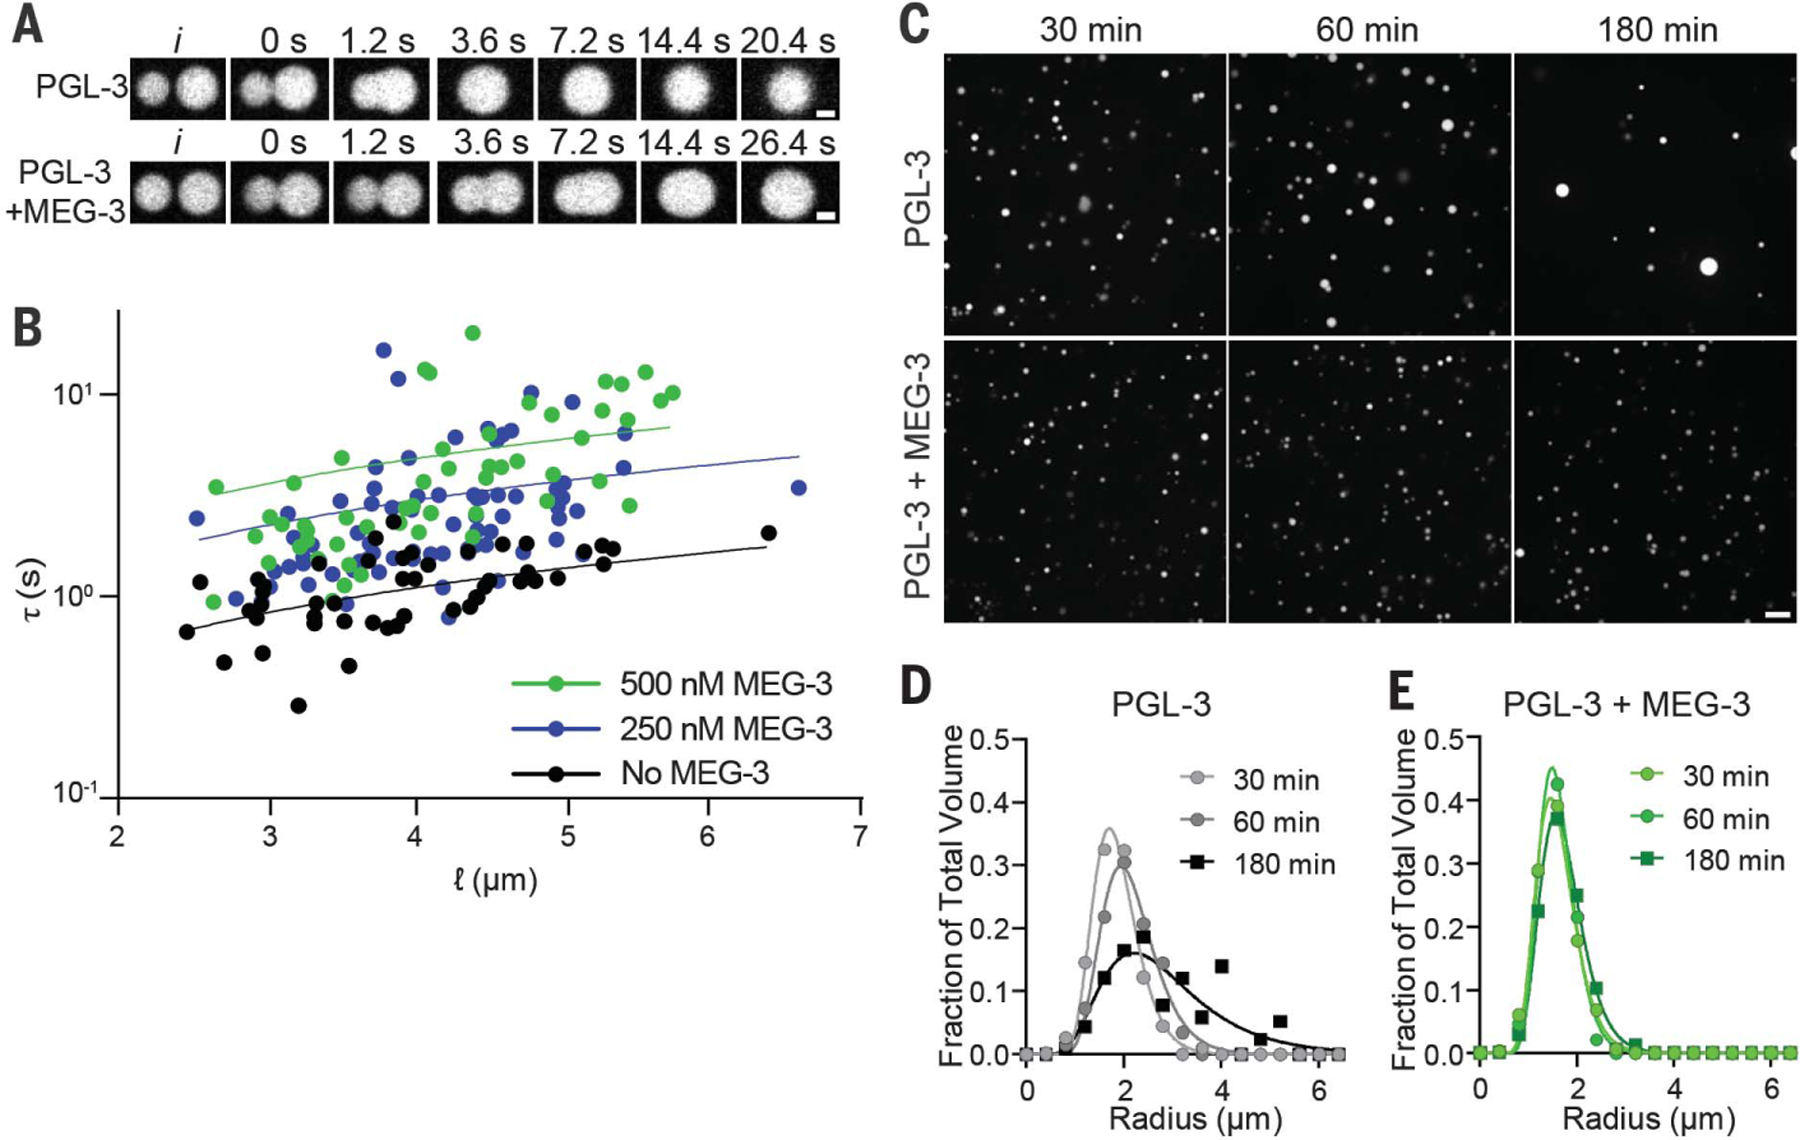
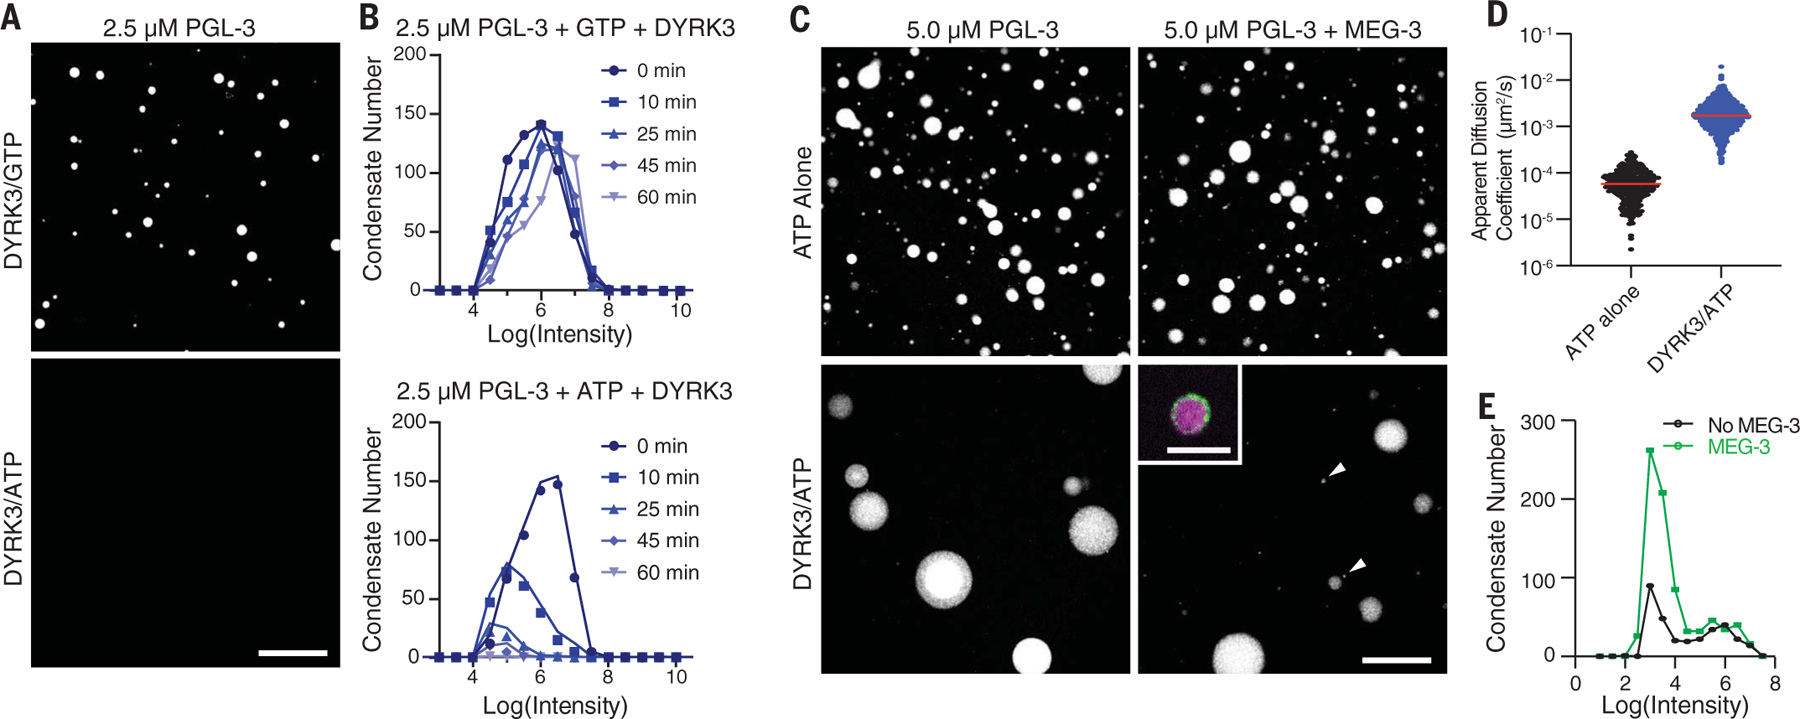
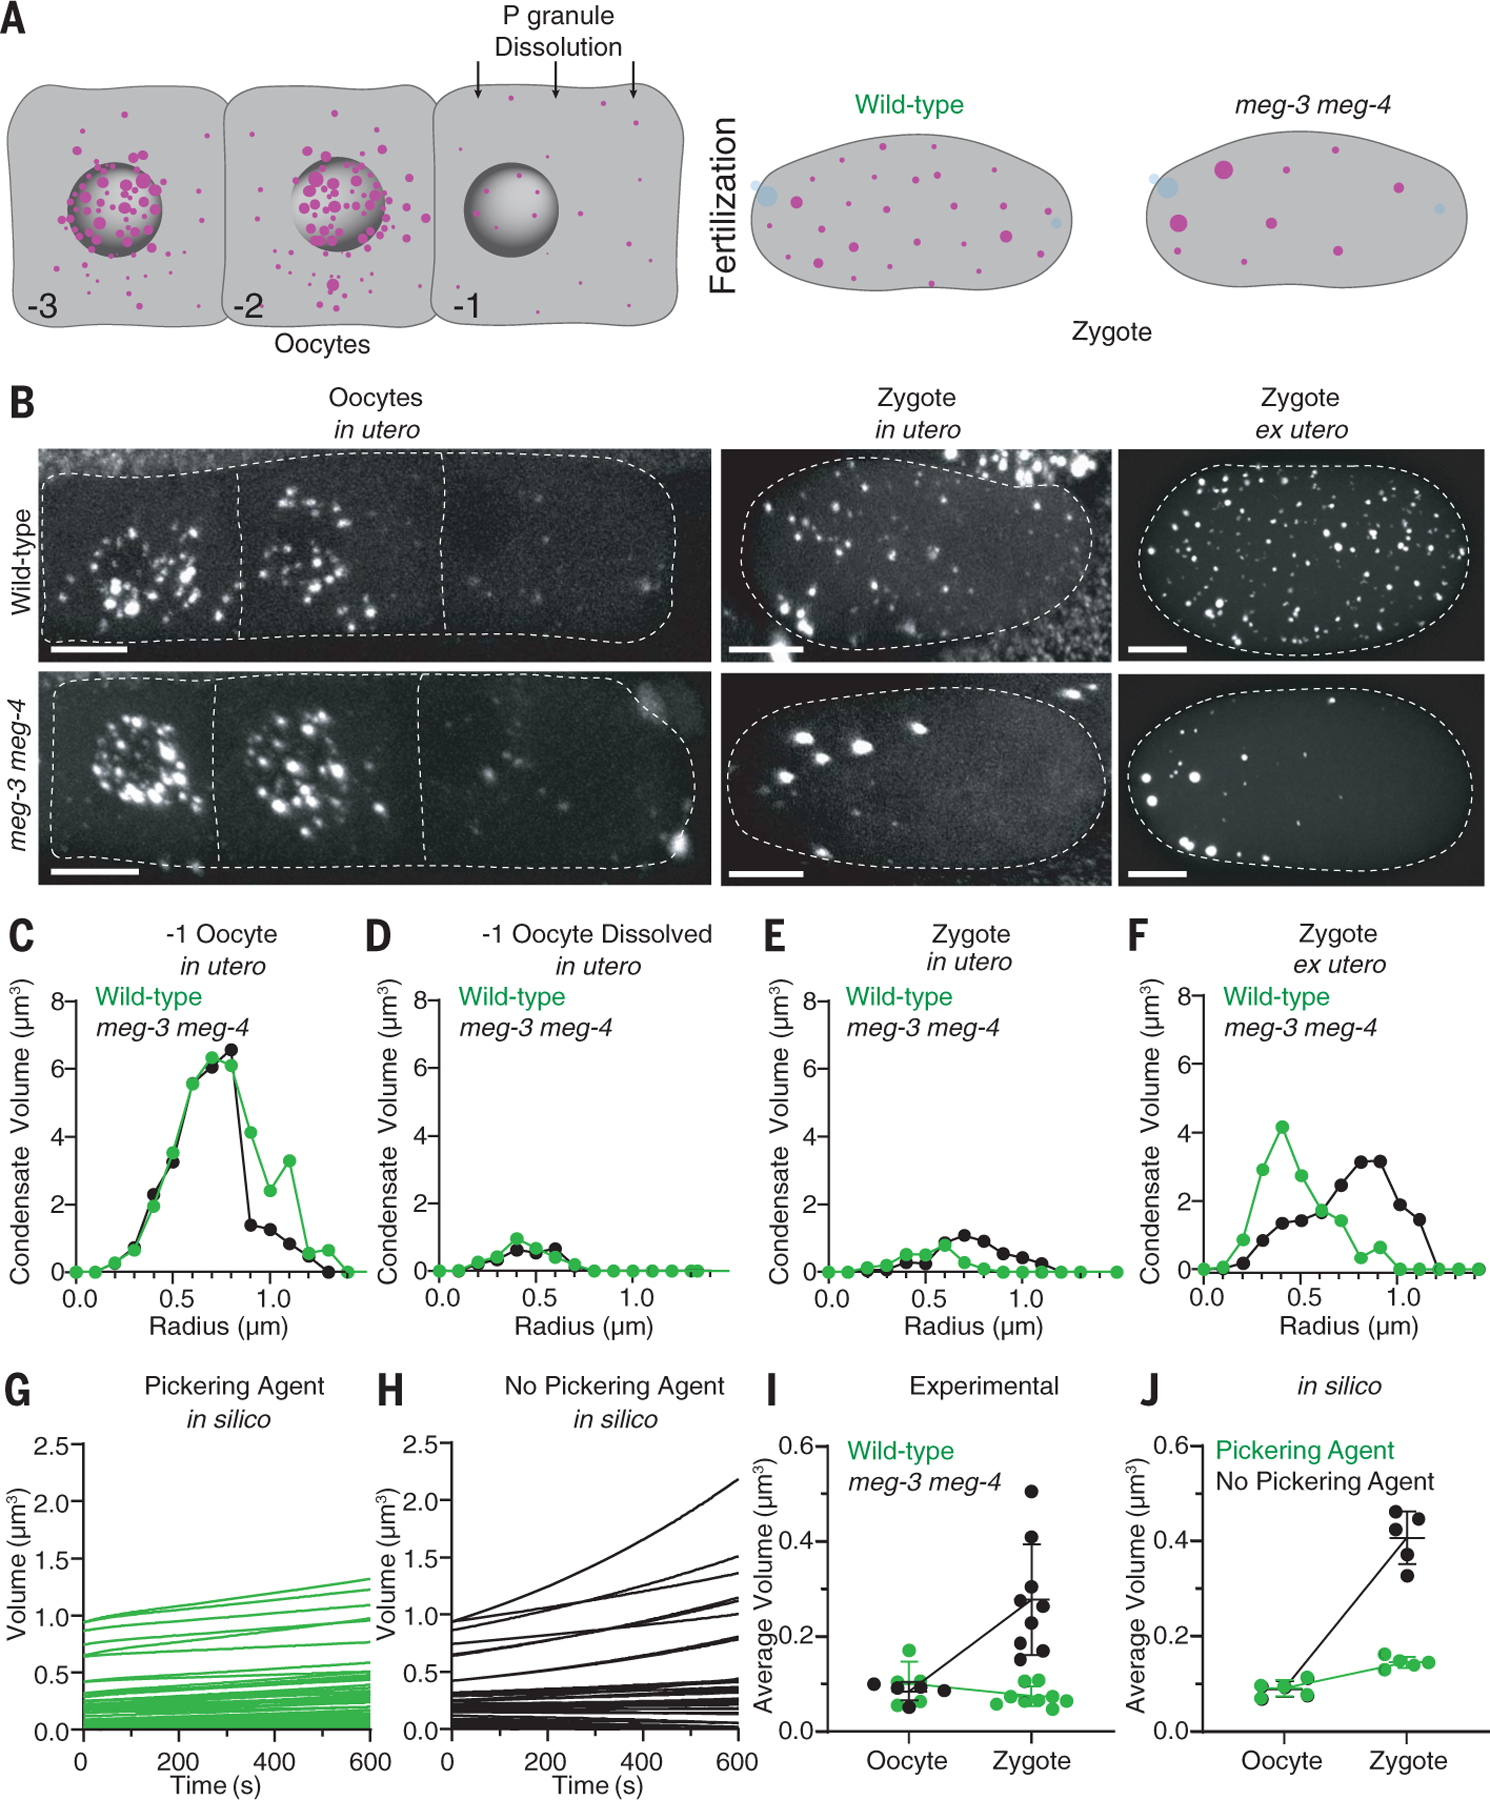
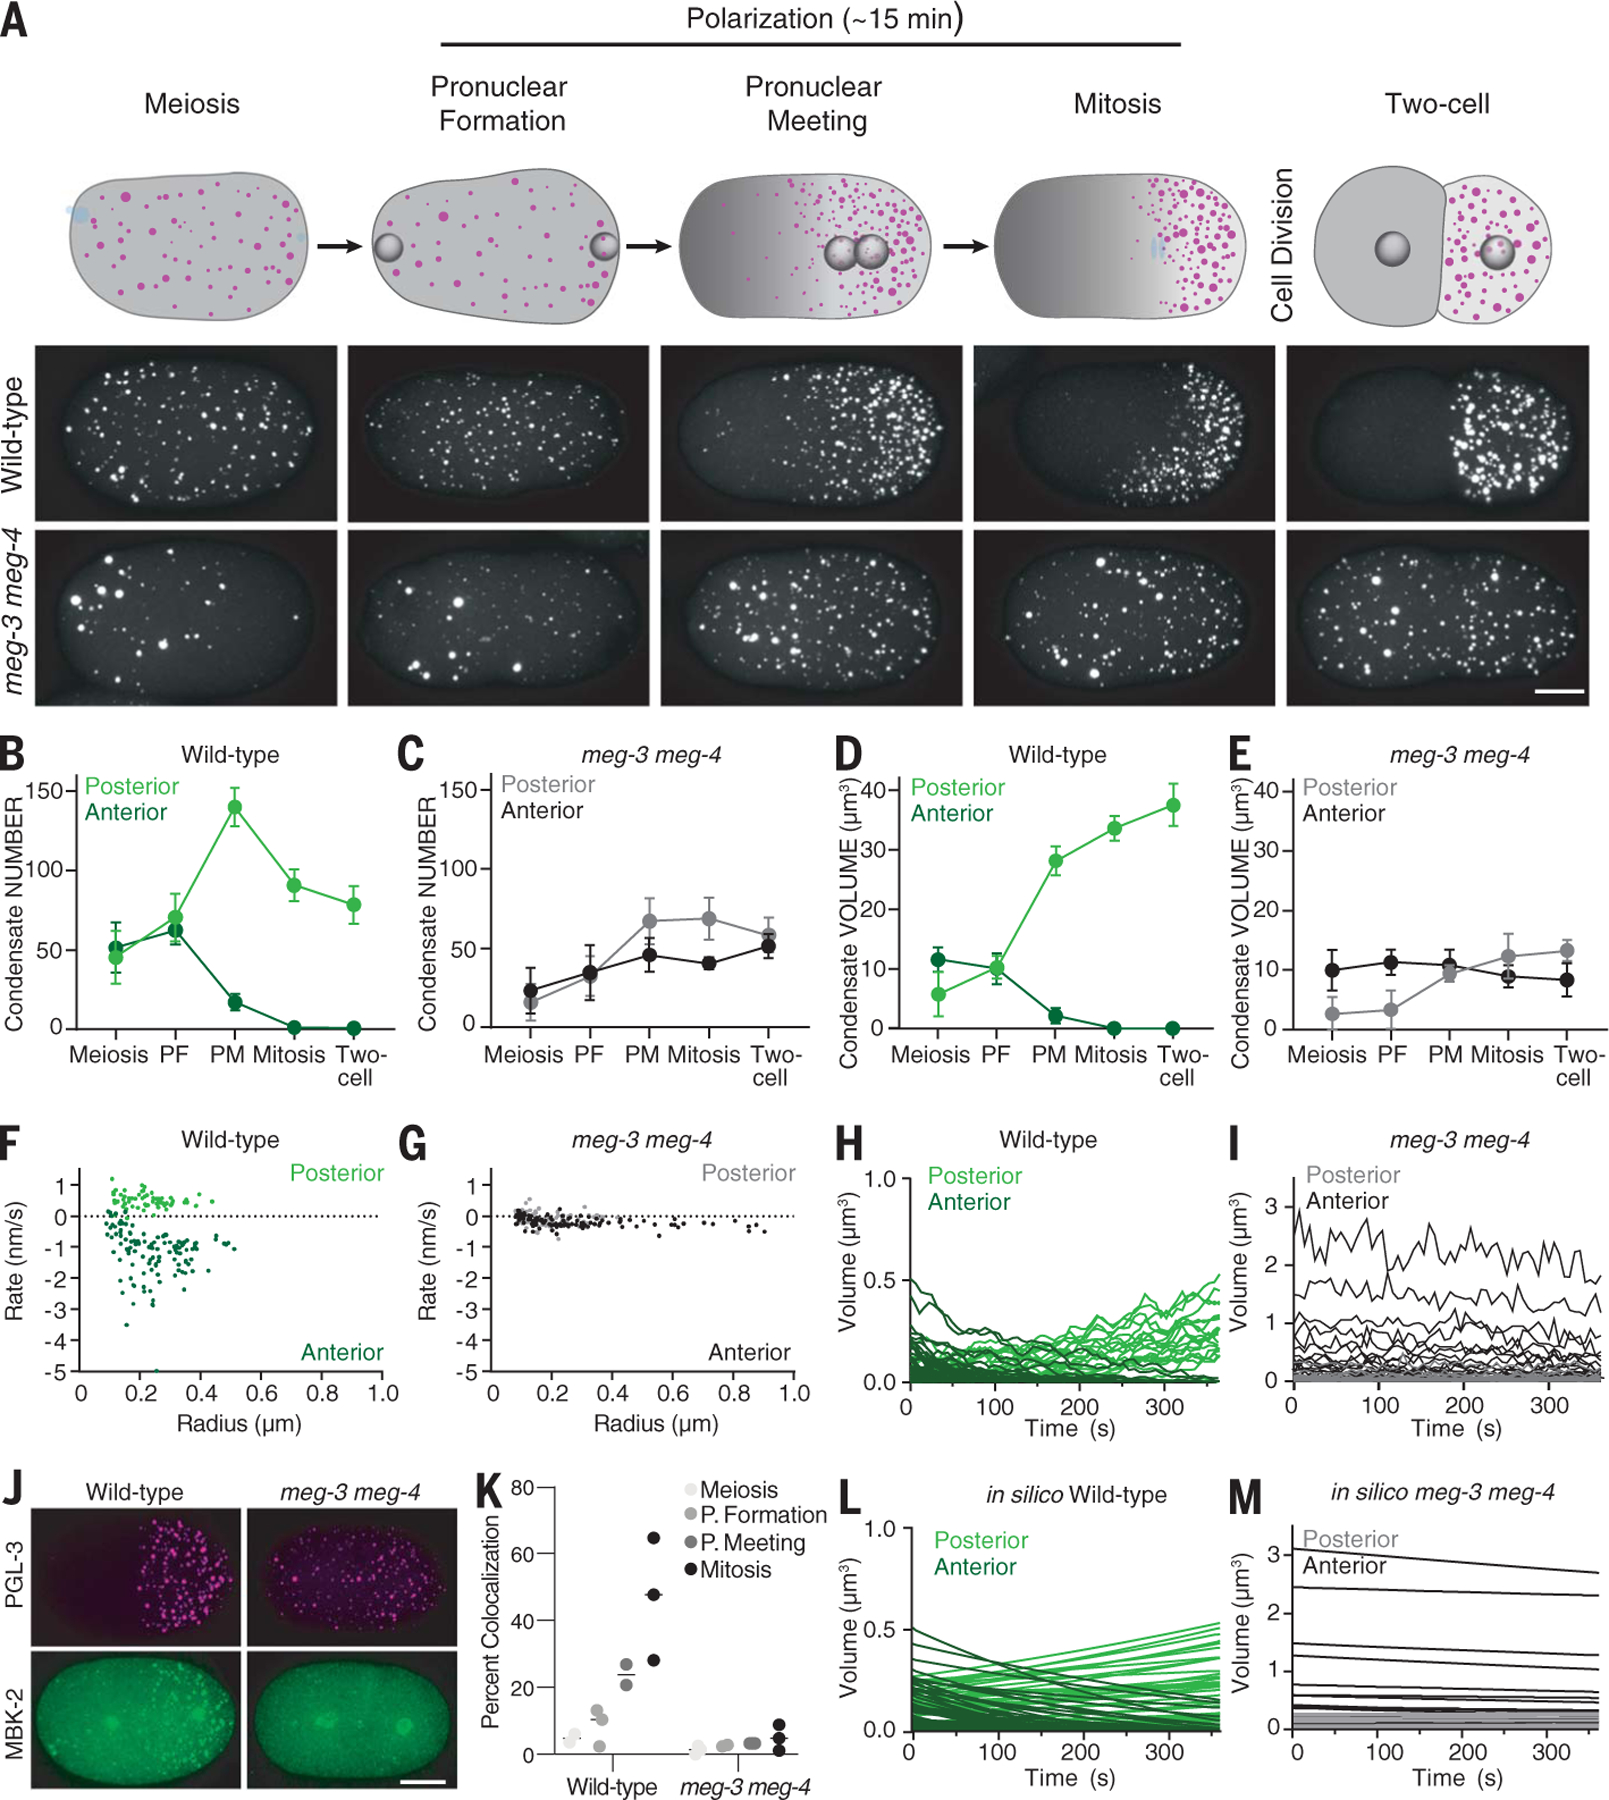
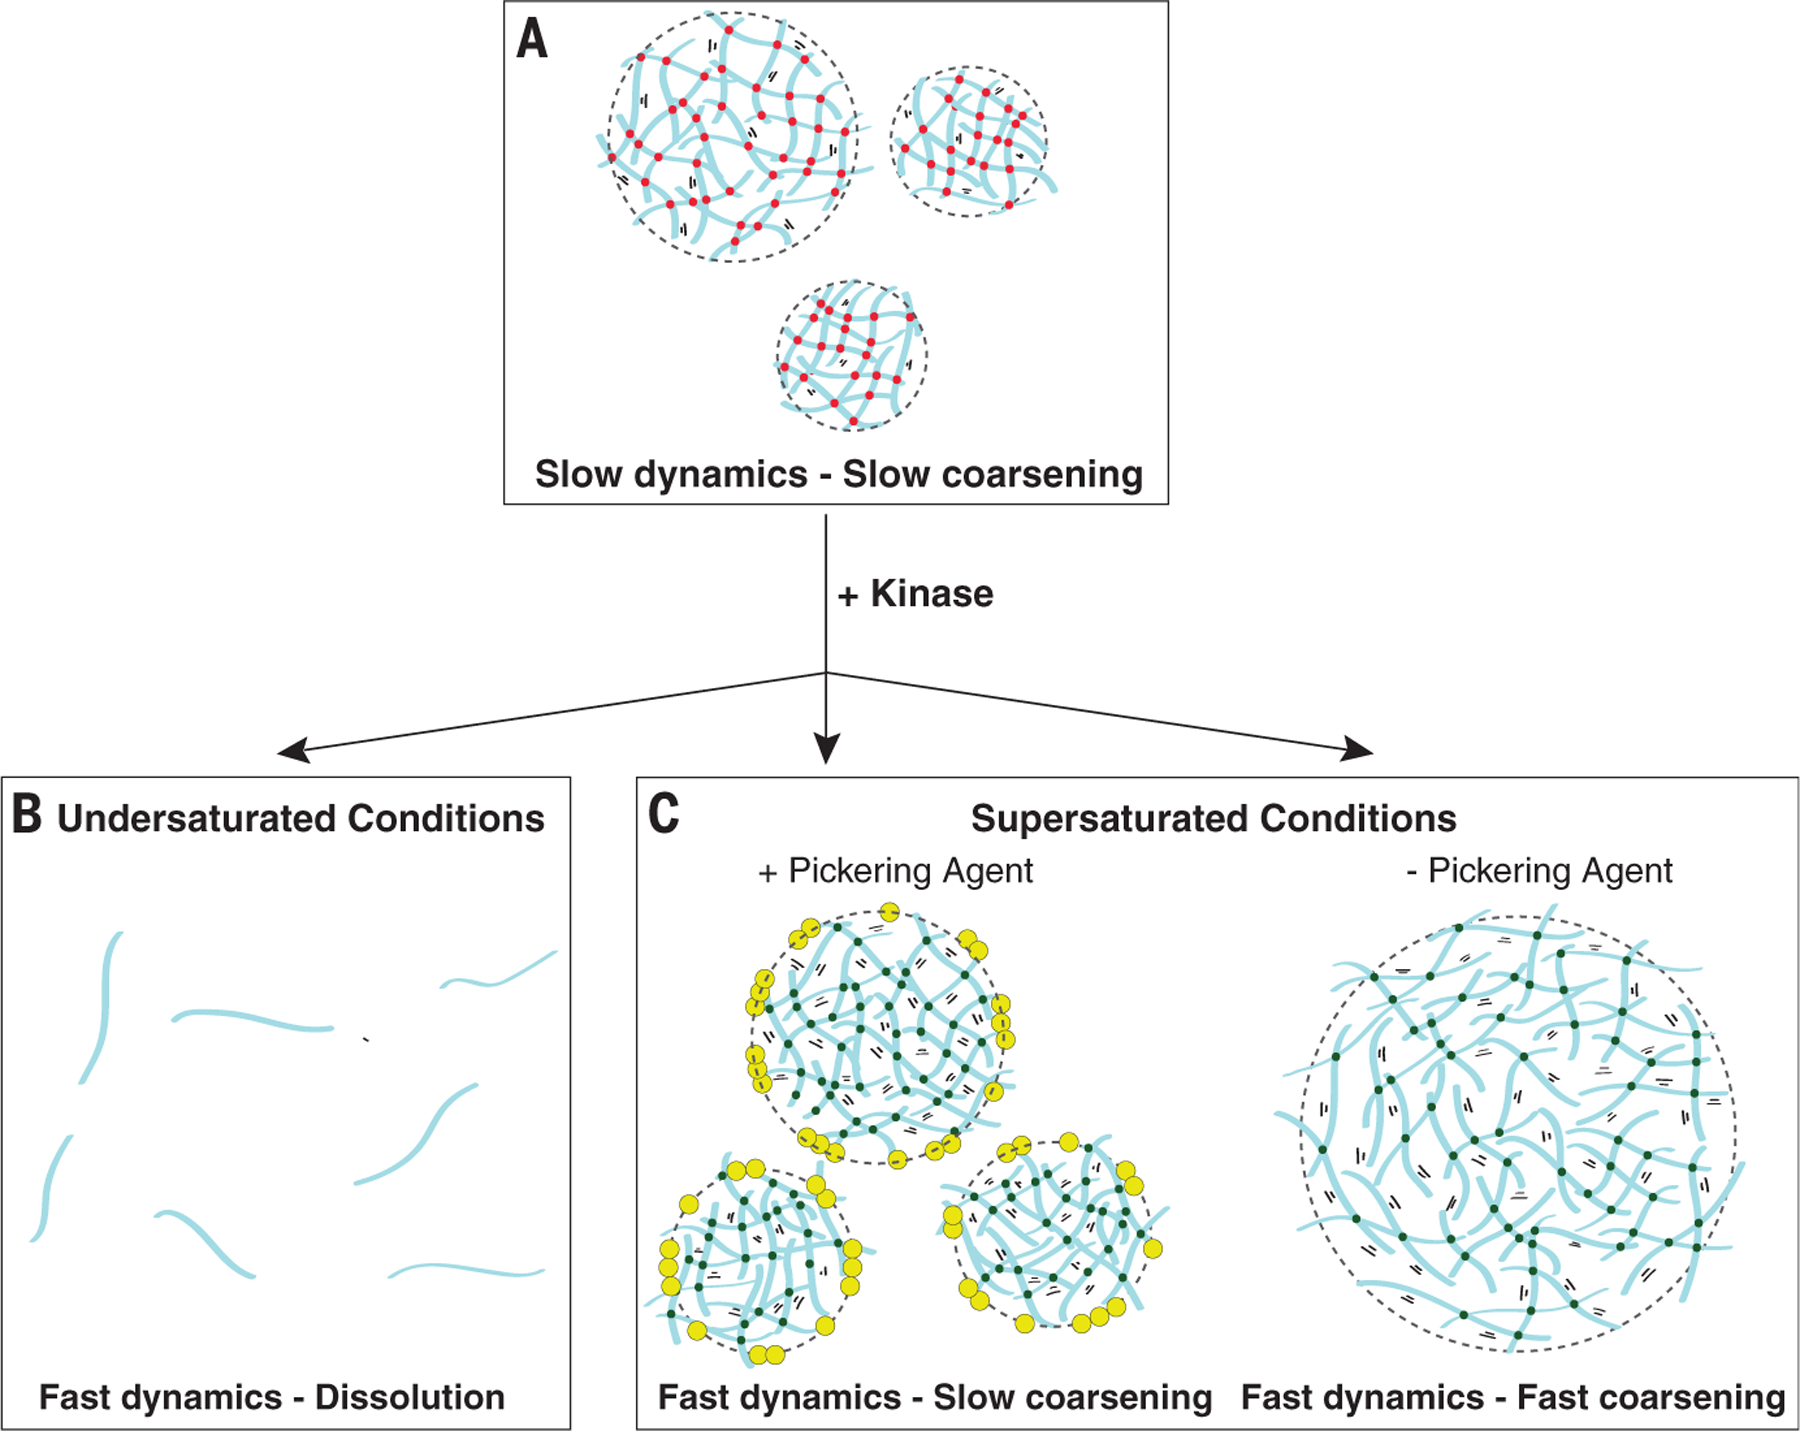
Biomolecular condensates are cellular compartments that can form by phase separation in the absence of limiting membranes. Studying the P granules of Caenorhabditis elegans, we find that condensate dynamics are regulated by protein clusters that adsorb to the condensate interface. Using in vitro reconstitution, live observations, and theory, we demonstrate that localized assembly of P granules is controlled by MEG-3, an intrinsically disordered protein that forms low dynamic assemblies on P granules. Following classic Pickering emulsion theory, MEG-3 clusters lower surface tension and slow down coarsening. During zygote polarization, MEG-3 recruits the DYRK family kinase MBK-2 to accelerate spatially regulated growth of the P granule emulsion. By tuning condensate-cytoplasm exchange, interfacial clusters regulate the structural integrity of biomolecular condensates, reminiscent of the role of lipid bilayers in membrane-bound organelles.


Conflict of interest statement

Competing interests: G.S. serves on the scientific advisory board of Dewpoint Therapeutics, Inc. A.W.F., A.P., and G.S. are inventors on provisional application #63/094,987 filed on 10/22/2020 held by Johns Hopkins University that covers the use of intrinsically disordered proteins as Pickering agents.

Figures

Fig. 1.
Fig. 1.. MEG-3 forms low-dynamic clusters that adsorb to the surface of PGL-3 condensates.
(A) Photomicrographs of a P granule in vivo labeled with PGL-3::mCherry and MEG-3::meGFP (GFP, green fluorescent protein) and of a P granule reconstituted in vitro with purified PGL-3 and MEG-3 trace-labeled with Dylight 488 and Alexa 647, respectively. Scale bars are 500 nm (in vivo, each scale bar applies to all images in the same row) and 3 µm (in vitro, scale bar applies to all images in the set). The top panels are a maximum projection of a z-stack through the granule. The middle panels are a single x-y plane through the middle of the same granule. The lower panels are a single z-x plane through the middle of the same granule. See fig. S1A for additional examples of P granules captured in vivo. (B) In vitro time-lapse series showing PGL-3 droplets trace-labeled with Dylight 488 wetting the surface of a glass slide with 3 µM PGL-3, with 80 ng/µl nos-2 RNA, and with or without 0.5 µM MEG-3. Average contact angles at 64 s are indicated. Scale bars are 1 µm, and each scale bar applies to all images in the same row. (C) Contact angles measured as in (B). Each dot represents a droplet, and red lines represent the mean. (D) In vivo time-lapse series showing single molecules (green) of PGL-3::Halo and MEG-3::Halo in P granules (magenta). Scale bars are 1 µm, and each scale bar applies to all images in the respective set. (E) Graph depicting the apparent diffusion coefficients of PGL-3::Halo and MEG-3::Halo molecules in P granules. Each dot represents one trajectory, and the red line represents the mean. (F) Graph depicting the dwell time of PGL-3::Halo and MEG-3::Halo molecules in P granules. Each dot represents one trajectory, and the red line represents the mean.
Fig. 2.
Fig. 2.. MEG-3 reduces the surface tension of PGL-3 condensates and prevents coarsening.
(A) Photomicrographs of PGL-3 droplets (3 µM PGL-3 and 80 ng/µl nos-2 RNA) coalescing with or without 0.5 µM MEG-3. (B) Relaxation time (τ) of fusing PGL-3 droplets (as above) is plotted versus length scale () with varying concentrations of MEG-3 as indicated. Each dot represents a single fusion event. The linear slope represents the inverse capillary velocity (η/γ). (C) Photomicrographs of a PGL-3 emulsion (max projections) at the indicated time points after assembly. Three micromolar PGL-3 and 80 ng/µl nos-2 RNA were incubated in condensation buffer in the presence or absence of 0.5 µM MEG-3. Scale bar is 5 µm and applies to all images in the set. (D and E) Histograms plotting the size distribution of PGL condensates assembled as in (C). Each data point indicates the fraction of total PGL-3 condensate volume represented by condensates binned by radius from 80 images [as in (C)] collected in four replicates. Lines were fit to a log normal distribution.
Fig. 3.
Fig. 3.. MEG-3 stabilizes PGL-3 condensates against kinase accelerated coarsening.
(A) Photomicrographs of a 2.5 µM PGL-3488 emulsion after a 60-min treatment with 100 nM DYRK3 kinase in the presence of GTP (top) or ATP (bottom). Scale bar is 50 µm and applies to both images. (B) Histograms of PGL condensates assembled as in (A) with GTP and DYRK3 or ATP and DYRK3 at indicated time points. Circles indicate the number of PGL-3 condensates binned by the log(intensity) of each condensate. Colors indicate the time after addition of DYRK3. (C) Photomicrographs of PGL-3 condensates (max projections) assembled with and without 70 nM MEG-3 and captured 60 min after addition of 100 µM ATP with and without 100 nM DYRK3. Arrows point to small PGL-3 and MEG-3 co-condensates. The inset is a high-resolution image with PGL-3 in magenta and MEG-3 in green (see fig. S4, F and G, for additional examples). Scale bars are 50 µm (applies to all images in the set) and 5 µm (inset). (D) Diffusion coefficients of 200-nm microspheres in PGL-3 condensates (5 µM PGL-3 and 100 µM ATP) with and without 100 nM DYRK3. Each dot represents a single microsphere trajectory. The red line represents the mean. (E) Histograms of PGL-3 condensates assembled with and without 70 nM MEG-3 and incubated for 60 min in 100 µM ATP with 100 nM DYRK3. Circles indicate the number of PGL-3 condensates binned by the log (intensity) of each condensate captured from 17 images. See fig. S4, D and E, for additional MEG-3 concentrations and an additional time point.
Fig. 4.
Fig. 4.. MEG-3 and MEG-4 stabilize P granules against coarsening during the oocyte-to-zygote transition.
(A) Schematics depicting the dissolution of P granules (magenta) during the transition from oocyte to fertilized zygote. The numbers indicate the relative position of each oocyte in the germline, and blue represents DNA. (B) Photomicrographs of wild-type and meg-3 meg-4 oocytes and zygotes expressing PGL-3::mCherry (white). Photomicrographs were captured in live adult hermaphrodites (in utero) or after dissection out of the uterus (ex utero). Representative photomicrographs are max projections corresponding to ~20% of oocyte volume and ~80% of zygote volume. The anterior (left) bias for PGL condensates in meg-3 meg-4 zygotes correlates with anterior displacement of the oocyte nucleus (and associated P granules) that occurs immediately before fertilization. The white dashed lines indicate the boundary of each oocyte or zygote. Scale bars are 10 µm. (C to F) Histograms of PGL condensate volumes measured from images captured as in (B) representing 100% of oocyte and zygote volumes. Circles indicate the volume of individual PGL-3 in condensates binned by condensate radius in wild-type (green) and meg-3 meg-4 (black) oocytes and zygotes. Volumes are higher in (F) than in (E) owing to higher detection sensitivity ex utero. (G and H) Graphs showing the evolution of individual PGL condensates in a 10-min period starting after dissolution in wild-type and meg-3 meg-4 oocytes and zygotes under simulated conditions. Each line represents the evolution of a single condensate over time. (I and J) Graphs showing the average volume of individual PGL condensates in oocytes and zygotes under experimental and simulated conditions. For (I), each dot corresponds to an oocyte [same dataset as shown in (D)] or zygote [same data set as shown in (F)] of the indicated genotypes. For (J), each dot corresponds to one simulation. Simulations were run in the presence or absence of the Pickering agent. Horizontal and vertical lines represent the mean SD.
Fig. 5.
Fig. 5.. MEG-3 and MEG-4 drive asymmetric growth of the P granule emulsion during polarization.
(A) Top row: Cartoons depicting PGL-3 condensates (magenta) and MEX-5 (gray) at different stages during the transition from unpolarized to polarized zygote. Blue represents DNA. Bottom two rows: Photomicrographs of wild-type and meg-3 meg-4 zygotes (ex utero) expressing PGL-3::mCherry (white) and matching the stages shown in the cartoons above. Scale bar is 10 µm and applies to all images. (B to E) Graphs showing the total number [(B) and (C)] and total volume [(D) and (E)] of PGL-3::mCherry condensates in the posterior (light color) or anterior (dark color) half of wild-type and meg-3 meg-4 zygotes calculated from the photomicrographs shown in (A). Circles represent the average from five zygotes, and error bars represent the SD. PF, pronuclear formation; PM, pronuclear meeting. (F and G) Graphs showing the rate of change in radius of PGL-3::mCherry condensates in wild-type and meg-3 meg-4 zygotes calculated from traces shown in (H) and (I). (H and I) Graphs showing the evolution of individual PGL-3::mCherry condensates in anterior and posterior regions during polarization in wild-type and meg-3 meg-4 zygotes. Traces begin at pronuclear formation and end just before pronuclear meeting. (J) Photomicrographs of fixed zygotes (mitosis) of indicated genotypes showing the distribution of MBK-2::OLLAS (green) and PGL-3::mCherry (magenta). Note that, in addition to P granules, MBK-2 localizes to centrosomes. Scale bar is 10 µm and applies to all images in the set. (K) Graph showing the percentage of PGL-3:mCherry condensates colocalized with MBK-2::OLLAS puncta in wild-type or meg-3 meg-4 zygotes at the indicated developmental stages. Each circle represents one zygote (>50 puncta), and each line represents the mean. (L and M) Graphs showing the evolution of individual anterior (dark color) and posterior (light color) PGL-3 condensates under conditions simulating “wild-type” (starting condensate sizes as in wild-type zygotes, high conversion rates, and Pickering agent) and “meg-3 meg-4” (starting condensate sizes as in meg-3 meg-4 zygotes, low conversion rates, and no Pickering agent). Compare with experimental data in (H) and (I).
Fig. 6.
Fig. 6.. Pickering agents stabilize dynamic emulsions against kinase-accelerated coarsening.
Schematics showing an idealized emulsion of a self-interacting polymer (blue). (A) In untreated condensates, polymer-polymer binding and unbinding events are slow (red dots), allowing the emulsion to persist with minimal coarsening over short time scales. (B and C) Phosphorylation by kinase increases solubility and accelerates internal dynamics [green dots in (C)]. In undersaturated conditions (B), kinase-accelerated dynamics cause the condensates to dissolve, as is observed in the anterior of wild-type polarized zygotes. In saturated conditions (C), kinase-accelerated dynamics allow the condensates to rapidly grow by allowing new molecules from the dilute phase to enter the condensates. In the presence of the Pickering agent (yellow), the condensates are stabilized against coarsening, as observed in the posterior of wild-type polarized zygotes. In the absence of the Pickering agent, the condensates coarsen, as observed in meg-3 meg-4 mutants during the oocyte-to-embryo transition. During polarization, MEG-3 and MEG-4 function both as Pickering agents and recruiters of the kinase MBK-2. In meg-3 meg-4 zygotes undergoing polarization, PGL condensates are maintained throughout the cytoplasm with minimal coarsening, because MBK-2 kinase is not recruited to the condensates and PGL dynamics remain slow, as in (A).

Comment in

References

    1. Hyman AA, Weber CA, Jülicher F., Annu. Rev. Cell Dev. Biol 30, 39–58 (2014). - PubMed
    1. Jawerth L et al., Science 370, 1317–1323 (2020). - PubMed
    1. Boeynaems S et al., Trends Cell Biol 28, 420–435 (2018). - PMC - PubMed
    1. Freeman Rosenzweig ES et al., Cell 171, 148–162.e19 (2017). - PMC - PubMed
    1. Feric M, Brangwynne CP, Nat. Cell Biol 15, 1253–1259 (2013). - PMC - PubMed

Publication types

MeSH terms

Substances