. 2021 Sep 8;13(610):eabd4811.
doi: 10.1126/scitranslmed.abd4811. Epub 2021 Sep 8.

Chromosomal instability sensitizes patient breast tumors to multipolar divisions induced by paclitaxel

Affiliations

Chromosomal instability sensitizes patient breast tumors to multipolar divisions induced by paclitaxel

Christina M Scribano et al. Sci Transl Med. .

Abstract

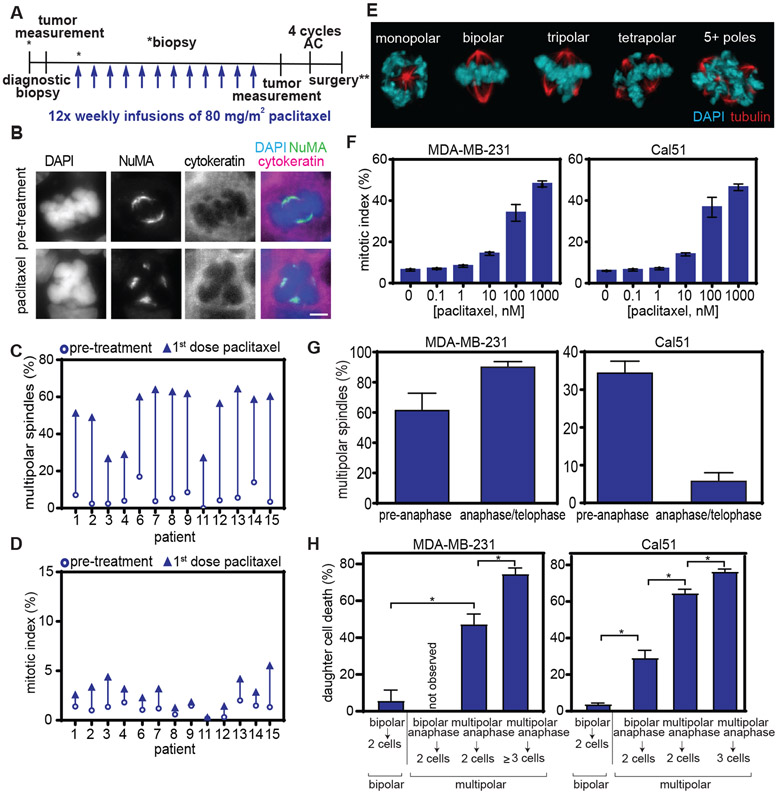
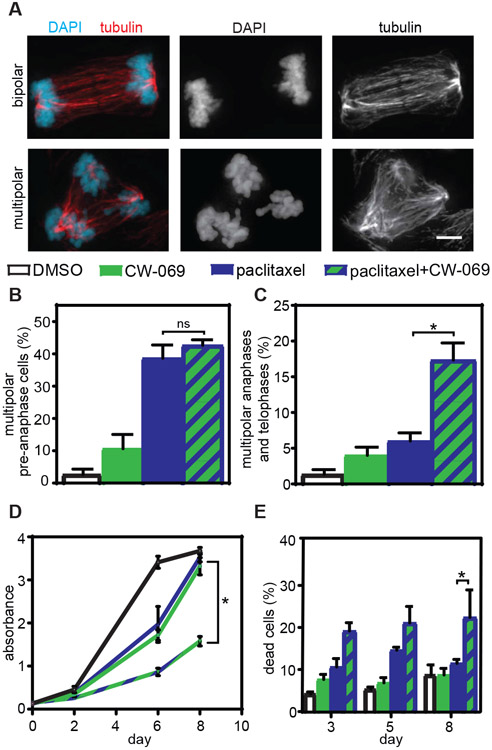
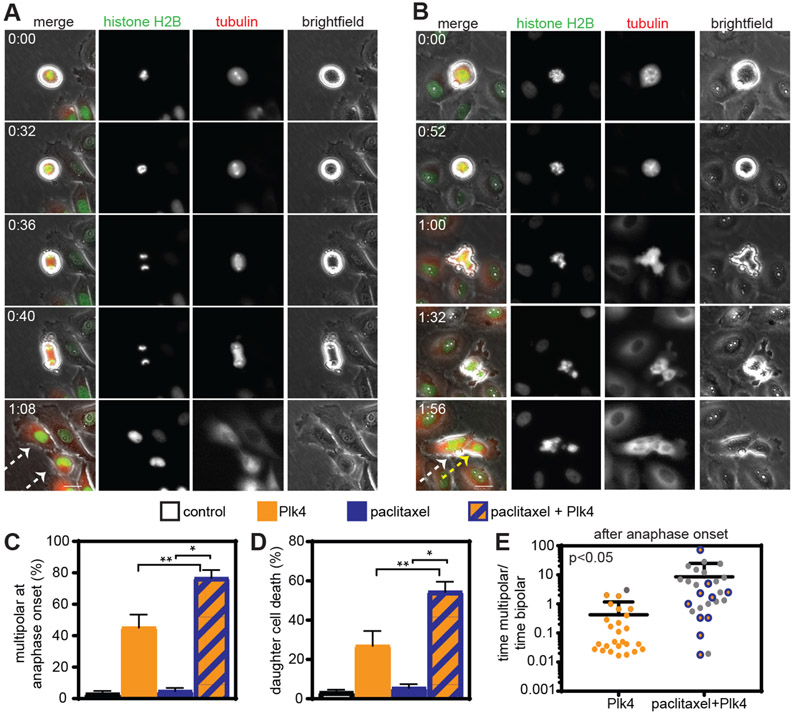
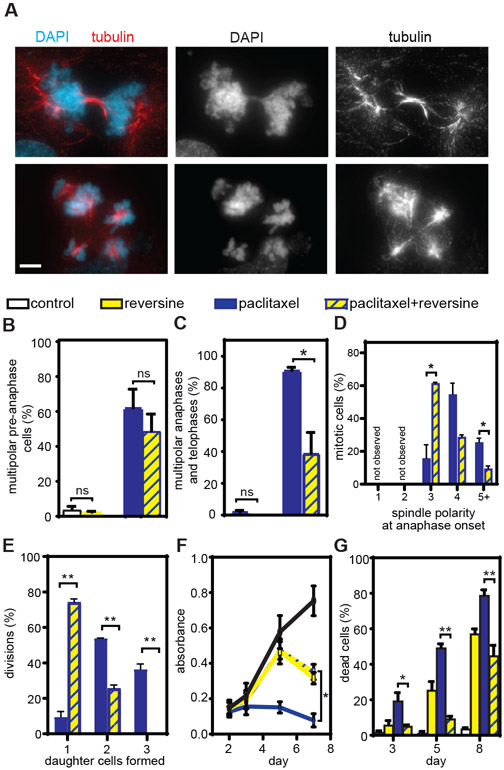
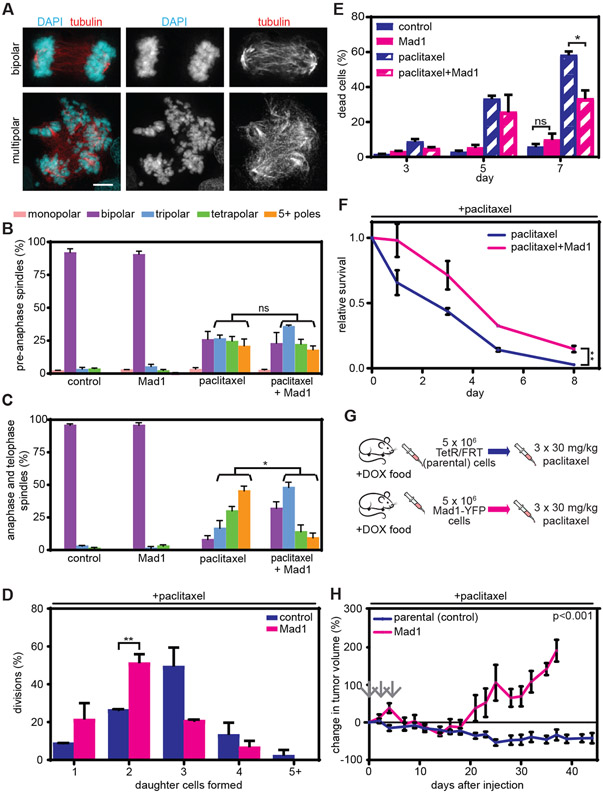
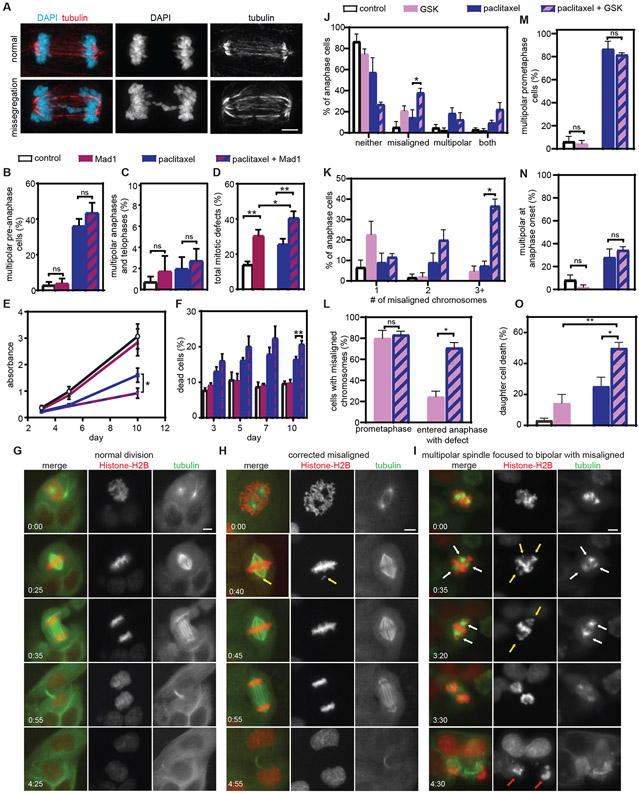
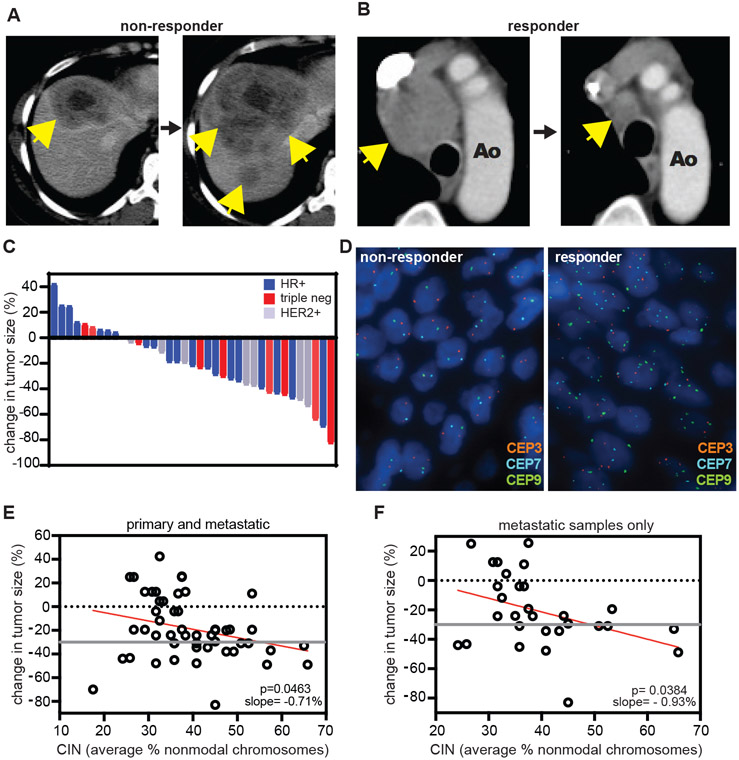
Paclitaxel (Taxol) is a cornerstone of cancer treatment. However, its mechanism of cytotoxicity is incompletely understood and not all patients benefit from treatment. We show that patients with breast cancer did not accumulate sufficient intratumoral paclitaxel to induce mitotic arrest in tumor cells. Instead, clinically relevant concentrations induced multipolar mitotic spindle formation. However, the extent of early multipolarity did not predict patient response. Whereas multipolar divisions frequently led to cell death, multipolar spindles focused into bipolar spindles before division at variable frequency, and maintaining multipolarity throughout mitosis was critical to induce the high rates of chromosomal instability necessary for paclitaxel to elicit cell death. Increasing multipolar divisions in paclitaxel resulted in improved cytotoxicity. Conversely, decreasing paclitaxel-induced multipolar divisions reduced paclitaxel efficacy. Moreover, we found that preexisting chromosomal instability sensitized breast cancer cells to paclitaxel. Both genetic and pharmacological methods of inducing chromosomal instability were sufficient to increase paclitaxel efficacy. In patients, the amount of pretreatment chromosomal instability directly correlated with taxane response in metastatic breast cancer such that patients with a higher rate of preexisting chromosomal instability showed improved response to taxanes. Together, these results support the use of baseline rates of chromosomal instability as a predictive biomarker for paclitaxel response. Furthermore, they suggest that agents that increase chromosomal instability or maintain multipolar spindles throughout mitosis will improve the clinical utility of paclitaxel.


Figures

Fig. 1.
Fig. 1.. Clinically relevant concentrations of paclitaxel cause multipolar spindles without mitotic arrest in breast cancer patients and cells.
A) Schematic showing trial design. Research biopsies were obtained prior to paclitaxel treatment and 20 hours after the first dose of paclitaxel. AC = Adriamycin and cyclophosphamide. **indicates that surgery could occur before or after AC, per physician recommendation. B) Representative images of bipolar (top) and multipolar (bottom) mitotic cells in patient tumors before and after paclitaxel treatment. Mitotic cells were identified based on DNA morphology and the presence of a mitotic spindle, labeled by Nuclear Mitotic Apparatus protein (NuMA), which localizes to spindle poles. Pan-cytokeratin was used to discriminate between breast epithelial (tumor) cells and stroma. Scale bar, 5 μm. C-D) Mitotic effects of 80 mg/m2 paclitaxel treatment in primary breast cancer patients. Quantification of (C) multipolar mitotic spindles, defined as containing >2 NuMA foci, and (D) mitotic index before (open circle) and after (arrowhead; the direction indicates increase or decrease) paclitaxel treatment. D, n≥500 cells. For assessment of multipolar spindles in C, mitotic cell sample sizes for patients are 113, 41, 100, 101, 106, 79, 75, 35, 6, 24, 106, 86, and 116 cells, respectively, pre-treatment and 109, 100, 104, 103, 108, 103, 27, 63, 11, 30, 110, 102 and 101 cells, respectively, after treatment. Samples from patients 5 and 10 could not be analyzed due to insufficient tumor tissue collected by biopsy and withdrawal of consent, respectively. E) Images of mitotic spindles with the indicated number of poles in MDA-MB-231 cells after treatment with 10 nM paclitaxel. F) Quantification of mean mitotic index +/− SEM. n≥300 cells from each of 3 independent experiments. G) Quantification of multipolar spindles (mean +/− SD) in Cal51 and MDA-MB-231 cells prior to anaphase onset (n≥100 cells in each of 3 replicates) and in anaphase and telophase (n≥50 cells in each of 3 replicates) in response to 10 nM paclitaxel. H) Quantification of percent daughter cell death from long term timelapse microscopy. n≥50 daughter cells in each of 2 replicates. *P<0.05.
Fig. 2:
Fig. 2:. Elevating the incidence of multipolar divisions in paclitaxel via HSET inhibition increases cytotoxicity.
A) Images of bipolar (top) and multipolar (bottom) anaphase cells. Scale bar, 5 μm. B-C) Percent of multipolar pre-anaphase, and anaphase/telophase spindles in Cal51 cells following treatment with paclitaxel and the HSET inhibitor CW-069. Mean percentage +/− SEM of mitotic cells with multipolar spindles prior to anaphase (B, n≥ 100 cells in each of 3 replicates) and after anaphase onset (C, n≥ 50 anaphase and telophase cells in each of 3 biological replicates). D-E) MTT absorbance and percentage of dead cells after treatment of Cal51 cells with paclitaxel and CW-069. D) Mean absorbance +/− SEM from MTT viability assays with 10 nM paclitaxel and 50 μM CW-069. n=3. E) Mean percentage +/− SEM of dead cells measured by trypan blue exclusion assay. n=3. *P<0.05. ns=not significant.
Fig. 3:
Fig. 3:. Increasing the incidence of multipolar divisions through Plk4-induced centriole amplification increases paclitaxel cytotoxicity.
72-hour timelapse analysis of Plk4 inducible MCF10A cells expressing histone H2B-mNeonGreen and mScarlet-tubulin. A-B) Still images of (A) control cell undergoing bipolar division which produces two viable daughter cells (see Movie S4) and (B) Plk4 inducible cell undergoing a multipolar division in the presence of paclitaxel with eventual pole focusing, resulting in the formation of two daughter cells, one of which subsequently dies (see Movie S5). Arrows indicate daughter cells formed after division. White arrows indicate viable daughter cells. Yellow arrow indicates daughter cell that dies after division. Time is indicated in hours:minutes. Scale bar, 5 μm. C-D) Quantification of cells observed by timelapse microscopy. C) Mean percentage +/− SEM of cells with multipolar spindles at anaphase onset. n=91 control, n=86 paclitaxel, n=95 +doxycycline (Plk4), and n=83 paclitaxel+doxycycline (Plk4) cells from four independent replicates. D) Mean percentage of cell death +/− SEM during timelapse. n=167 control, n=111 paclitaxel, n=176 +doxycycline (Plk4), and n=146 paclitaxel+doxycycline (Plk4) daughter cells from four independent replicates. E) Ratio of time spent after anaphase onset with a multipolar versus bipolar spindle. Each dot represents a single cell. Gray dots indicate daughter cells that died during the imaging period. *P<0.05. **P<0.001.
Fig. 4:
Fig. 4:. Reducing multipolar divisions by Mps1 inhibition decreases the cytotoxicity of paclitaxel.
A) Representative images of bipolar (top) and multipolar (bottom) telophase cells. Scale bar, 5 μm. B) Percentage (mean +/− SD) of pre-anaphase cells with multipolar spindles in MDA-MB-231 cells upon Mps1 inhibition and paclitaxel tretment. n≥100 cells in each of 3 independent replicates. C) Mean percentage +/− SEM of anaphase and telophase cells with multipolar spindles in MDA-MB-231 cells upon Mps1 inhibition and paclitaxel treatment. n≥50 anaphase and telophase cells from each of 3 independent replicates. D-E) Quantification of 24 hour timelapse analysis of MDA-MB-231 cells stably expressing RFP-histone H2B and GFP-tubulin at 3 minute intervals. (D) Spindle polarity at anaphase onset. Data represent mean +/− SEM of two movies. n=65 and 68 cells in paclitaxel and paclitaxel+reversine conditions, respectively. (E). Number of daughter cells formed following mitosis in MDA-MB-231 cells after paclitaxel and reversine treatment. Data represent mean +/− SEM of three movies. n=101 and n=94 divisions in paclitaxel and paclitaxel+reversine conditions, respectively. F) Mean absorbance +/− SEM from MTT metabolic viability assay. n=3. G) Cell death (mean +/− SEM) in MDA-MB-231 cells following treatment with reversine and paclitaxel, as measured by trypan blue exclusion assay. n=4. *P<0.05. **P<0.001. ns=not significant.
Fig. 5:
Fig. 5:. Reducing multipolar divisions by upregulating Mad1 in MDA-MB-231 cells decreases the cytotoxicity of paclitaxel in vitro and in vivo.
A) Representative images of bipolar (top) and multipolar (bottom) anaphase cells. Scale bar, 5 μm. B-C) Cells were treated with vehicle, tet to induce Mad1, 10 nM paclitaxel, or tet and paclitaxel. B) Mean +/− SEM of the number of spindle poles in pre-anaphase cells. n≥100 cells from each of 3 replicates. C) Mean +/− SEM of spindle pole number in anaphase and telophase cells. n≥50 anaphase and telophase cells in each of 3 independent experiments. D) Quantification of the number of daughter cells formed after mitotic division in 10 nM paclitaxel, with and without Mad1 upregulation, assessed by bright-field timelapse microscopy. Data represent the mean +/− SD of two movies. n=65 divisions for paclitaxel alone and n=83 divisions for paclitaxel + Mad1 upregulation. E) Mean +/− SEM of cell death, as assessed by trypan blue exclusion assay. n=4. F) Relative MTT survival assay (mean +/− SD) over 8 days. n=3. G) Schematic of orthotopic experiment. Mice injected with parental or Mad1-YFP inducible MDA-MB-231 cells were treated with 30 mg/kg paclitaxel (gray arrows) every other day for five days once tumors reached a minimum volume of 75 mm3. H) Percent change (mean +/− SEM) in tumor volume after paclitaxel treatment (arrows). n=6 tumors per treatment condition. *=p<0.05. **=p<0.001. ns=not significant.
Fig. 6:
Fig. 6:. Increasing chromosomal instability sensitizes Cal51 cells to paclitaxel in vitro.
A) Representative images of a normal bipolar anaphase (top) and a bipolar anaphase with evidence of chromosome missegregation (lagging chromosome, bottom). Scale bar, 5 μm. B-F) Cells were treated with vehicle, tet to induce Mad1, 10 nM paclitaxel, or tet and paclitaxel. Mean percentage +/− SEM of multipolar spindles prior to anaphase (B, n≥100 cells in each of three biological replicates) and after anaphase onset (C, n≥ 50 anaphase and telophase cells in each of three biological replicates). D) Quantification of the incidence of total mitotic defects observed by fixed analysis. n≥50 anaphase and telophase cells in each of five biological replicates. E) MTT survival assay. Data represent the mean +/− SEM from three biological replicates. F) Cell death (mean +/− SEM), measured using trypan blue exclusion assays. n=3. G-O) Cal51 cells treated with vehicle, CENP-E inhibitor GSK923295, 5 nM paclitaxel, or both. G-I) Still images from timelapse analysis of Cal51 cells with fluorescent chromosomes and microtubules due to endogenous tagging of histone H2B with mScarlet and α-tubulin with mNeonGreen, respectively. Time is indicated in hours:minutes. Scale bar, 5 μm. G) Normal bipolar division. H) Division in GSK923295, in which a misaligned chromosome, indicated by a yellow arrow, aligns prior to anaphase onset. I) Division in combination of 5 nM paclitaxel and 50 nM GSK923295 in which the prometaphase spindle contains multiple spindle poles (indicated by white arrows), focuses into a bipolar spindle prior to anaphase onset (time 3:20) and enters anaphase in the presence of multiple misaligned chromosomes (yellow arrows). Both daughter cells die by 4:30 (red arrows). J-N) Quantitation of mitotic defects at anaphase onset (J), number of misaligned chromosomes at anaphase onset (K), percentage of cells with misaligned chromosomes in prometaphase and at anaphase onset (L), and spindle polarity before (M) and at (N) anaphase onset. O) Percent daughter cell death. Data represent the mean (+/− SEM) from 3 48-hour movies. *P<0.05. **P<0.001. ns=not significant.
Fig. 7:
Fig. 7:. Pre-treatment chromosomal instability directly correlates with taxane response in metastatic breast cancer patients.
A-B) Representative patient tumor responses to paclitaxel. Yellow arrows indicate tumors. A) Progression of a hormone receptor-positive liver metastasis. B) Marked improvement of a mediastinal lymph node. C) Waterfall plot showing treatment response to taxane therapy in a cohort of 37 metastatic breast cancer patients treated with singleagent taxane. Color indicates breast cancer receptor subtype; hormone receptor positive (HR+), triple negative (triple neg), or human epithelial growth factor receptor 2 positive (HER2+). D) Representative FISH images showing probes for centromeres 3, 7, and 9. The average percent non-modal chromosomes was used as a measure of chromosomal instability. E-F) Correlation of pre-treatment chromosomal instability with response to taxane treatment. Response cutoff was determined by RECIST 1.1 criteria (26), and is indicated by a gray line. E) Data from primary as well as metastatic tumor (51 total) sites. Slope = −0.71%, meaning per percent increase in non-modal chromosomes, tumor size was reduced by an estimated 0.71%. F) Data from 29 exclusively metastatic sites. Slope = −0.93%.

References

    1. Huang TC, Campbell TC, Comparison of weekly versus every 3 weeks paclitaxel in the treatment of advanced solid tumors: a meta-analysis. Cancer Treat Rev 38, 613–617 (2012). - PubMed
    1. Crown J, O'Leary M, Ooi WS, Docetaxel and paclitaxel in the treatment of breast cancer: a review of clinical experience. Oncologist 9 Suppl 2, 24–32 (2004). - PubMed
    1. Zaheed M, Wilcken N, Willson ML, O'Connell DL, Goodwin A, Sequencing of anthracyclines and taxanes in neoadjuvant and adjuvant therapy for early breast cancer. Cochrane Database Syst Rev 2, Cd012873 (2019). - PMC - PubMed
    1. Budd GT, Barlow WE, Moore HC, Hobday TJ, Stewart JA, Isaacs C, Salim M, Cho JK, Rinn KJ, Albain KS, Chew HK, Burton GV, Moore TD, Srkalovic G, McGregor BA, Flaherty LE, Livingston RB, Lew DL, Gralow JR, Hortobagyi GN, SWOG S0221: a phase III trial comparing chemotherapy schedules in high-risk early-stage breast cancer. J Clin Oncol 33, 58–64 (2015). - PMC - PubMed
    1. Fountzilas G, Dafni U, Dimopoulos MA, Koutras A, Skarlos D, Papakostas P, Gogas H, Bafaloukos D, Kalogera-Fountzila A, Samantas E, Briasoulis E, Pectasides D, Maniadakis N, Matsiakou F, Aravantinos G, Papadimitriou C, Karina M, Christodoulou C, Kosmidis P, Kalofonos HP, A randomized phase III study comparing three anthracycline-free taxane-based regimens, as first line chemotherapy, in metastatic breast cancer: a Hellenic Cooperative Oncology Group study. Breast Cancer Res Treat 115, 87–99 (2009). - PubMed

Publication types