. 2021 Sep 3;373(6559):eabc1048.
doi: 10.1126/science.abc1048. Epub 2021 Sep 3.

Developmental chromatin programs determine oncogenic competence in melanoma

Affiliations

Developmental chromatin programs determine oncogenic competence in melanoma

Arianna Baggiolini et al. Science. .

Abstract

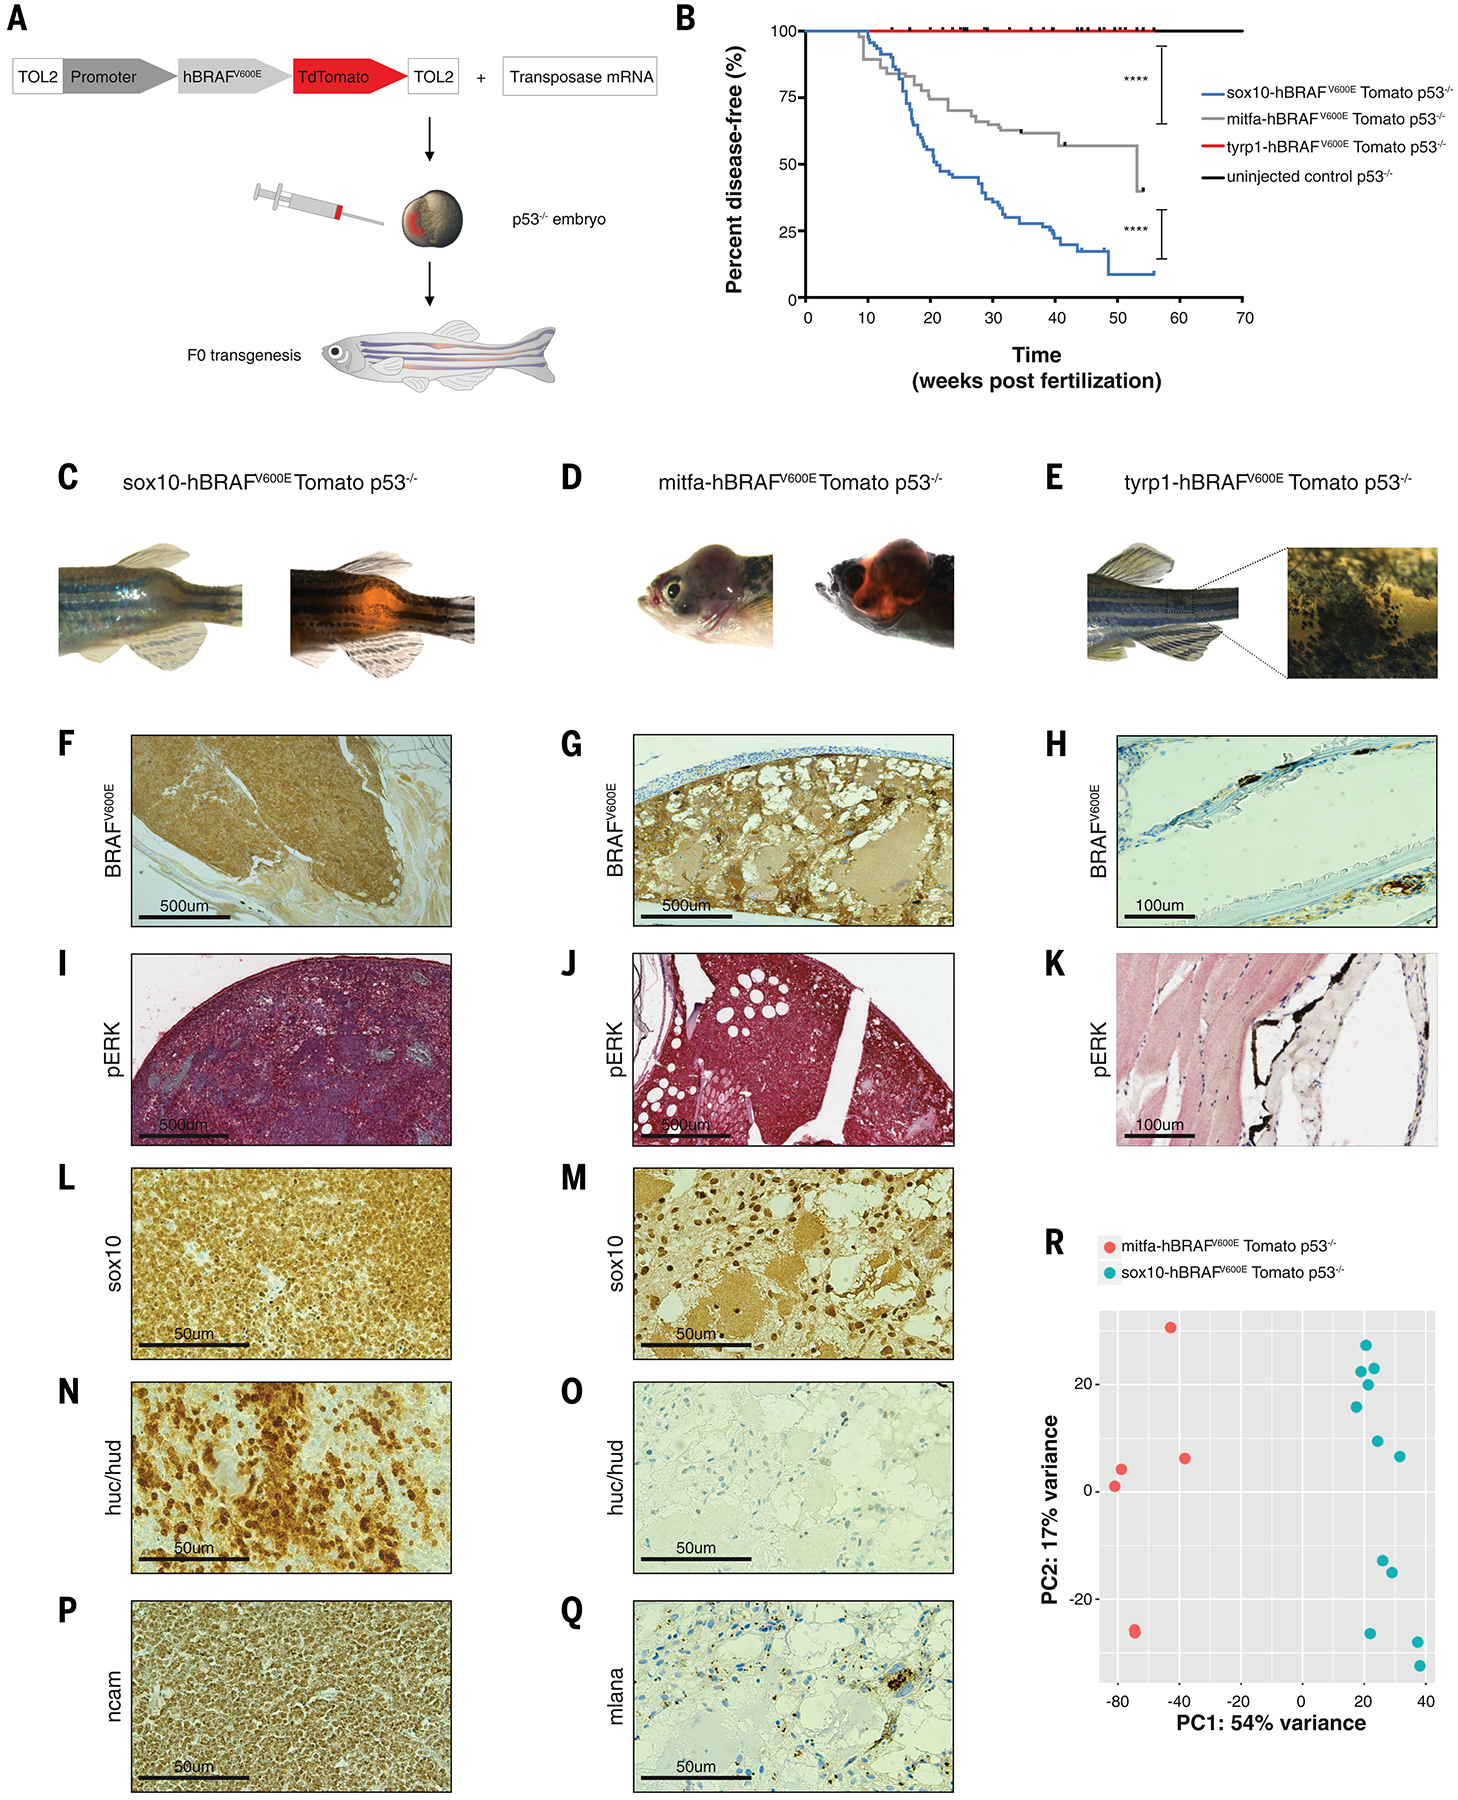
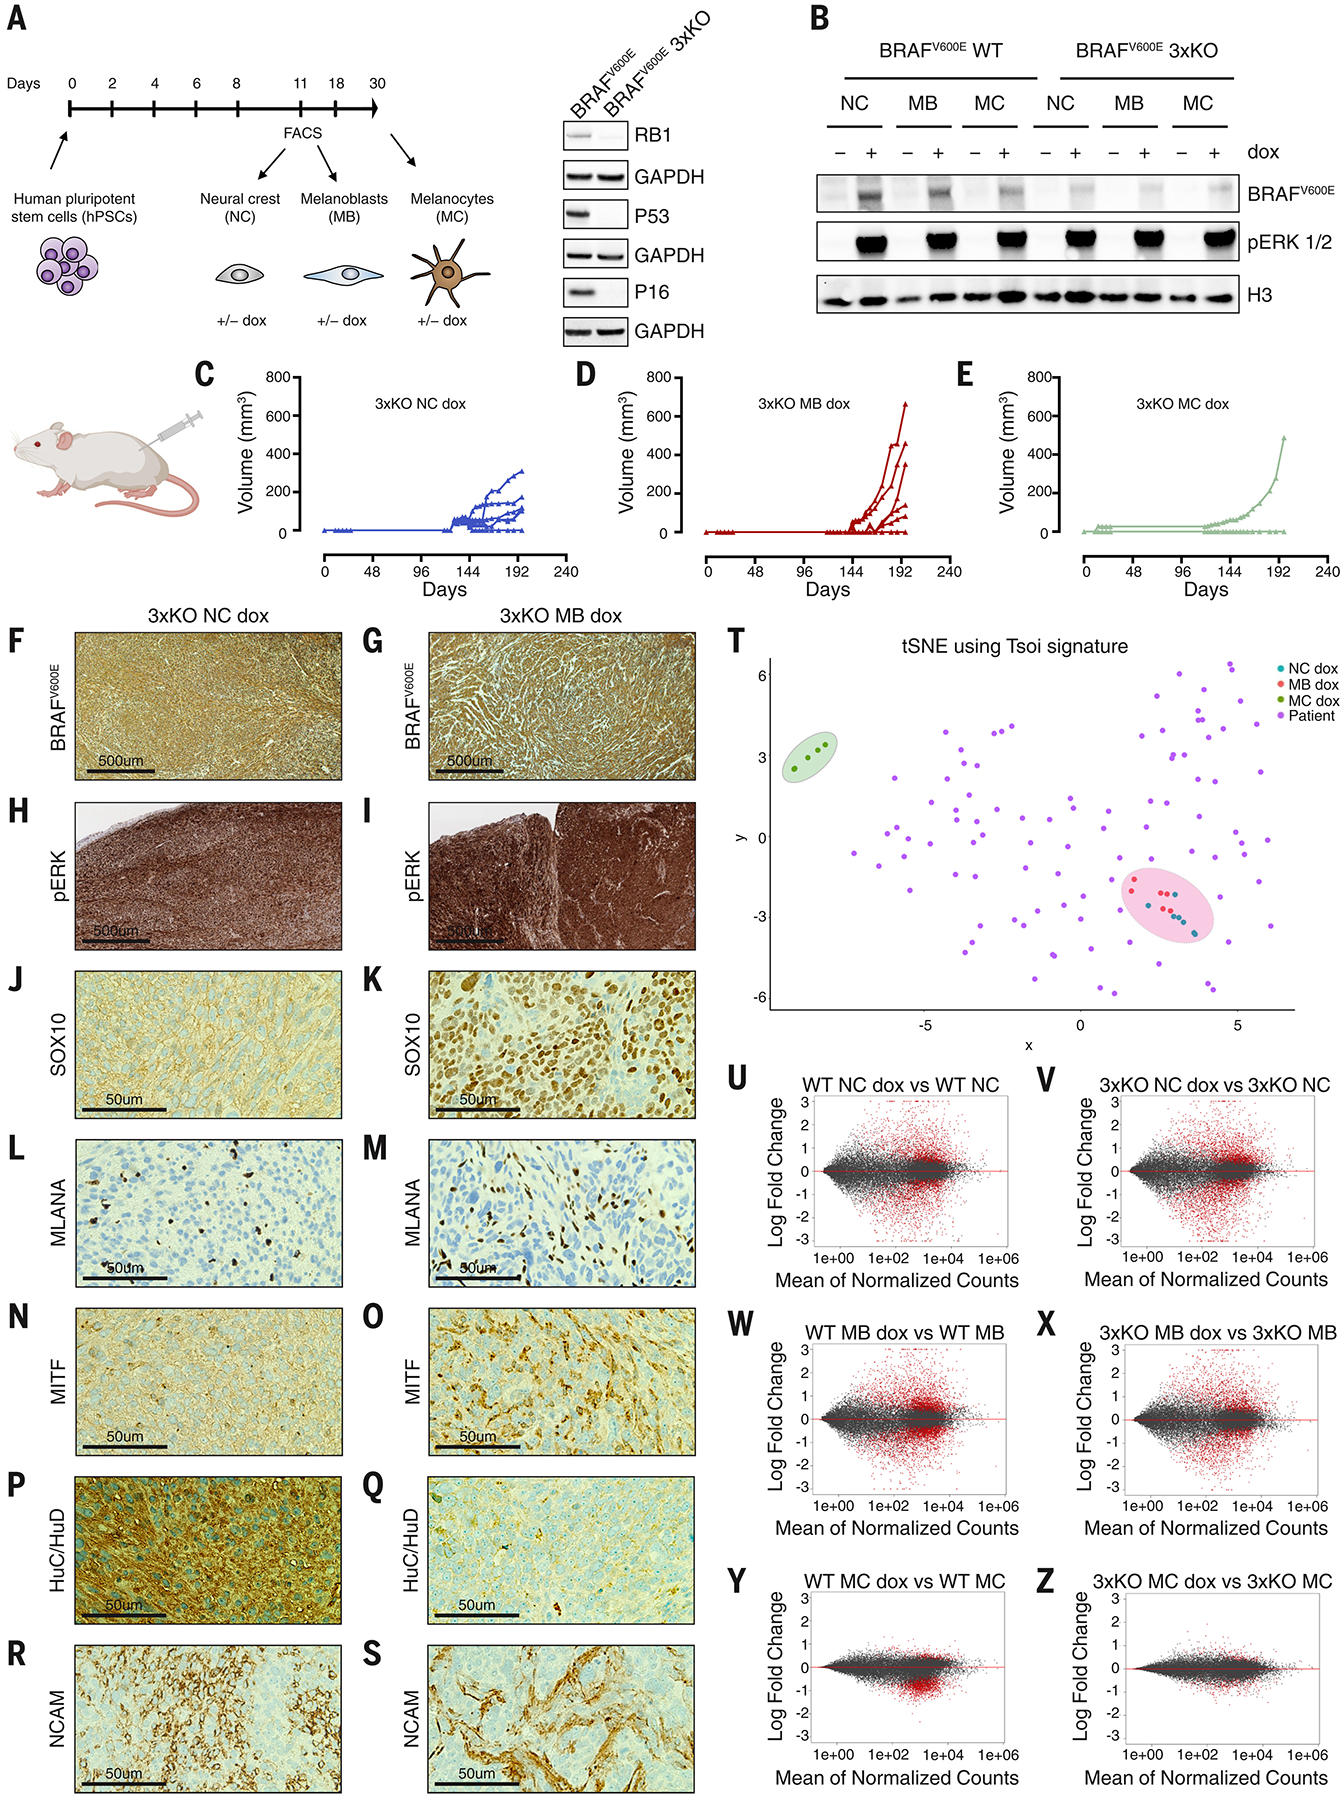
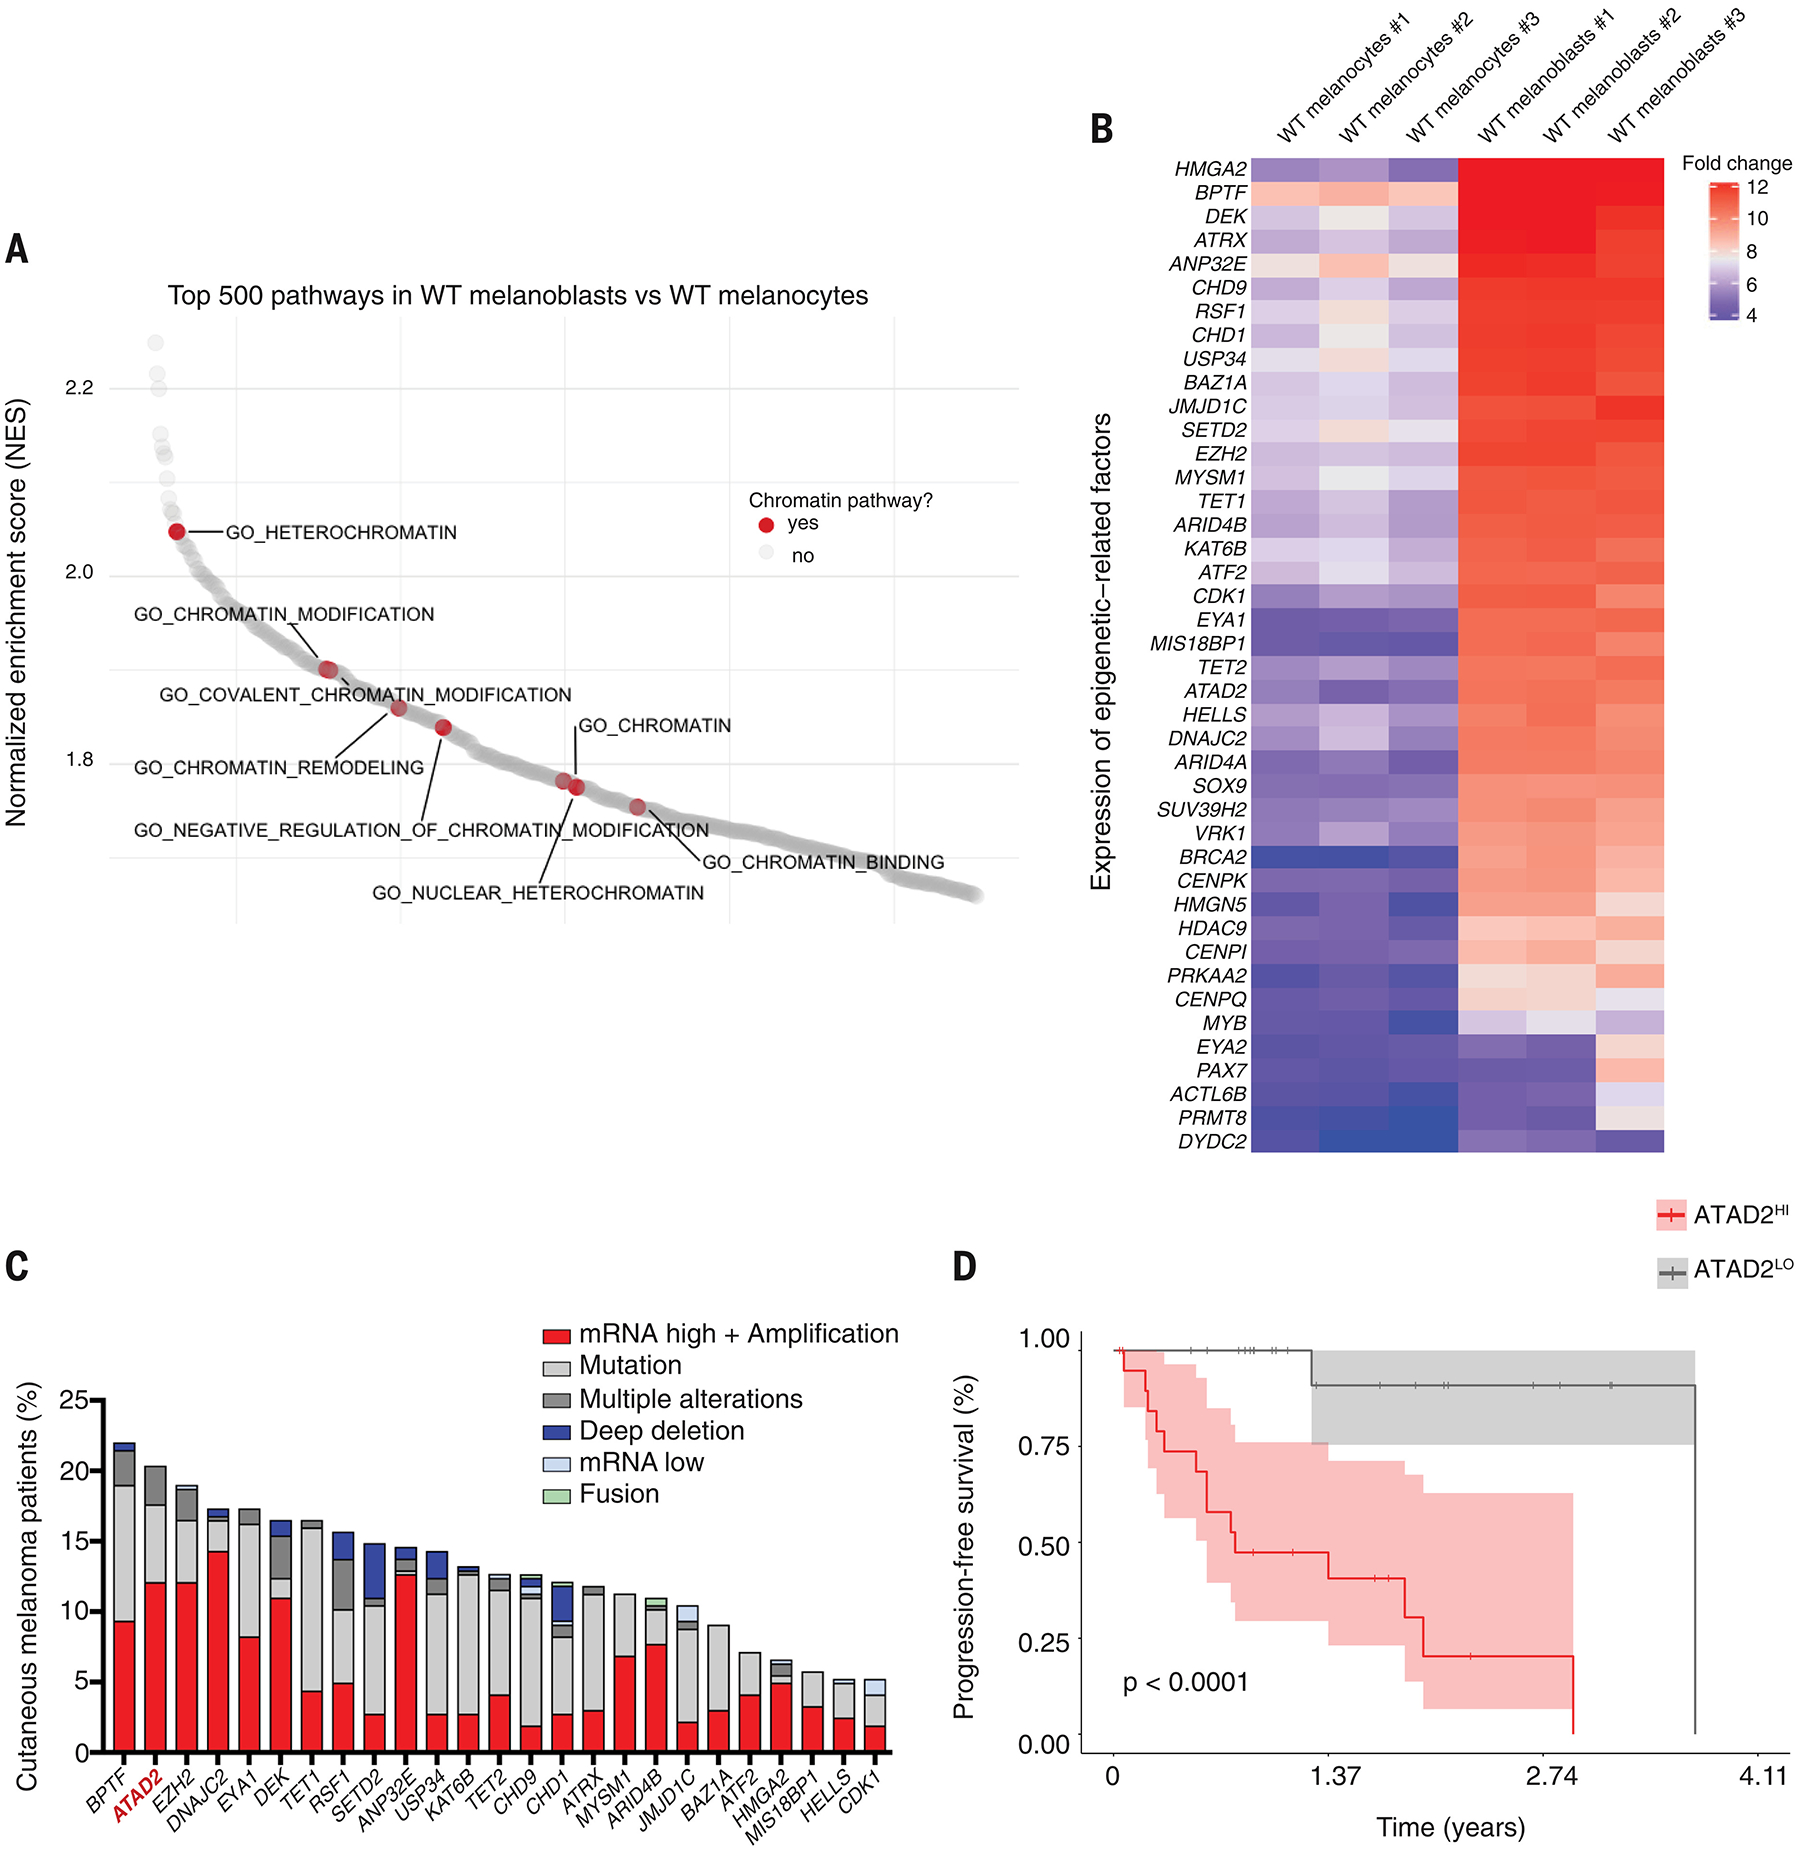
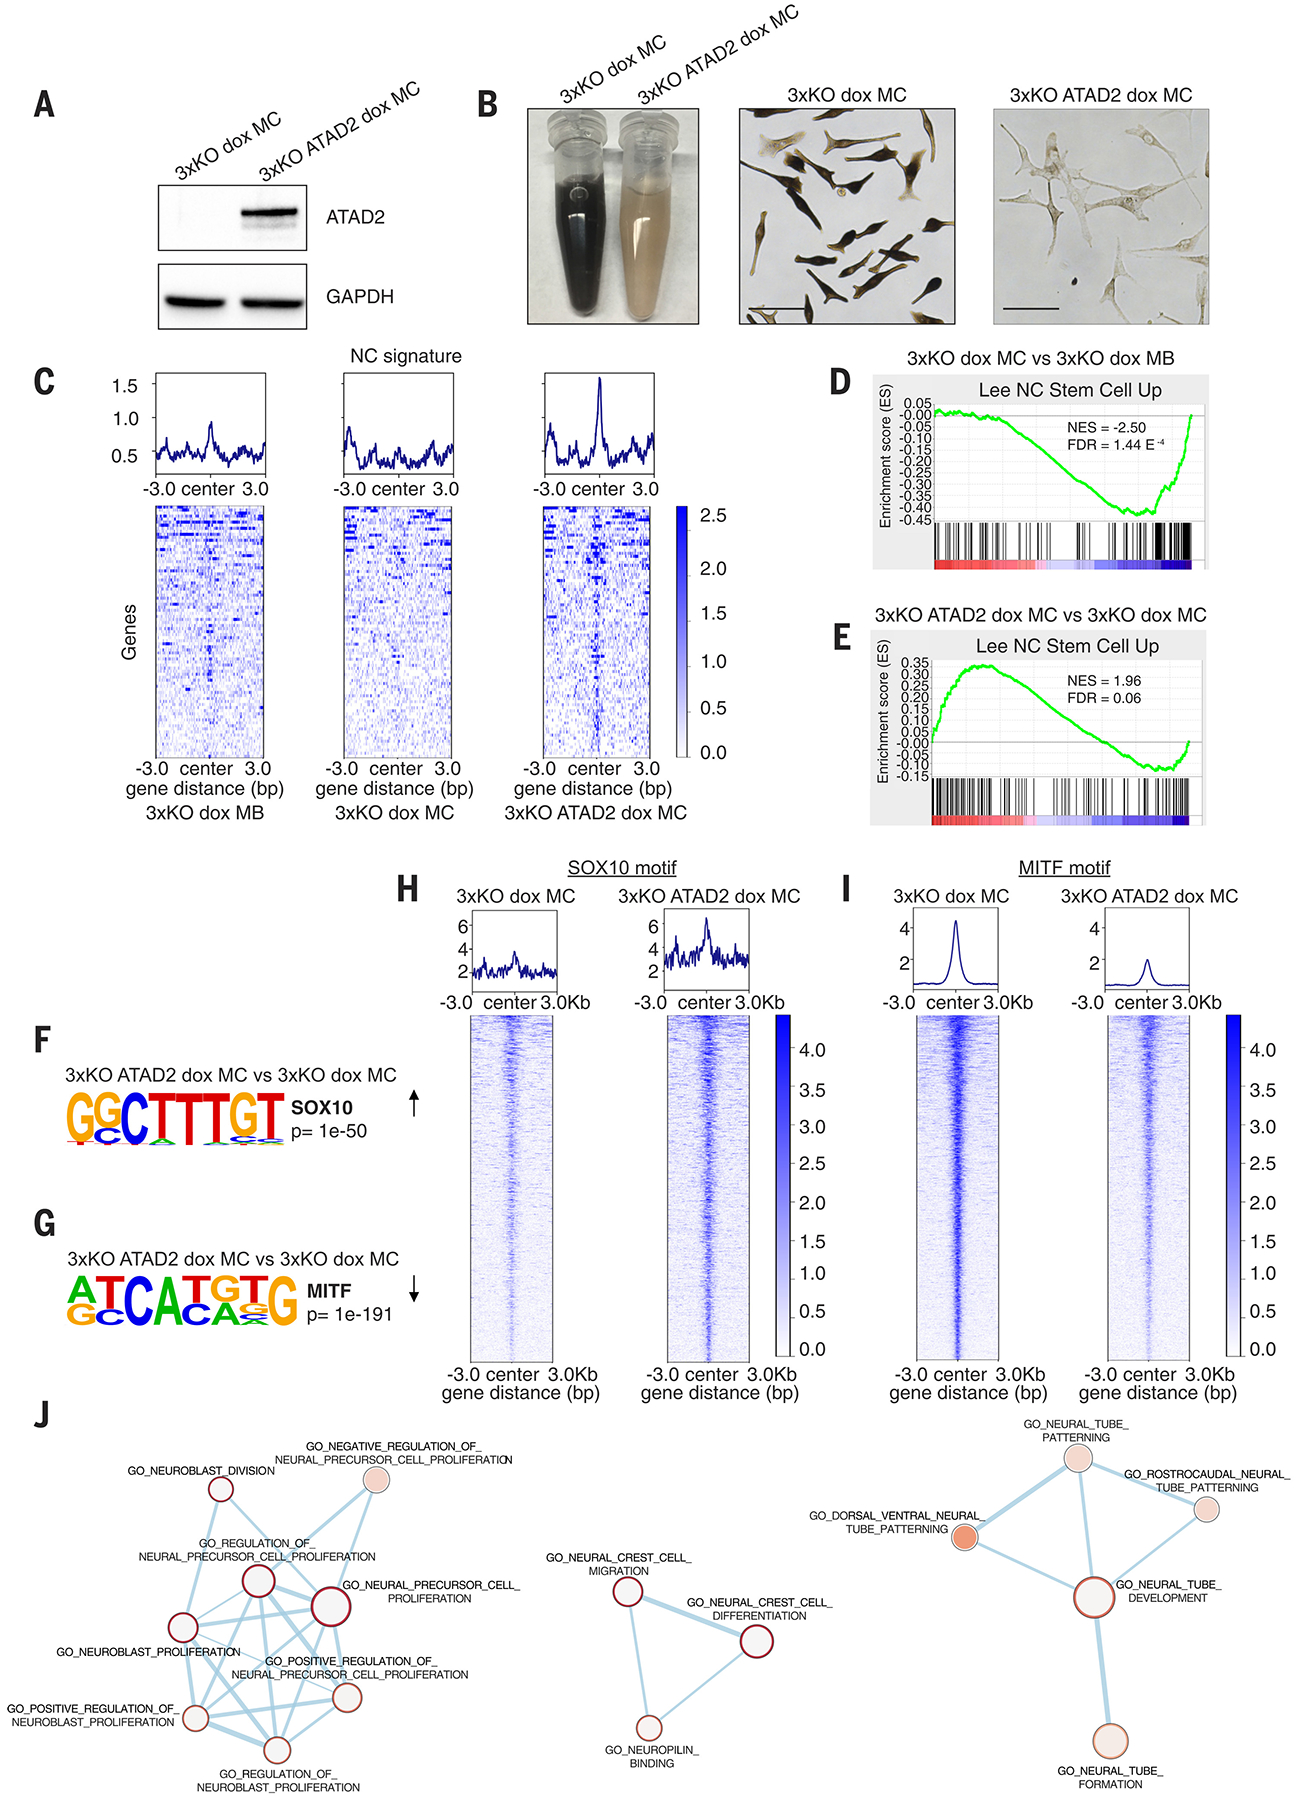
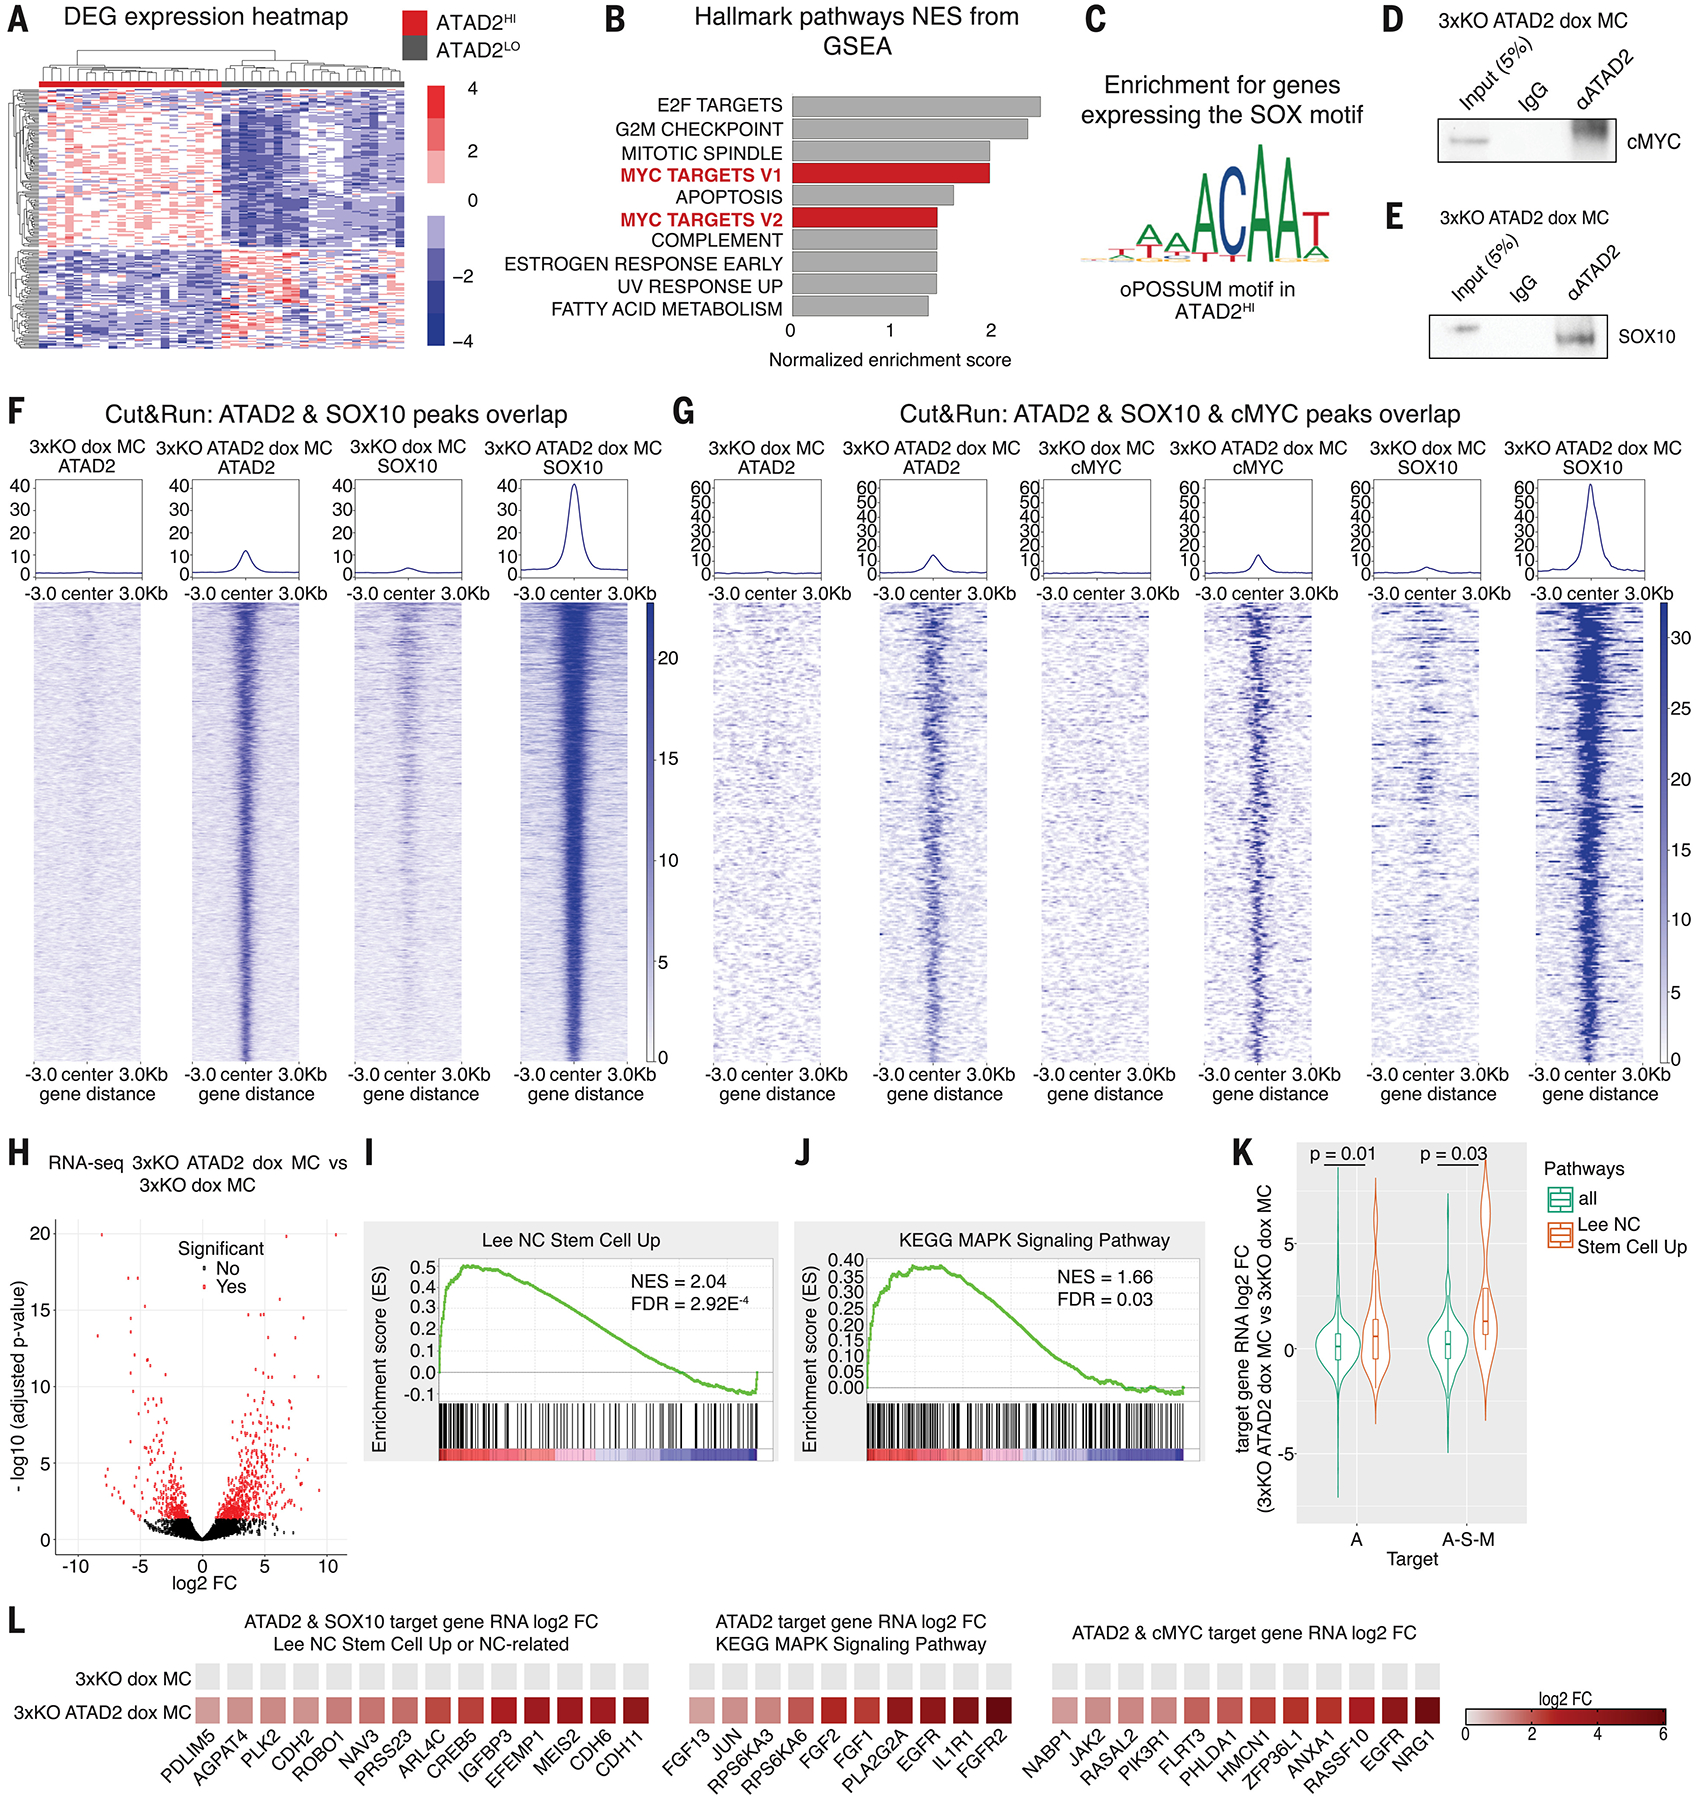
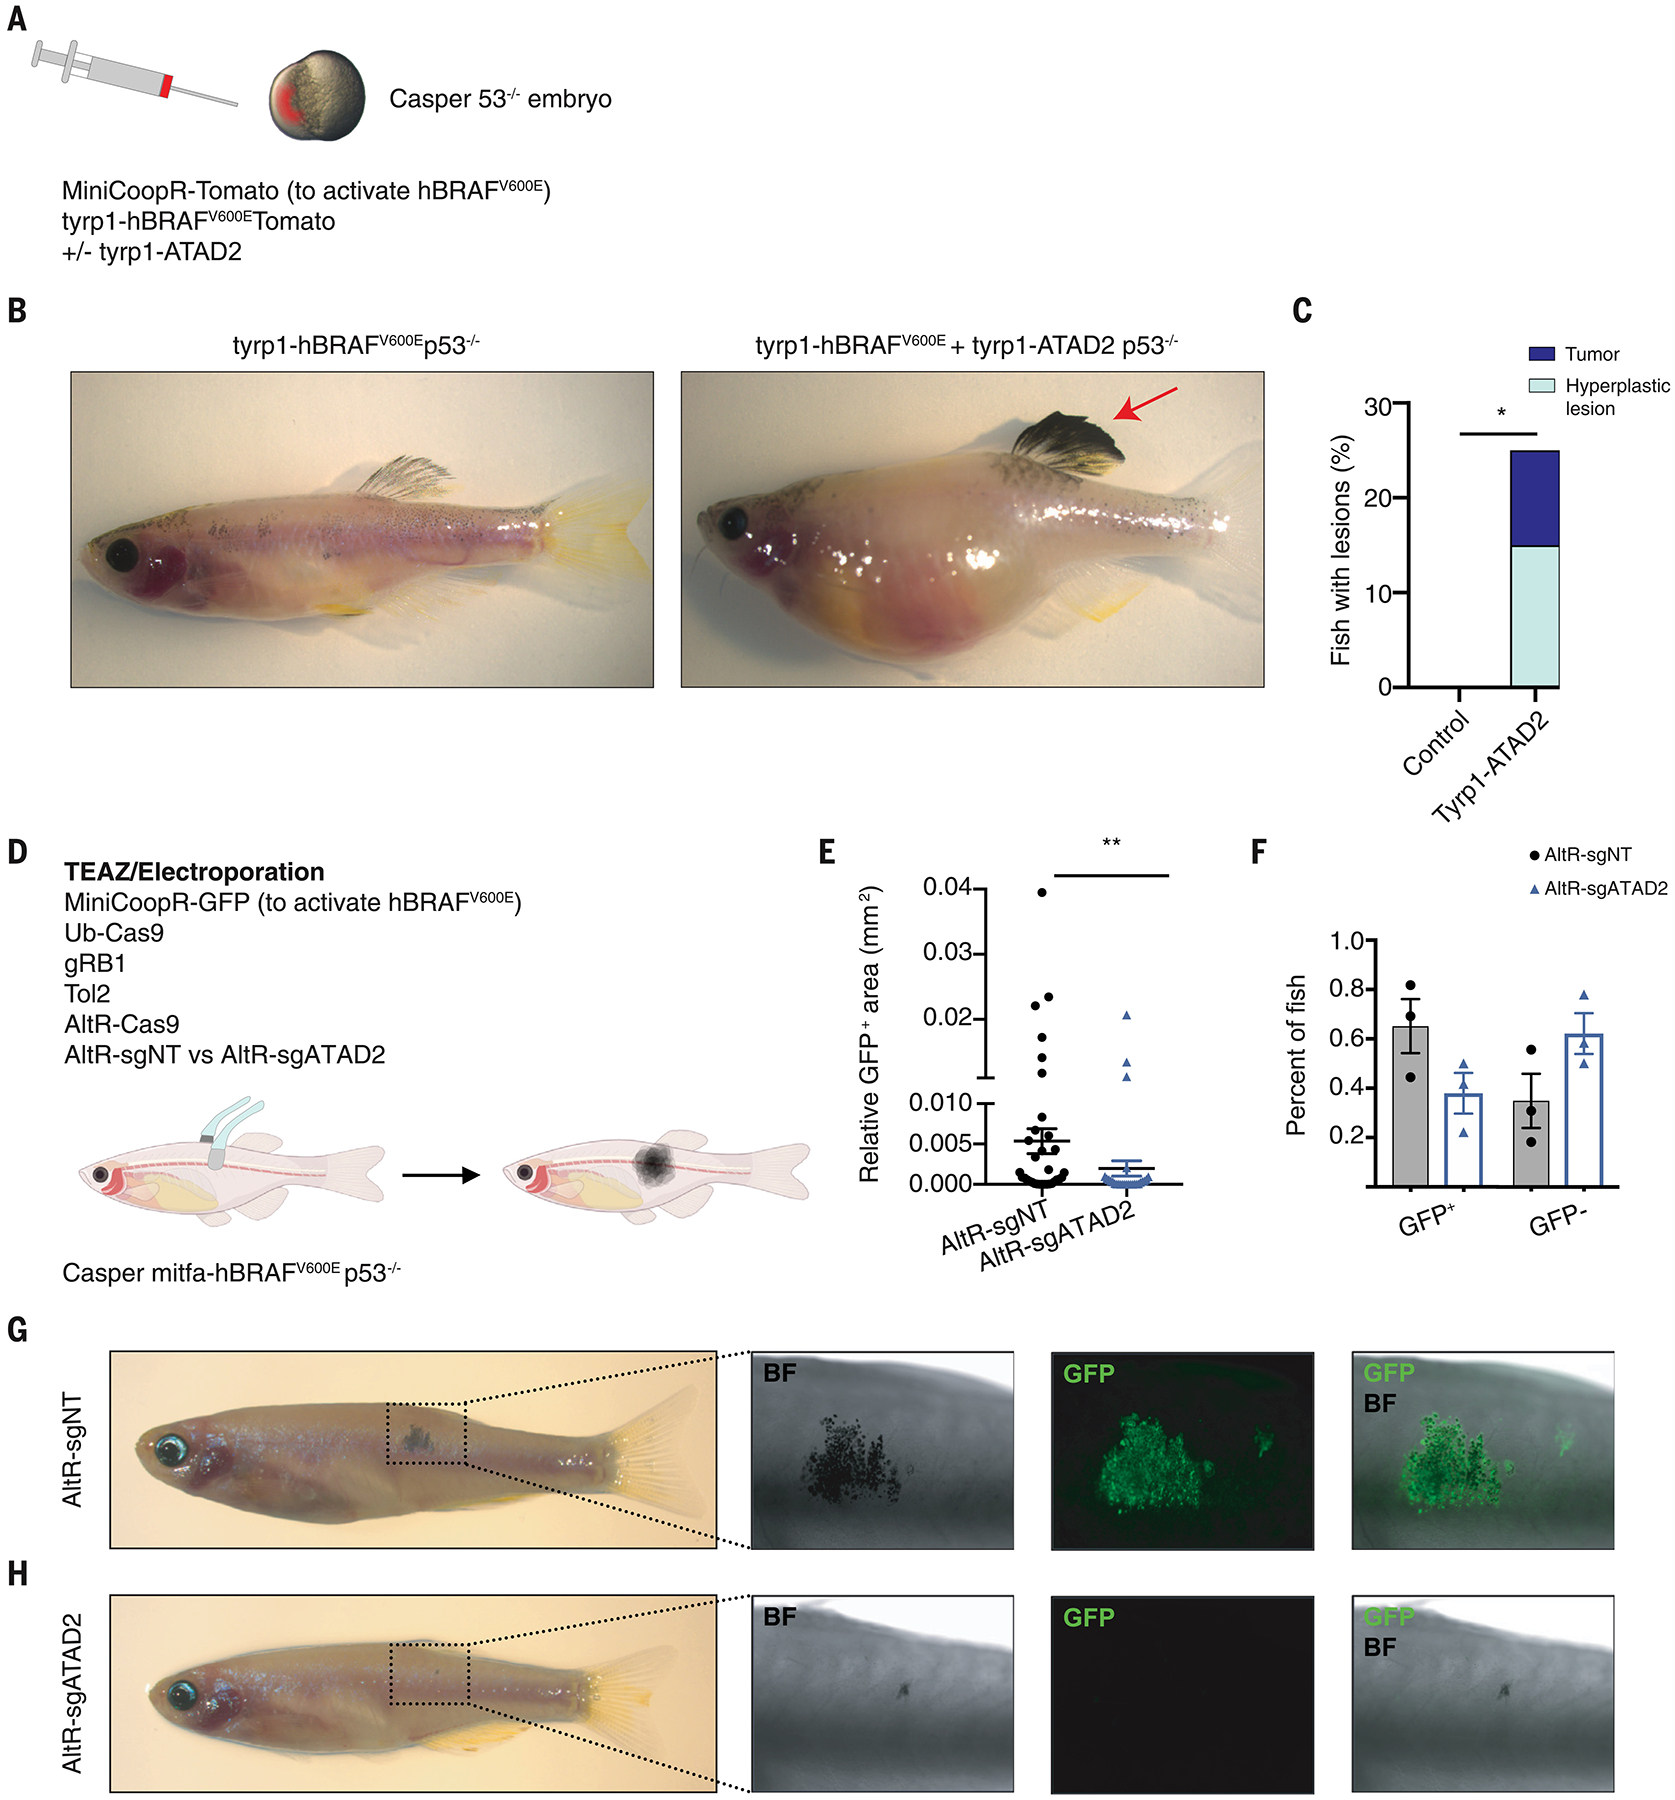
Oncogenes only transform cells under certain cellular contexts, a phenomenon called oncogenic competence. Using a combination of a human pluripotent stem cell–derived cancer model along with zebrafish transgenesis, we demonstrate that the transforming ability of BRAFV600E along with additional mutations depends on the intrinsic transcriptional program present in the cell of origin. In both systems, melanocytes are less responsive to mutations, whereas both neural crest and melanoblast populations are readily transformed. Profiling reveals that progenitors have higher expression of chromatin-modifying enzymes such as ATAD2, a melanoma competence factor that forms a complex with SOX10 and allows for expression of downstream oncogenic and neural crest programs. These data suggest that oncogenic competence is mediated by regulation of developmental chromatin factors, which then allow for proper response to those oncogenes.


Conflict of interest statement

Competing interests:

L.S. is co-founder and consultant of BlueRock Therapeutics and is listed as inventor on patent application by MSKCC related to melanocyte differentiation from human pluripotent stem cells (WO2011149762A2). R.M.W. is a consultant to N-of-One, a subsidiary of Qiagen. All other authors declare no competing interests.

Figures

Fig. 1.
Fig. 1.. Zebrafish models show that neural crest cells and melanoblasts, but not melanocytes, are cancer competent.
(A) Schematic drawing of zebrafish F0 transgenesis. F0 zebrafish transgenic fish were engineered by injection of p53−/− single-cell embryos with transposase mRNA together with TOL2 flanked plasmids, which encoded a stage-specific promoter (sox10, mitfa, tyrp1) driving BRAFV600E fused to TdTomato. (B) Kaplan-Meier curves of F0 p53−/− transgenic zebrafish injected with plasmids driving BRAFV600E fused to TdTomato under either the neural crest-specific promoter sox10 (n=92 biological replicates), the melanoblast-specific promoter mitfa (n=94 biological replicates), or the melanocyte-specific promoter tyrp1 (n=49 biological replicates) or uninjected control (n=86 biological replicates). **** = p < 0.0001 for the comparison of the tumor-free survival curves of fish with melanoblast-derived tumors and melanocyte-derived nevus-like structures; **** = p < 0.0001 for the comparison of the tumor-free survival curves of fish with neural crest- and melanoblast-derived tumors; log-rank (Mantel-Cox) test. (C) Neural crest-derived tumor developed in the sox10-BRAFV600E p53−/− transgenic fish. (D) Melanoblast-derived tumor developed in the mitfa-BRAFV600E p53−/− transgenic fish. (E) Nevus-like structure developed in the tyrp1-BRAFV600E p53−/− transgenic fish. (F−K) Immunohistochemistry for BRAFV600E and phospho ERK in the neural crest- and melanoblast-derived tumors and in the melanocyte-derived nevus-like structure. (L−Q) Immunohistochemistry staining for sox10, huc/hud, ncam and mlana. Neural crest derived tumors were positive for the neuronal marks huc/hud and ncam (N, P) and weakly positive for sox10 expression (L). MB-derived tumors were melanomas positive for sox10 (M), mlana (Q), and negative for the neuronal marks huc/hud (O). (R) PCA plot of mitfa-driven tumors (n=6, M, red) and sox10-driven tumors (n=12, S, blue) for whole genome RNA-seq shows a separation at the transcriptional level.
Fig. 2.
Fig. 2.. A hPSC-based cancer model recapitulates the zebrafish models and demonstrates that human neural crest and melanoblast states are cancer competent, while the differentiated melanocyte state is not.
(A) Schematic summary of hPSCs differentiation into neural crest cells, melanoblasts, and melanocytes and Western blot of the dox-inducible BRAFV600E (iBRAFV600E) hPSC line knockout for RB1, P53 and P16 (3xKO) using CRISPR/Cas9 technology. (B) Western blot of neural crest cells, melanoblasts, and melanocytes differentiated from either the iBRAFV600E WT or the iBRAFV600E 3xKO hPSCs. The cells were exposed to dox (1μg/ml) for 72h. (C-E) In vivo growth curves of 3xKO neural crest cells + dox (n=6 per group) (C); in vivo growth curves of 3xKO melanoblasts + dox (n=6 per group) (D). 3xKO melanocytes + dox were not able to grow in vivo (n=6 per group, 1 outlier) (E), but gave rise to nevus-like structures (fig. S4D). hPSCs-derived cells were injected subcutaneously in immunodeficient NSG mice exposed to a dox-containing diet. (F-S) Immunohistochemistry of neural crest-derived and melanoblast-derived tumors + dox treatment. Neural crest-derived tumors were undifferentiated and heterogeneous tumors, with strong neuronal features (P, R). Melanoblast-derived tumors were diagnosed as melanomas and they were positive for all the common melanocytic marks (K, M, O). (T) t-distributed Stochastic Neighbor Embedding (t-SNE) of 3xKO + dox neural crest, melanoblast and melanocyte samples and the TCGA melanoma samples using the Tsoi signature for melanoma subtypes. (U-Z) MA plots of the RNA-seq of WT neural crest cells, melanoblasts and melanocytes ± dox treatment and 3xKO neural crest cells, melanoblasts and melanocytes ± dox treatment (n=3 per condition). The mean of normalized counts of each gene was plotted against the log fold change following dox-induced BRAFV600E expression within that condition. Adjusted p value cut-off of 0.05 was used for significantly differentially expressed genes (red).
Fig. 3.
Fig. 3.. Cancer competence is reflected by a distinct expression of chromatin-related genes and ATAD2 is a key chromatin factor shared between human PSC-derived melanoblasts and patient melanoma cells.
(A) Waterfall plot of the enriched pathways from the GSAA comparing WT melanoblasts to WT melanocytes. Chromatin-related pathways are highlighted in red. (B) Heatmap depicting the differential expression of chromatin-related genes between WT melanoblasts and WT melanocytes. Normalized log2fold change. (C) Alteration frequency of the top 25 epigenetic-related factors overexpressed in WT melanoblasts in TCGA SKCM melanoma patient samples. (D) Kaplan-Meier overall survival curve of TCGA SKCM patients belonging either to the patients group with high levels of ATAD2 expression (ATAD2HI) or with low expression levels (ATAD2LO), log-rank p value reported.
Fig. 4.
Fig. 4.. ATAD2 expression in melanocytes reshapes the chromatin around neural crest and melanoblast loci and reactivates a developmental signature.
(A) Western blot for lenti-induced ATAD2 expression in 3xKO dox melanocytes. (B) 3xKO dox melanocytes (right) and 3xKO ATAD2 dox melanocytes (left). Scale bars: 50 μm. (C) Tornado plots of the Gene Set Enrichment Analysis (GSEA) of the ATAC-seq showing genes belonging to Lee NC Stem Cell Up gene set in 3xKO dox melanoblasts, 3xKO dox melanocytes, and 3xKO ATAD2 dox melanocytes. (D-E) GSEA of the ATAC-seq of 3xKO dox melanocytes compared to 3xKO dox melanoblasts for Lee NC Stem Cell Up (NES = −2.50, FDR = 1.44 E−4) (D) and of 3xKO ATAD2 dox melanocytes compared to 3xKO dox melanocytes for Lee NC Stem Cell Up (NES = 1.96, FDR = 0.06) (E). (F) Homer motif discovery shows that the SOX10 motif is one of the most enriched motifs (p value < 1e−50) in 3xKO ATAD2 dox melanocytes compared to 3xKO dox melanocytes. (G) Homer motif discovery shows that the MITF motif is the most closed motif (p value < 1e−191) in 3xKO ATAD2 dox melanocytes compared to 3xKO dox melanocytes. (H) Tornado plots depict any dynamic ATAC peak that contains the SOX10 motif, regardless of genomic location or gene annotation. (I) Tornado plots depict any dynamic ATAC peak that contains the MITF motif, regardless of genomic location or gene annotation. (J) Network analysis of the genes with increased accessibility for the SOX10 binding motif in 3xKO ATAD2 dox melanocytes compared to 3xKO dox melanocytes.
Fig. 5.
Fig. 5.. ATAD2 promotes melanoma phenotypes through cMYC and SOX10 in both clinical samples of cutaneous melanoma and in the hPSC-derived cancer model.
(A) Heatmap plot of differentially expressed genes (DEG) in the ATAD2HI patient group versus the ATAD2LO patient group. (B) Top 10 hallmark pathways from GSEA enriched in the ATAD2HI patient group compared to the ATAD2LO patient group. (C) Identification of the SOX binding motif on genes co-expressed in the ATAD2HI patient groups, determined by analysis with the oPOSSUM software tool. (D-E) Co-IP analysis of protein lysates of 3xKO ATAD2 dox melanocytes using either the ATAD2 or the control IgG antibody and then blotted against cMYC (D) and SOX10 (E). (F) Tornado plots depict the Cut&Run peaks overlapping between ATAD2 and SOX10 in 3xKO dox melanocytes and 3xKO ATAD2 dox melanocytes. (G) Tornado plots depict the Cut&Run peaks overlapping between ATAD2, c-MYC and SOX10 in 3xKO dox melanocytes and 3xKO ATAD2 dox melanocytes. (H) Volcano plot of the RNA-seq depicts the distribution of the transcriptional differences between 3xKO ATAD2 dox melanocytes over 3xKO dox melanocytes. (I-J) GSEA of the RNA-seq of 3xKO ATAD2 dox melanocytes compared to 3xKO dox melanocytes for Lee NC Stem Cell Up (NES = 2.04, FDR = 2.92 E-4) (I) and for KEGG MAPK Signaling Pathway (NES = 1.66, FDR = 0.03) (J). (K) Violin plots showing the distribution of Cut&Run target genes that are also significantly upregulated in the RNA-seq dataset. Genes bound by ATAD2 are enriched for RNA upregulation of the Lee NC Stem Cell signature (left, Mann-Whitney U test, p = 0.01), as are genes cobound by ATAD2/SOX10/cMYC (right, Mann-Whitney U test, p = 0.03). (L) Heatmap depicting expression changes of the ATAD2 and SOX10 co-bound Cut&Run target genes belonging to the Lee NC Stem Cell Up gene set (left). Heatmap depicting expression changes of the ATAD2 Cut&Run target genes belonging to the KEGG MAPK Signaling Pathway (middle). Heatmap depicting expression changes of selected ATAD2 and cMYC co-bound Cut&Run target genes (right).
Fig. 6.
Fig. 6.. ATAD2 is necessary and sufficient for melanoma initiation.
(A) p53−/−;casper single-cell embryos were injected with a plasmid which encoded the melanocyte-specific promoter tyrp1 driving BRAFV600E ± a plasmid that encoded tyrp1 driving ATAD2, along with a MiniCoopR-tdTomato plasmid to rescue melanocytes in the casper background. (B) Transgenic control fish with tyrp1 driving BRAFV600E (left) and a transgenic fish expressing tyrp1 driving both BRAFV600E and ATAD2, which developed a pigmented tumor (right). (C) Percentage of fish that developed melanoma with the tyrp1 driving BRAFV600E +/− ATAD2. Control fish expressing tyrp1-BRAFV600E did not develop tumors (n=0/23 fish), whereas fish expressing tyrp1 driving BRAFV600E + ATAD2 developed melanomas (n=2/20 fish) and hyperplastic lesions (n=3/20 fish). Fisher’s exact test, * p < 0.05. (D) Schematic drawing for the TEAZ/Electroporation experiment. Fish that were p53−/−, casper; mitfa-BRAFV600E were electroporated with MiniCoopR-GFP (mitfa-MITF and mitfa-GFP), Ub-Cas9, gRB1, Tol2, AltR-Cas9, and either AltR-sgNT or a pool of AltR-sgATAD2. The fish were then monitored and quantified for melanoma initiation. (E) Quantification of the GFP+ area (mm2) in the transgenic fish two weeks after electroporation. Mann-Whitney test with ** p = 0.01. (F) Percentage of fish that were either GFP+ or GFP depending on the electroporation of AltR-sgNT or AltR-sgATAD2. (G) Transgenic fish electroporated with AltR-sgNT, 4 weeks post electroporation. The images depict early lesions characterized by pigmentation and GFP expression. (H) Transgenic fish electroporated with AltR-sgATAD2, 4 weeks post electroporation.

Comment in

References

    1. Haigis KM, Cichowski K, Elledge SJ, Tissue-specificity in cancer: The rule, not the exception. Science 363, 1150–1151 (2019). - PubMed
    1. Kaufman CK, Mosimann C, Fan ZP, Yang S, Thomas AJ, Ablain J, Tan JL, Fogley RD, van Rooijen E, Hagedorn EJ, Ciarlo C, White RM, Matos DA, Puller AC, Santoriello C, Liao EC, Young RA, Zon LI, A zebrafish melanoma model reveals emergence of neural crest identity during melanoma initiation. Science 351, aad2197 (2016). - PMC - PubMed
    1. White RM, Cech J, Ratanasirintrawoot S, Lin CY, Rahl PB, Burke CJ, Langdon E, Tomlinson ML, Mosher J, Kaufman C, Chen F, Long HK, Kramer M, Datta S, Neuberg D, Granter S, Young RA, Morrison S, Wheeler GN, Zon LI, DHODH modulates transcriptional elongation in the neural crest and melanoma. Nature 471, 518–522 (2011). - PMC - PubMed
    1. Varum S, Baggiolini A, Zurkirchen L, Atak ZK, Cantu C, Marzorati E, Bossart R, Wouters J, Hausel J, Tuncer E, Zingg D, Veen D, John N, Balz M, Levesque MP, Basler K, Aerts S, Zamboni N, Dummer R, Sommer L, Yin Yang 1 Orchestrates a Metabolic Program Required for Both Neural Crest Development and Melanoma Formation. Cell stem cell 24, 637–653.e639 (2019). - PubMed
    1. Heppt MV, Wang JX, Hristova DM, Wei Z, Li L, Evans B, Beqiri M, Zaman S, Zhang J, Irmler M, Berking C, Besch R, Beckers J, Rauscher FJ 3rd, Sturm RA, Fisher DE, Herlyn M, Fukunaga-Kalabis M, MSX1-Induced Neural Crest-Like Reprogramming Promotes Melanoma Progression. The Journal of investigative dermatology 138, 141–149 (2018). - PMC - PubMed

Publication types

MeSH terms