Review
. 2021 Sep 3;373(6559):eabg7285.
doi: 10.1126/science.abg7285. Epub 2021 Sep 3.

Architectures of neuronal circuits

Affiliations
Review

Architectures of neuronal circuits

Liqun Luo. Science. .

Abstract

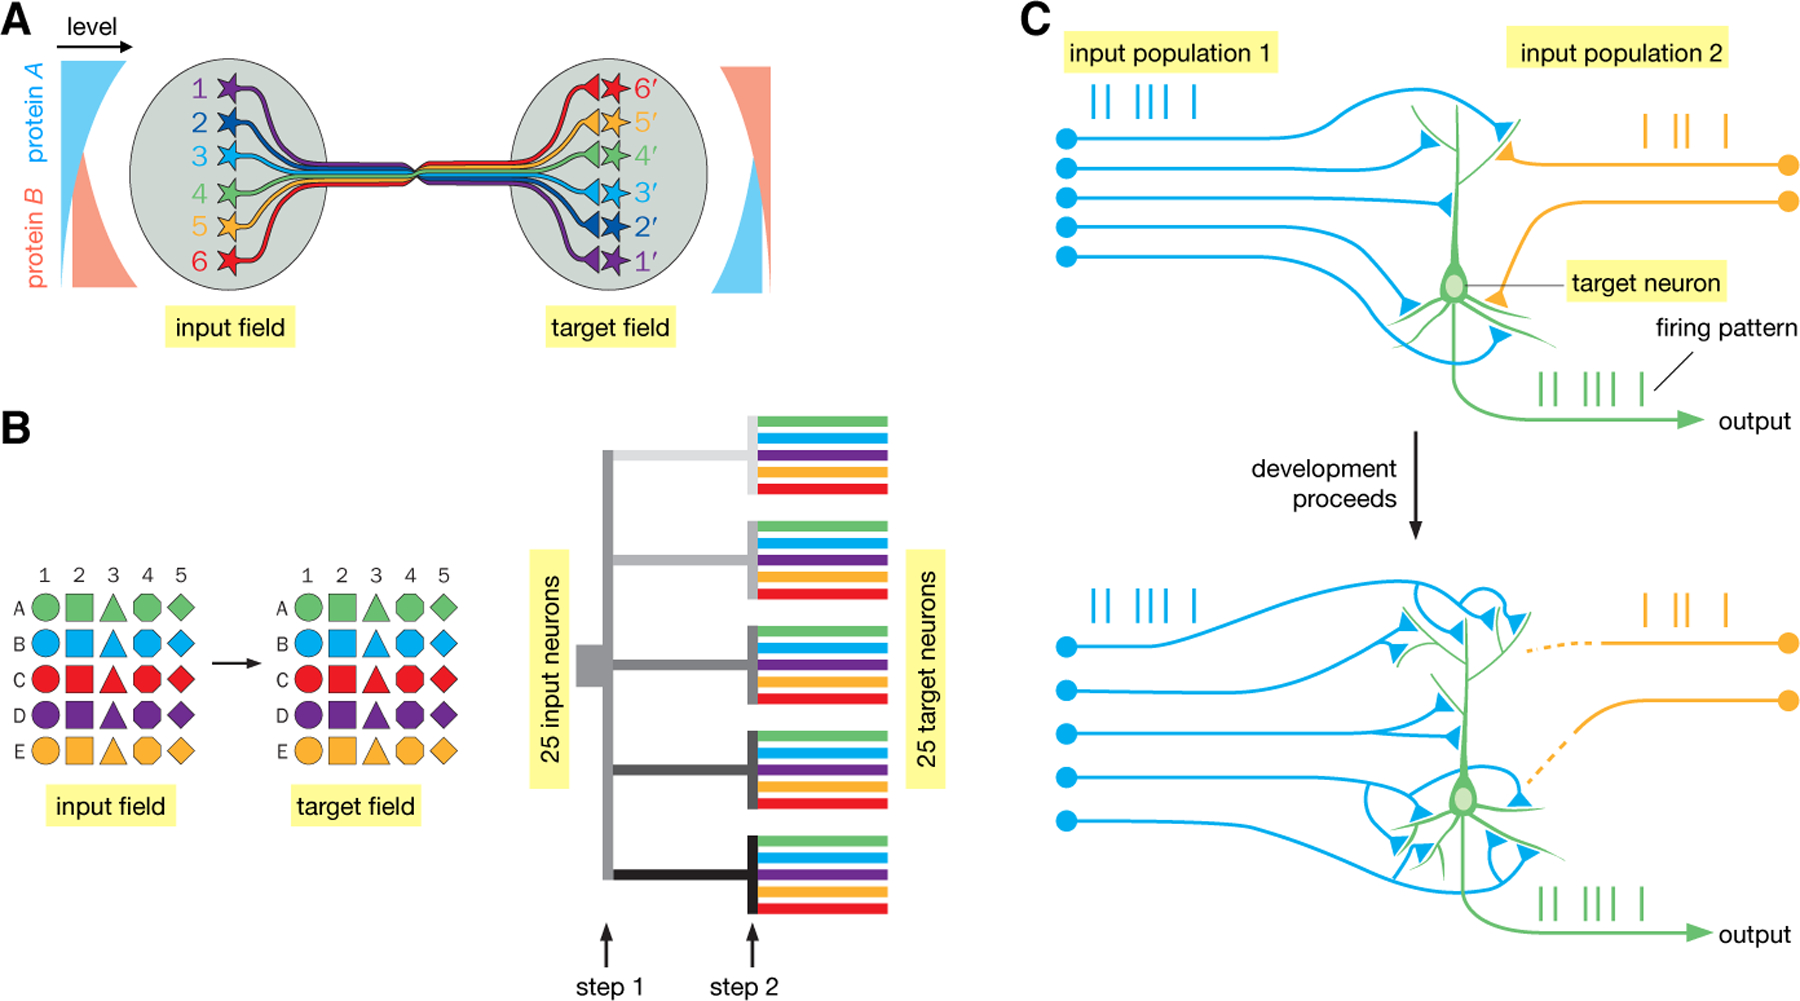
Although individual neurons are the basic unit of the nervous system, they process information by working together in neuronal circuits with specific patterns of synaptic connectivity. Here, I review common circuit motifs and architectural plans used in diverse brain regions and animal species. I also consider how these circuit architectures assemble during development and might have evolved. Understanding how specific patterns of synaptic connectivity can implement specific neural computations will help to bridge the huge gap between the biology of the individual neuron and the function of the entire brain, allow us to better understand the neural basis of behavior, and may inspire new advances in artificial intelligence.


Conflict of interest statement

Competing interests: The author declares no competing interests.

Figures

Fig. 1.
Fig. 1.. Information flow within a vertebrate neuron.
A pyramidal neuron from rabbit cerebral cortex. Neurons generally use dendrites (blue) to receive information from their presynaptic partners and the axon (red) to send information to their postsynaptic partners. Thus, information flows from dendrites to cell bodies to the axon (black arrows). *, axon initial segment, where action potentials are generated. Red arrow indicates back-propagating action potentials that can interact with synaptic inputs in complex ways for dendritic computation (115). While axons and dendrites are readily distinguishable by morphological criteria in most vertebrate neurons, most invertebrate CNS neurons extend a single process from the cell body that gives rise to both dendrites and the axon. Thus, in invertebrate neurons, information flow is less easily deciphered from morphological criteria alone. Modified after (1, 5).
Fig. 2.
Fig. 2.. Commonly used circuit motifs.
See box on the right for notations. (A) Feedforward excitation. Information flows through a series of excitatory neurons, A to D. Three different A neurons synapse onto B, exemplifying convergent excitation. C synapses onto three distinct D neurons, exemplifying divergent excitation. (B) In feedforward inhibition (top), inhibitory neuron C receives input from presynaptic excitatory neuron A and sends inhibitory output to postsynaptic neuron B; in feedback inhibition (bottom), inhibitory neuron C receives input from and sends inhibitory output to postsynaptic excitatory neuron B. (C) In lateral inhibition, parallel pathways (AnBn; 3 are shown) each excite inhibitory neuron C, which in turn sends inhibitory output to all pathways. (D) In mutual inhibition, two inhibitory neurons form reciprocal connections and also provide outputs through branched axons to broadcast their activity states. The inhibitory neurons can also act through intermediary excitatory neurons to inhibit each other (not shown). A–C, modified after (5).
Fig. 3.
Fig. 3.. Specialized architectures for specific functions.
(A) Continuous topographic mapping. Neighboring neurons in the input field project their axons in an orderly fashion to connect to neighboring neurons in the target field, preserving their spatial relationships. A prime example is the retinotopic map. (B) Discrete parallel processing. Neurons of a specific type (same color) in the input field, regardless of their spatial locations, connect to the corresponding neuron type in the target field. A prime example is the olfactory glomerular map. Target neurons do not need to be spatially ordered as shown; they could extend their dendrites to connect specifically with the axons of specific input neuron types. (C) Dimensionality expansion. Signals represented by a small number of neurons in field A are represented by a much larger number of neurons in field B, such that activation of B neurons can represent specific combinations of A neurons (e.g., B4 represents co-activation of A1 and A2). Furthermore, the synaptic connections between B and C can be altered by coactivation of a teaching signal (the lightening and + sign signals strengthening) and a specific B neuron to modify the synaptic strength between that particular B and C. Thus, only after training would coactivation of A1 and A2 reaches the threshold (thick arrow for B4) for activating C1. Likewise, a C2 neuron (not shown) can be trained to respond to the coactivation of A2 and A3 by modifying the strength of B7C2. Filled and open symbols represent active and inactive neurons, respectively. (D) Two examples of recurrent loops. In the entorhinal–hippocampal loop (top), arrows indicate direct connections between neurons within the indicated regions. Many connections within these regions are topographically organized (116). In the neocortex–basal ganglia–thalamus (red) and neocortex–pons–cerebellum–thalamus loops (blue), arrows represent connections between these brain regions but not necessarily direct synaptic connections between specific neuron types. Within the basal ganglia and cerebellum, for example, inputs are transformed at intermediary stages to produce outputs. A and B, modified after (117).
Fig. 4.
Fig. 4.. Input–output organization of neuromodulatory circuits with broad projections.
Modulatory neurons in region B collectively receive inputs from regions A1–Am and send broad output to regions C1–Cn. (A) Biased input–segregated output architecture. This architecture applies to several neuromodulatory systems, including midbrain dopamine neurons, dorsal raphe serotonin neurons, and preoptic area galanin neurons. Arrows of different thickness represent different input strengths. (B) Integration-and-broadcast architecture. Neuronal populations in region B that project to a specific output region also send output to other output regions, with the possibility of a quantitative bias; these populations also receive similar inputs. Locus coeruleus norepinephrine neurons approximate this architecture. Each circle symbolizes a neuronal population rather than an individual neuron, as the input–output organization summarized here is based on studies at the population level rather than at the level of individual neurons. Modified after (48, 49).
Fig. 5.
Fig. 5.. Wiring up neuronal circuits.
(A) Protein gradients can be used to construct continuous topographic maps. In this example, both input and target fields are patterned by opposing gradients of cell-surface proteins A and B. Suppose that neuronal processes expressing protein A and protein B mutually repel each other. Because Neuron 1 has the highest level of protein A, it seeks a target field with the lowest level of protein B; likewise, Neuron 6 seeks a target field with the lowest level of protein A. (B) Illustration of combinatorial strategies to specify connections between 25 discrete cell types in the input and target fields. (Left) Suppose that connection specificities between the input and target fields are mediated by homophilic attraction molecules. If each connection is specified by a single molecule, 25 molecules are needed to specify 25 connections. If each connection is specified by a combination of two molecules (a letter and a number), only 10 molecules are needed. (Right) The combinatorial strategy is realized by dividing the wiring process into 2 steps. At step 1, 5 molecules (represented by different shades of gray) separate 5 input axons into 5 groups; at step 2, 5 more molecules (represented by different colors) are used in each of the 5 groups to specify the final connections. (C) Schematic illustration of Hebb’s rule in instructing wiring. At an early developmental stage, the target neuron is connected with two groups of input neurons with distinct coincident firing patterns (blue and yellow vertical lines). Because stronger connections to the group 1 input drive the target neuron to fire in a pattern (green vertical lines) similar to that of group 1, their connections are strengthened. Synaptic connections between group 2 input and the target neuron weaken due to their dissimilar firing patterns. Eventually, the target neuron is only connected with group 1 input. Modified after (5).

References

    1. Cajal SR, Histology of the Nervous System of Man and Vertebrates (Oxford University Press, Inc., translation by Swanson N & Swanson LW, Oxford, 1995).
    1. Golgi C, Sulla struttura della sostanza grigia del cervello. Gazetta medica lombarda IV, (1873).
    1. Laurent G et al., Odor encoding as an active, dynamical process: Experiments, computation, and theory. Annu Rev Neurosci 24, 263–297 (2001). 11283312 - PubMed
    1. Shenoy KV, Sahani M, Churchland MM, Cortical control of arm movements: A dynamical systems perspective. Annu Rev Neurosci 36, 337–359 (2013). 23725001 - PubMed
    1. Luo L, Principles of Neurobiology, 2nd ed. (CRC Press/Garland Science, 2020).

Publication types