. 2021 Sep 3;7(36):eabi6856.
doi: 10.1126/sciadv.abi6856. Epub 2021 Sep 1.

Rare genetic variability in human drug target genes modulates drug response and can guide precision medicine

Affiliations

Rare genetic variability in human drug target genes modulates drug response and can guide precision medicine

Yitian Zhou et al. Sci Adv. .

Abstract

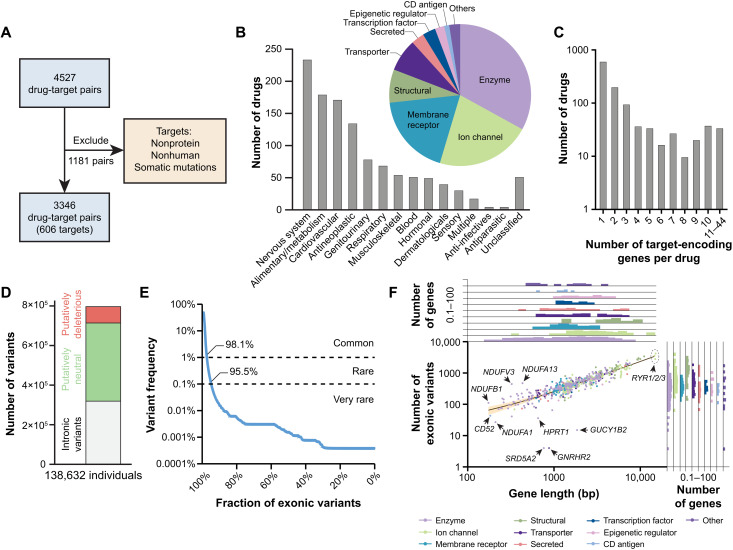
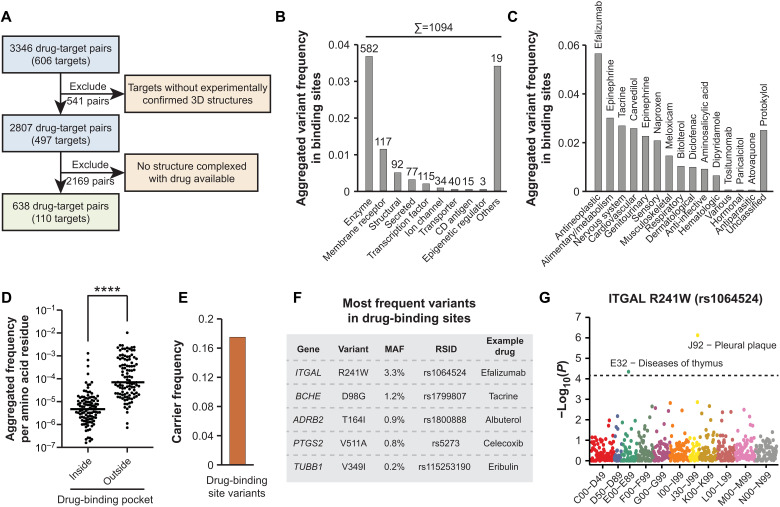
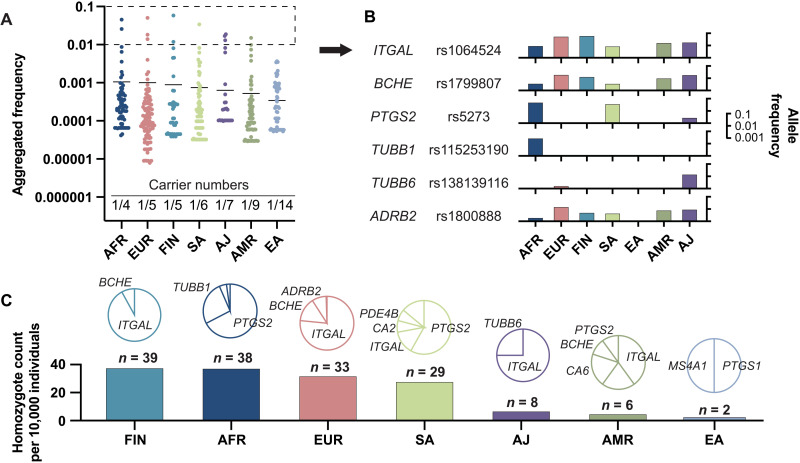
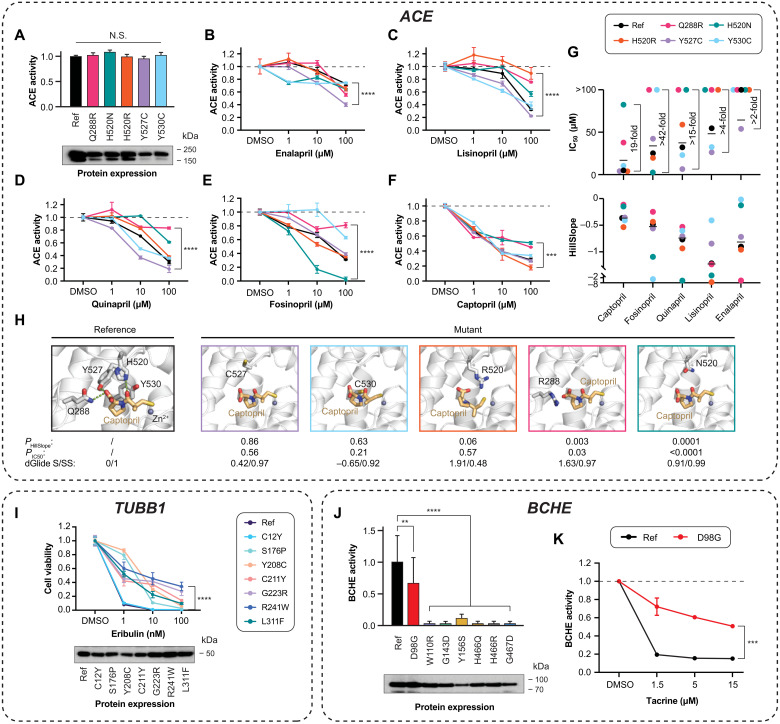
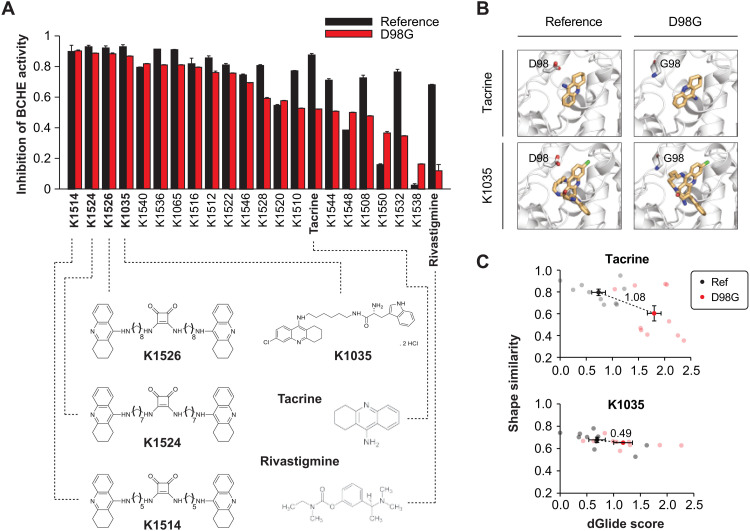
Interindividual variability in drug response constitutes a major concern in pharmacotherapy. While polymorphisms in genes involved in drug disposition have been extensively studied, drug target variability remains underappreciated. By mapping the genomic variability of all human drug target genes onto high-resolution crystal structures of drug target complexes, we identified 1094 variants localized within 6 Å of drug-binding pockets and directly affecting their geometry, topology, or physicochemical properties. We experimentally show that binding site variants affect pharmacodynamics with marked drug- and variant-specific differences. In addition, we demonstrate that a common BCHE variant confers resistance to tacrine and rivastigmine, which can be overcome by the use of derivatives based on squaric acid scaffolds or tryptophan conjugation. These findings underscore the importance of genetic drug target variability and demonstrate that integration of genomic data and structural information can inform personalized drug selection and genetically guided drug development to overcome resistance.


Figures

Fig. 1.
Fig. 1.. The genetic landscape of human drug targets.
(A) After exclusion of drugs with nonprotein or nonhuman targets or drugs targeting only specific somatic mutations, we obtained 606 genes encoding the target proteins of 1155 FDA-approved drugs, resulting in a total of 3346 unique drug-target pairs. (B) The analyzed drugs were distributed across anatomical therapeutic chemical (ATC) classifications. The most common targets were enzymes and ion channels followed by membrane receptors and structural components. (C) Column plot showing the number of target encoding genes per drug. (D) Across 138,632 individuals, we identified a total of 798,842 variants of which 479,860 were exonic. Using stringent computational assessments of pathogenicity (see Materials and Methods), 82,884 variants were identified as putatively deleterious. (E) The majority of exonic variants in drug target genes are rare with minor allele frequency (MAF) <1%. (F) Variant numbers differed >100-fold between drug targets, primarily because of differences in gene length (R2 = 0.87). Confidence bands (95%) are shown in yellow. The gene density distributions for gene length and variant number are shown across the different protein classes as histograms on top and on the right of the scatter plot, respectively.
Fig. 2.
Fig. 2.. Characterization of the genetic variability in drug-binding sites.
Only variants that affected an amino acid within 6 Å of the bound drug as determined by crystallographic data are considered. (A) High-quality structural information of the target protein complexed with the respective drug was available for 110 of 606 targets, corresponding to 638 drug-target pairs. (B) The aggregated variant frequency in binding sites is shown for the different target categories. The number of binding site variants is indicated on top of the respective columns. Note that drug-binding sites in enzymes were most variable (n = 582), whereas only few variants (n = 34) were identified in the binding sites of drugs targeting ion channels despite being similarly common drug targets (compare Fig. 1B). (C) Drug-binding site variants were most common in targets of antineoplastic drugs and drugs targeting the alimentary system, whereas variants affecting hormonal and antiparasitic medications targeting the host were very rare. Drugs targeting the most variable binding site in each category are indicated. (D) Comparison of aggregated variant frequency within and outside of drug-binding sites. (E) Overall, approximately one in six individuals (aggregated variant frequency = 17.5%) carries at least one drug-binding site variant. (F) The most frequent binding site variants and their corresponding drugs are shown. MAF, minor allele frequency; RSID, rs number. (G) For the most common variant rs1064524 in ITGAL, a PheWAS in the Estonian population identified associations with two biologically plausible phenotypes with phenome-wide significance. ATC codes are shown on the abscissa and significance as −log(P) on the ordinate. Dashed line indicates phenome-wide significance threshold after Bonferroni correction. Other variants were too rare for PheWAS analyses.
Fig. 3.
Fig. 3.. Ethnogeographic variability in human drug-binding sites.
(A) The aggregated frequencies of binding site variants is shown for every drug target across seven human populations (AFR, African; EUR, European; FIN, Finnish; SA, South Asian; AJ, Ashkenazi Jews; AMR, Latino; and EA, East Asian). The number of binding site variant carriers is shown for each population at the bottom of the plot. (B) Interethnic differences in population-specific frequencies are shown for all variants that are common (allele frequency > 1%) in at least one population. Note the considerable differences in population frequencies for most variants. (C) The number of homozygous-binding site variant carriers per 10,000 individuals is shown across ethnogeographic groups. Pie charts indicate the genes most commonly affected in the respective population.
Fig. 4.
Fig. 4.. Naturally occurring drug-binding site variability affects drug response in vitro.
Effects of binding site variants in ACE (A to H), TUBB1 (I), and BCHE (J and K) were evaluated using functional assays (see Materials and Methods). (A) None of the ACE drug-binding site variants had major impacts on ACE expression or baseline ACE activity. Data are shown as means ± SEM; n = 3. Dose-response curves of reference ACE and its variants are shown to the clinically approved ACEis enalapril (B), lisinopril (C), quinapril (D), fosinopril (E), and captopril (F). ***P < 0.001; ****P < 0 (F test). (G) The IC50 values and HillSlope coefficients are shown for each ACE variant–ACEi pair, and the largest fold change across variants is indicated for each drug. (H) Cocrystallized structure of captopril binding to ACE [Protein Data Bank (PDB) ID: 1UZF] and docking poses of captopril with the five ACE variant structures are shown. Atom color code in sticks: oxygen (red), nitrogen (blue), and sulfur (yellow). The zinc ion and hydrogen bonds are shown as violet sphere and green dashed lines, respectively. Parameters indicating the differences between wild-type and variants are shown below the structures. (I) Eribulin effect in cells transfected with reference TUBB1 or naturally occurring TUBB1 variants. Note that viability in variant carriers is strongly increased indicating eribulin resistance. (J) With the exception of D98G, drug-binding site variants in BCHE-abrogated enzymatic function (**P < 0.01; ****P < 0.0001; heteroscedastic two-tailed t test; n = 3). (K) Inhibitory effects of the cholinesterase inhibitor tacrine were strongly reduced in D98G compared to reference enzyme (***P < 0.001; F test). N.S., not significant; DMSO, dimethyl sulfoxide.
Fig. 5.
Fig. 5.. Resistance caused to drug-binding site variability can be overcome using drug derivatives.
(A) Inhibitory effect on reference and D98G BCHE were evaluated for the cholinesterase inhibitors tacrine and rivastigmine as well as 20 tacrine derivatives. Data are shown as means ± SEM; n = 4. Chemical structures of the most potent tacrine derivatives (K1504, K1524, K1526, and K1035) are shown below. Structures of tacrine and rivastigmine are shown for reference. (B) Matrix representation of reference and D98G BCHE structures interacting with tacrine (PDB ID: 4BDS) and K1035 (PDB ID: 6I0C). Note that while the positioning of tacrine is strongly altered in D98G, K1035 poses remain invariant. (C) Shape similarity and docking score (indicated by dGlide score) of the docked ligand poses in D98G compared to the cocrystallized ligands in (B). Note that the divergence of reference and variant structures (indicated by dashed lines) are considerably higher for tacrine than for K1035. Error bars represent SEM of the 10 best ligand-protein poses for both reference and D98G BCHE.

References

    1. Harrison R. K., Phase II and phase III failures: 2013–2015. Nat. Rev. Drug Discov. 15, 817–818 (2016). - PubMed
    1. Smietana K., Siatkowski M., Møller M., Trends in clinical success rates. Nat. Rev. Drug Discov. 15, 379–380 (2016). - PubMed
    1. Johnson J. A., Ethnic differences in cardiovascular drug response: Potential contribution of pharmacogenetics. Circulation 118, 1383–1393 (2008). - PMC - PubMed
    1. Porcelli S., Drago A., Fabbri C., Gibiino S., Calati R., Serretti A., Pharmacogenetics of antidepressant response. J. Psychiatry Neurosci. 36, 87–113 (2011). - PMC - PubMed
    1. Lacombe P. S., Vicente L., Pagès J. C., Morselli P. L., Causes and problems of nonresponse or poor response to drugs. Drugs 51, 552–570 (1996). - PubMed