

Resting state EEG in youth with ASD: age, sex, and relation to phenotype
- PMID: 34517813
- PMCID: PMC8439051
- DOI: 10.1186/s11689-021-09390-1
Resting state EEG in youth with ASD: age, sex, and relation to phenotype
Abstract
Background: Identification of ASD biomarkers is a key priority for understanding etiology, facilitating early diagnosis, monitoring developmental trajectories, and targeting treatment efforts. Efforts have included exploration of resting state encephalography (EEG), which has a variety of relevant neurodevelopmental correlates and can be collected with minimal burden. However, EEG biomarkers may not be equally valid across the autism spectrum, as ASD is strikingly heterogeneous and individual differences may moderate EEG-behavior associations. Biological sex is a particularly important potential moderator, as females with ASD appear to differ from males with ASD in important ways that may influence biomarker accuracy.
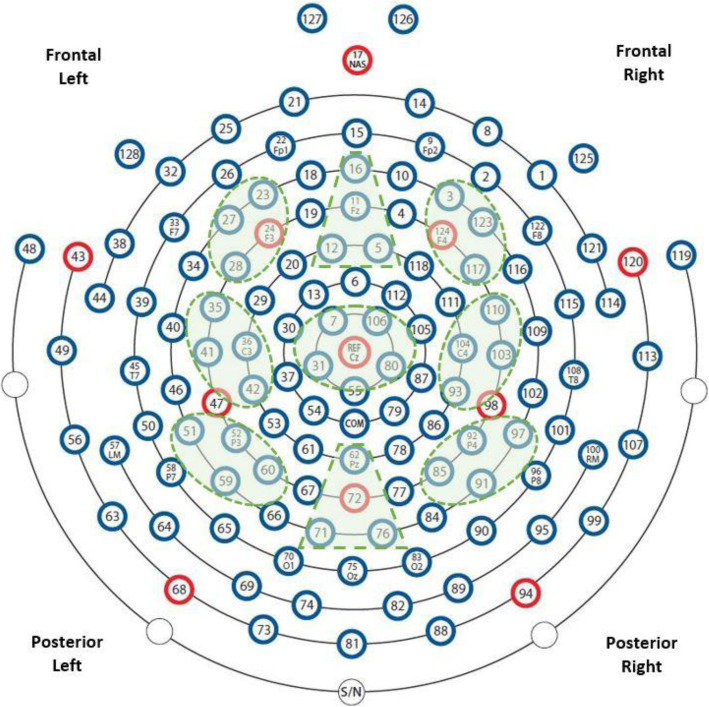
Methods: We examined effects of biological sex, age, and ASD diagnosis on resting state EEG among a large, sex-balanced sample of youth with (N = 142, 43% female) and without (N = 138, 49% female) ASD collected across four research sites. Absolute power was extracted across five frequency bands and nine brain regions, and effects of sex, age, and diagnosis were analyzed using mixed-effects linear regression models. Exploratory partial correlations were computed to examine EEG-behavior associations in ASD, with emphasis on possible sex differences in associations.
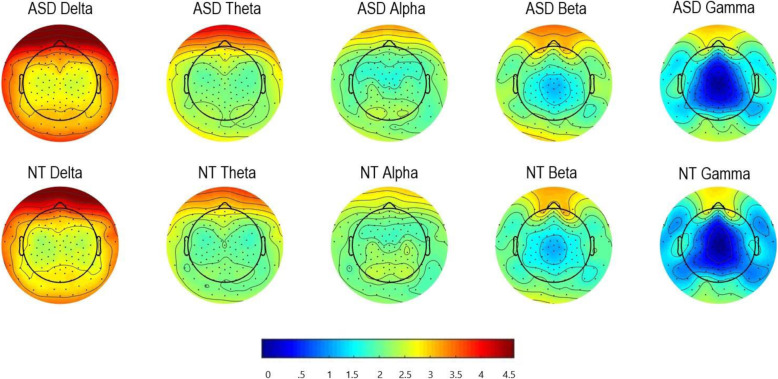
Results: Decreased EEG power across multiple frequencies was associated with female sex and older age. Youth with ASD displayed decreased alpha power relative to peers without ASD, suggesting increased neural activation during rest. Associations between EEG and behavior varied by sex. Whereas power across various frequencies correlated with social skills, nonverbal IQ, and repetitive behavior for males with ASD, no such associations were observed for females with ASD.
Conclusions: Research using EEG as a possible ASD biomarker must consider individual differences among participants, as these features influence baseline EEG measures and moderate associations between EEG and important behavioral outcomes. Failure to consider factors such as biological sex in such research risks defining biomarkers that misrepresent females with ASD, hindering understanding of the neurobiology, development, and intervention response of this important population.
Keywords: Alpha; Autism; Biomarker; EEG; Electroencephalography; Power; Resting; Sex differences.
© 2021. The Author(s).
Conflict of interest statement
James C. McPartland consults with BlackThorn Therapeutics, has received research funding from Janssen Research and Development, and receives royalties from Guilford Press, Lambert, and Springer. The remaining authors report no affiliations with or involvement in any organization or entity with any financial interest in the outcome of this project.
Figures
References
-
- American Psychiatric Association . Diagnostic and statistical manual of mental disorders. 5. Arlington, VA: Author; 2013.
-
- Levin AR, Naples AJ, Scheffler AW, Webb SJ, Shic F, Sugar CA, Murias M, Bernier RA, Chawarska K, Dawson G, Faja S, Jeste S, Nelson CA, McPartland JC, Şentürk D, and the Autism Biomarkers Consortium for Clinical Trials Day-to-day test-retest reliability of EEG profiles in children with autism spectrum disorder and typical development. Front Integr Neurosci. 2020;14:21. doi: 10.3389/fnint.2020.00021. - DOI - PMC - PubMed
-
- McPartland JC, Bernier RA, Jeste SS, Dawson G, Nelson CA, Chawarska K, et al. The Autism Biomarkers Consortium for Clinical Trials (ABC-CT): scientific context, study design, and progress toward biomarker qualification. Front Integr Neurosci. 2020;14:16. doi: 10.3389/fnint.2020.00016. - DOI - PMC - PubMed
