. 2021 Sep 21;118(38):e2102423118.
doi: 10.1073/pnas.2102423118.

TRIM28 is a transcriptional activator of the mutant TERT promoter in human bladder cancer

Affiliations

TRIM28 is a transcriptional activator of the mutant TERT promoter in human bladder cancer

Neeraj Agarwal et al. Proc Natl Acad Sci U S A. .

Abstract

Bladder cancer (BC) has a 70% telomerase reverse transcriptase (TERT or hTERT in humans) promoter mutation prevalence, commonly at -124 base pairs, and this is associated with increased hTERT expression and poor patient prognosis. We inserted a green fluorescent protein (GFP) tag in the mutant hTERT promoter allele to create BC cells expressing an hTERT-GFP fusion protein. These cells were used in a fluorescence-activated cell sorting-based pooled CRISPR-Cas9 Kinome knockout genetic screen to identify tripartite motif containing 28 (TRIM28) and TRIM24 as regulators of hTERT expression. TRIM28 activates, while TRIM24 suppresses, hTERT transcription from the mutated promoter allele. TRIM28 is recruited to the mutant promoter where it interacts with TRIM24, which inhibits its activity. Phosphorylation of TRIM28 through the mTOR complex 1 (mTORC1) releases it from TRIM24 and induces hTERT transcription. TRIM28 expression promotes in vitro and in vivo BC cell growth and stratifies BC patient outcome. mTORC1 inhibition with rapamycin analog Ridaforolimus suppresses TRIM28 phosphorylation, hTERT expression, and cell viability. This study may lead to hTERT-directed cancer therapies with reduced effects on normal progenitor cells.

Keywords: CRISPR-Cas9 KnockIn; Kinome KO screening; hTERT; promoter mutation.


Conflict of interest statement

Competing interest statement: T.R.C. is on the board of directors of Merck, Inc. and a scientific advisor to Storm Therapeutics and Eikon Therapeutics.

Figures

Fig. 1.
Fig. 1.
Allele-specific CRISPR-Cas9 mediated knock in of enhanced GFP at endogenous hTERT promoter alleles. (A) Schematic diagram of knockin strategy. LHA: left homology arm, RHA: right homology arm. (B) PCR to verify successful tagging of GFP to hTERT in selected clones. UMG12–GFP tag at mutant promoter allele, UWG6–GFP tag at WT promoter allele. Also reference SI Appendix, Fig. S1A. (C) 1.5-Kb GFP-hTERT band was gel purified and Sanger sequenced to confirm tagging at either allele. (D) Protein expression of GFP-tagged hTERT in UMG12 and UWG6 clones detected by anti-GFP antibody and mRNA expression by qRT-PCR. Also reference SI Appendix, Fig. S2 BD. (E) Transient knockdown of hTERT by siRNA. Levels of GFP-hTERT detected by anti-GFP antibody are shown. (F) GFP sgRNA-mediated KD of GFP-hTERT as measured by qRT-PCR for hTERT and GFP. NTC sgRNA was used as control for comparison. Bars represent mean ± SEM, n = 3 from independent experiments. *P value < 0.05; ***P value < 0.001. (G) 63× water images of clones. Cell tracker and Hoescht 33342 were used to stain the cytoplasm and nuclei, respectively. (H) GFP histograms for UMG12 and UWG6 cells by FACS showing GFP intensity distribution among cells within each clone at 100 d (time course shown in SI Appendix, Fig. S2E). UMUC3 is a parental cell line used to adjust the gates for unstained cells.
Fig. 2.
Fig. 2.
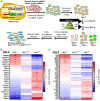
Kinome KO functional genomic screening by monitoring GFP-hTERT expression from mutant promoter allele. (A) Schematic diagram of workflow for screening. (B and C) Heat maps showing genes with altered sgRNAs in flow-sorted cell populations as indicated compared to unsorted UMG12 cells transduced with library lentivirus. *FDR < 0.1; **FDR < 0.01; ***FDR < 0.001. Also reference SI Appendix, Figs. S3–S5.
Fig. 3.
Fig. 3.
TRIM28 and TRIM24 are regulators of hTERT expression from the mutant promoter allele. After transient KD of TRIM28 with smartpool siRNA for 72 h in UMG12 and UWG6 cells, mRNA levels of (A) TRIM28 and (B) GFP-hTERT were measured by qRT-PCR. After transient KD of TRIM24 with smartpool siRNA for 72 h in UMG12 and UWG6 cells, mRNA levels of (C) TRIM24 and (D) GFP-hTERT were measured by qRT-PCR. (E and F) Representative Western blot images for siRNA KDs of TRIM28 and TRIM24 in UMG12 and UWG6 cells. GFP-hTERT was detected with anti-GFP antibody. Quantification of band intensity was done by ImageJ software. (G and H) qRT-PCR for TRIM28 and hTERT mRNA levels after smartpool siRNA-mediated transient KD of TRIM28 for 72 h in bladder cancer cell lines. (I and J) qRT-PCR for TRIM24 and hTERT mRNA levels after smartpool siRNA-mediated transient KD of TRIM24 for 72 h in bladder cancer cell lines. Also, reference SI Appendix, Fig. S6 AD. −124C > T: heterozygous hTERT promoter mutation; WT: no promoter mutation in indicated cell lines. Graphs represent mean ± SEM, n = 3 from independent experiments. *P value < 0.05; **P value < 0.01; ***P value < 0.001.
Fig. 4.
Fig. 4.
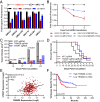
Biological and clinical relevance of TRIM28 and correlation with hTERT. (A) Effect of transient KD of TRIM28 and hTERT on in vitro monolayer growth of different cell lines. −124C > T: heterozygous hTERT promoter mutation; WT: no promoter mutation in indicated cell lines. Bars represent mean ± SEM, n = 3 from independent experiments. *P value < 0.05; ***P value < 0.001. (B) UMUC3 cells overexpressing CMV promoter–driven GFP (UMUC3-CMV-GFP) or hTERT-GFP (UMUC3-CMV-hTERT-GFP) were transiently knocked down with TRIM28 siRNA, and cell growth was monitored over 5 d post-transfection. Mock-treated cells were used as control. (C) In vivo subcutaneous tumor growth of UMUC3 cells transduced with lentivirus for either NTC, TRIM28, or hTERT sgRNAs. Box plot showing range as box and mean as line inside the box. n = 15 for each group. One-way ANOVA test was used to compare three groups and generate P values. (D) Survival curve of mice from C. Tumors reaching the limit as per IACUC guidelines were used as a cause of death. Gehan–Breslow–Wilcoxon test was used for comparison. (E) Correlation between hTERT and TRIM28 mRNA expression from bladder cancer TCGA patient datasets. Negative fold values were converted to 0. Also, reference SI Appendix, Fig. S6 J and K. (F) Kaplan–Meier curves for disease-specific survival of bladder cancer patients with high and low TRIM28 expression analyzed from TCGA datasets. Also, reference SI Appendix, Fig. S6L.
Fig. 5.
Fig. 5.
TRIM28 and TRIM24 interact and bind to mutant hTERT promoter region. (A) hTERT mRNA after double KD of TRIM28 and TRIM24 with siRNAs for 72 h. −124C > T: heterozygous hTERT promoter mutation; WT: no promoter mutation in indicated cell lines. (B) Endogenous coimmunoprecipitation (Co-IP) in UMG12 cells. Whole-cell lysates at three dilutions were incubated with TRIM28 or TRIM24 antibodies for IP. IgG antibody used as control. Coimmunoprecipitated bands are in the red box. (C) Schematic diagram of hTERT allele showing primer positions used for ChIP qRT-PCR. (D) TRIM28, TRIM24, or IgG control ChIP qRT-PCR for hTERT allele in UMG12 cells. P values were derived from differences between IgG and TRIM28 or TRIM24. (E) PCR amplification of ChIP samples as indicated. (F) Plot generated from Cistrome database showing regulatory potential of TRIM28 and TRIM24 for hTERT. (G) ChIP qRT-PCR with IgG, TRIM28, and TRIM24 antibodies in UMG12 cells transiently knocked down with GABPA and TRIM28 siRNAs for 72 h. Bars represent enrichment for hTERT mutant promoter region (−192 to −48). Graphs represent mean ± SEM, n = 3 from independent experiments. *P value < 0.05; **P value < 0.01; ***P value < 0.001. (H) Endogenous Co-IP in UMG12 cells using indicated antibodies.
Fig. 6.
Fig. 6.
mTOR mediates TRIM28 phosphorylation to induce hTERT reactivation from mutant promoter. (A) hTERT mRNA after depletion of other screen hits in UMG12 cells. 3D-cultured cells treated with (B) Ridaforolimus and (C) Doramapimod for 72 h. Also reference SI Appendix, Fig. S7E. (D) 3D-cultured cells treated with Ridaforolimus at 50 nM concentration, and hTERT mRNA measured after 72 h. −124C > T: heterozygous hTERT promoter mutation; WT: no promoter mutation in indicated cell lines. (E) Western blot images of UMG12 cells depleted of mTOR. (F) UMG12 treated with 10 µM drugs. Dimethyl sulfoxide (DMSO) used as control. (G) UMG12 cells treated with DMSO or Ridaforolimus for 72 hr were processed for ChIP qRT-PCR with IgG, TRIM28, and TRIM24. Bars represents enrichment for hTERT mutant promoter region (−192 to −48). (H) Western blot images for UMG12 cells overexpressed with TRIM28 plasmids for 96 hr. WT: no mutation, S473E S824E: Serine to Glutamic acid at 473 and 824 amino acids; S473A S824A: Serine to Alanine at 473 and 824 amino acids. UMG12 with simTOR or drug treated at 10 µM were processed for (I) cell proliferation assay and (J) soft agar assay. (Right) Representative images of soft agar colonies. Graphs represent mean ± SEM, n = 3 from independent experiments. *P value < 0.05; **P value < 0.01; ***P value < 0.001.
Fig. 7.
Fig. 7.
RNA-seq analysis supports the signaling pathway involving hTERT, TRIM28, TRIM24, and mTOR. (A) Levels of hTERT and GFP transcripts from RNA-seq data with KD of indicated genes in UMG12 cells. *P value < 0.05; **P value < 0.01; ***P value < 0.001. (B) Hierarchical clustering of 25 most up-regulated and 25 most down-regulated genes in each replicate of Mock, TRIM28 KD, and TRIM24 KD UMG12 cells. (C) Heat map of diseases and biofunctions pathways altered in all three comparisons with Z-score more than ±2 in at least one comparison. (D) Model diagram of proposed mechanism for regulation of hTERT reactivation from mutant hTERT promoter.

Comment in

  • Uro-Science.
    Atala A. Atala A. J Urol. 2022 Jun;207(6):1341-1342. doi: 10.1097/JU.0000000000002656. Epub 2022 Mar 18. J Urol. 2022. PMID: 35300509 No abstract available.

References

    1. Hanahan D., Weinberg R. A., Hallmarks of cancer: The next generation. Cell 144, 646–674 (2011). - PubMed
    1. Colebatch A. J., Dobrovic A., Cooper W. A., TERT gene: Its function and dysregulation in cancer. J. Clin. Pathol. 72, 281–284 (2019). - PubMed
    1. Akincilar S. C., Unal B., Tergaonkar V., Reactivation of telomerase in cancer. Cell. Mol. Life Sci. 73, 1659–1670 (2016). - PMC - PubMed
    1. Hrdlicková R., Nehyba J., Bose H. R. Jr, Alternatively spliced telomerase reverse transcriptase variants lacking telomerase activity stimulate cell proliferation. Mol. Cell. Biol. 32, 4283–4296 (2012). - PMC - PubMed
    1. Listerman I., Sun J., Gazzaniga F. S., Lukas J. L., Blackburn E. H., The major reverse transcriptase-incompetent splice variant of the human telomerase protein inhibits telomerase activity but protects from apoptosis. Cancer Res. 73, 2817–2828 (2013). - PMC - PubMed

Publication types

MeSH terms