. 2021 Oct 15;207(8):2027-2038.
doi: 10.4049/jimmunol.2100175. Epub 2021 Sep 13.

RORγt Promotes Foxp3 Expression by Antagonizing the Effector Program in Colonic Regulatory T Cells

Affiliations

RORγt Promotes Foxp3 Expression by Antagonizing the Effector Program in Colonic Regulatory T Cells

Suniti Bhaumik et al. J Immunol. .

Abstract

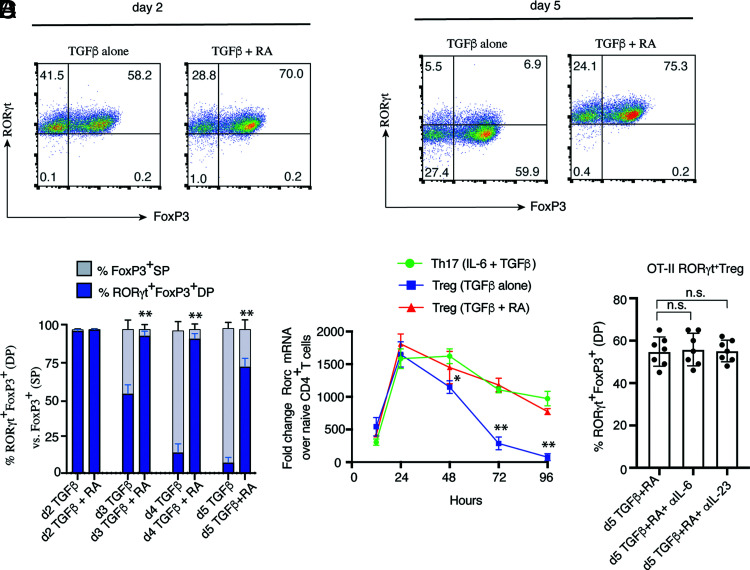
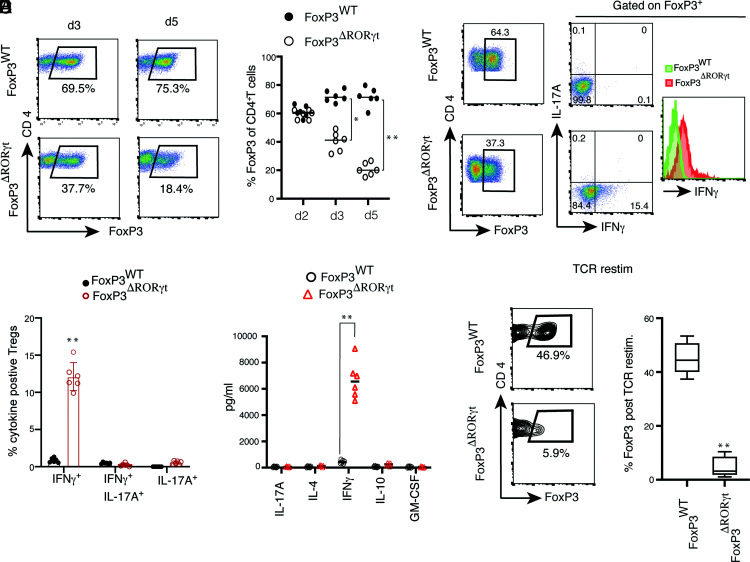
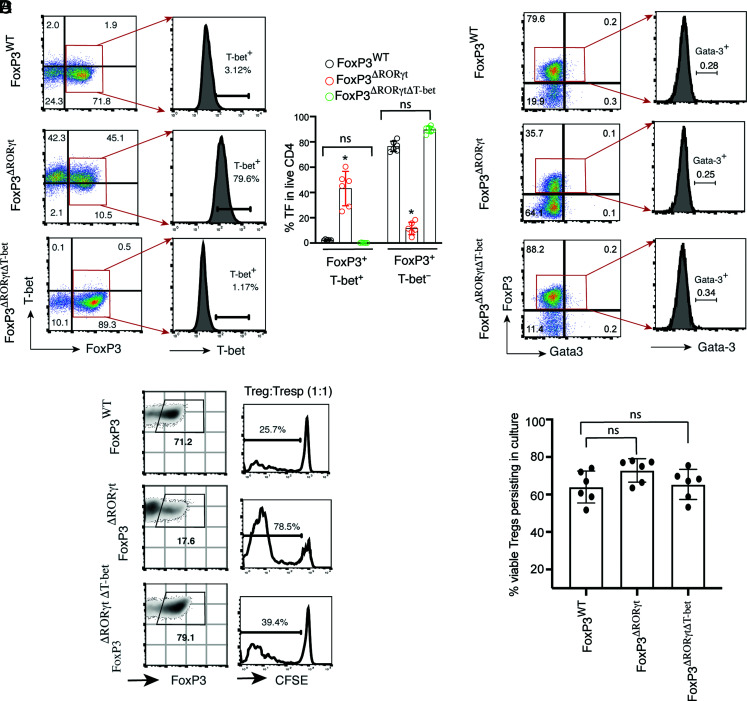
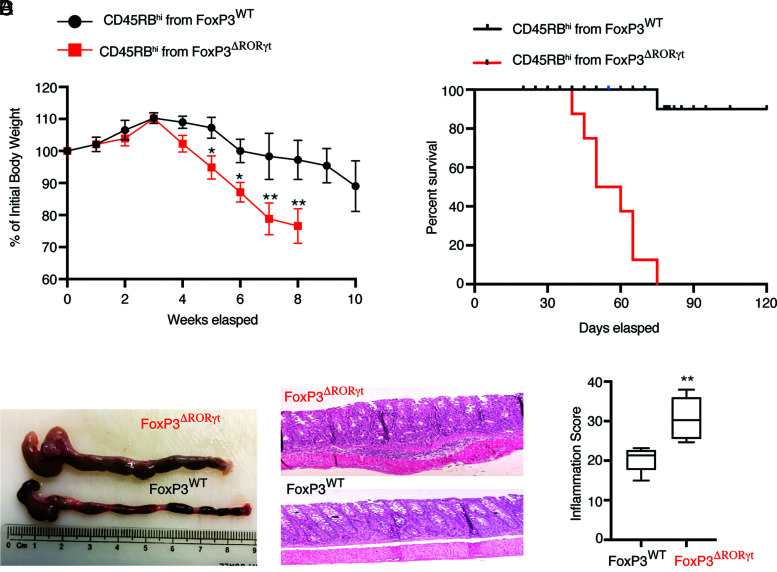
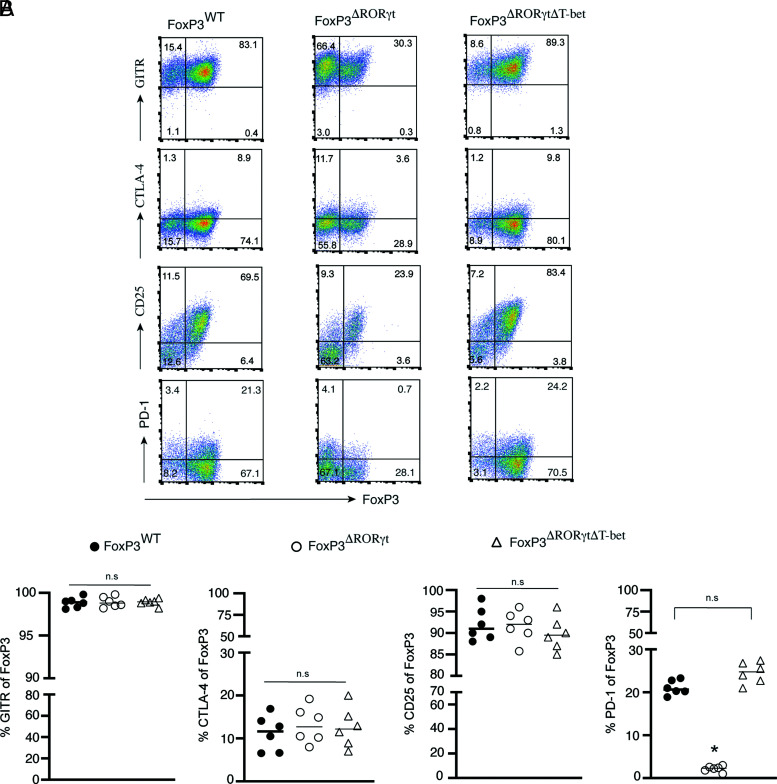
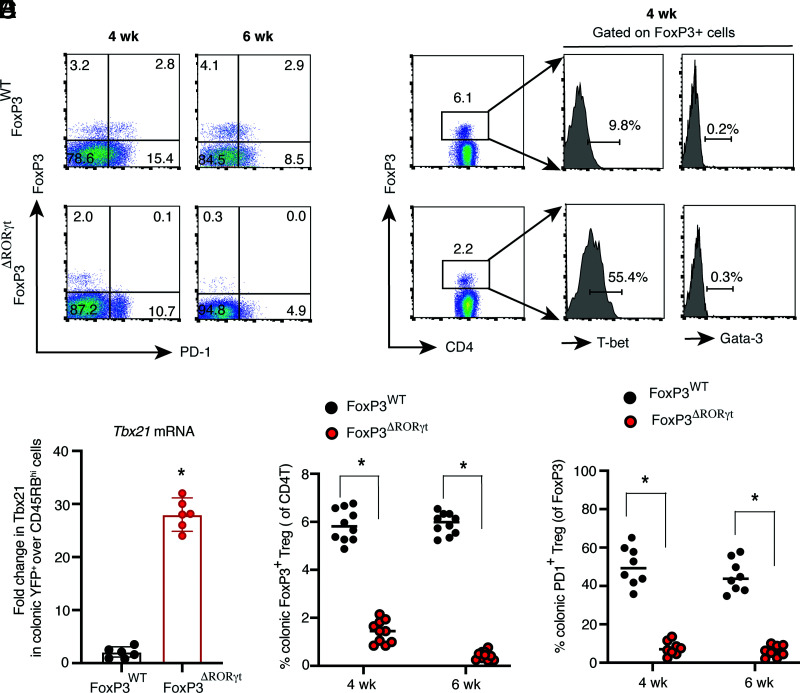
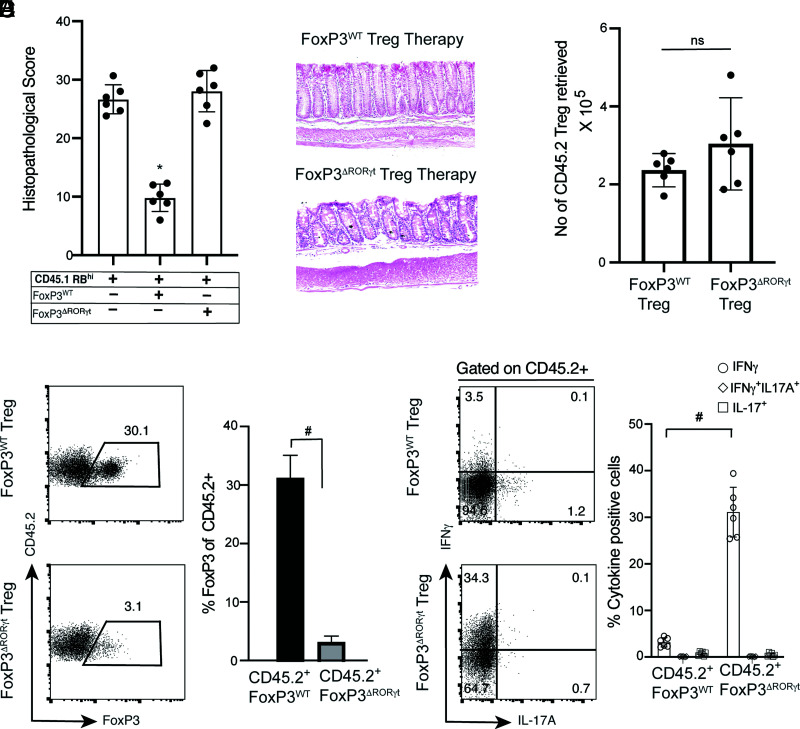
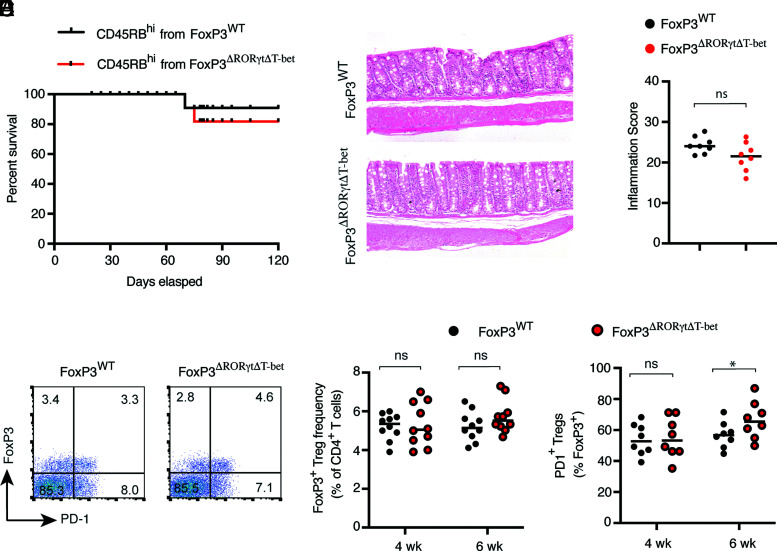
RORγt is the master transcription factor for the Th17 cells. Paradoxically, in the intestine, RORγt is coexpressed in peripherally induced regulatory T cells (pTregs) together with Foxp3, the master transcription factor for Tregs. Unexpectedly, by an unknown mechanism, colonic RORγt+ Tregs show an enhanced suppressor function and prevent intestinal inflammation more efficiently than RORγt-nonexpressing pTregs. Although studies have elucidated the function of RORγt in Th17 cells, how RORγt regulates pTreg function is not understood. In our attempt to understand the role of RORγt in controlling Treg function, we discovered a RORγt-driven pathway that modulates the regulatory (suppressor) function of colonic Tregs. We found that RORγt plays an essential role in maintaining Foxp3 expression. RORγt-deficient Tregs failed to sustain Foxp3 expression with concomitant upregulation of T-bet and IFN-γ expressions. During colitis induced by adoptive transfer of CD45RBhi cells in Rag1 -/- mice, RORγt-deficient colonic Tregs transitioned to a Th1-like effector phenotype and lost their suppressor function, leading to severe colitis with significant mortality. Accordingly, Foxp3-expressing, RORγt-deficient Tregs showed impaired therapeutic efficacy in ameliorating colitis that is not due to their reduced survival. Moreover, using the Treg-specific RORγt and T-bet double-deficient gene knockout mouse, we demonstrate that deletion of T-bet from RORγt-deficient Tregs restored Foxp3 expression and suppression function as well as prevented onset of severe colitis. Mechanistically, our study suggests that RORγt-mediated repression of T-bet is critical to regulating the immunosuppressive function of colonic Tregs during the inflammatory condition.


Conflict of interest statement

The authors have no financial conflicts of interest.

Figures

FIGURE 1.
FIGURE 1.
Dual signaling by TGF-β and RA is necessary for the generation of RORγt+ Tregs in vitro. (A) Sorted naive WT CD4+ T cells were differentiated under Treg conditions either with TGF-β alone or TGF-β plus all-trans RA in presence of plate-bound αin pCD3 and soluble anti-CD28 and analyzed for Foxp3 and RORγt expression on day 2 (left) and day 5 (right) by flow cytometry. (B) Bar diagram represents percentage RORγt+Foxp3+ double-positive (DP) versus Foxp3+ single-positive (SP) cells in Tregs differentiated in presence of TGF-β with or without RA. Expression of RORγt and Foxp3 were observed from day 2 until day 5 of Treg culture by flow cytometry (n = 6). (C) RORγt transcripts were analyzed by real-time RT-PCR from Tregs differentiated under Treg conditions (TGF-β alone or TGF-β with RA) and under Th17 conditions (n = 6). (D) Sorted naive CD4+ T cells from OT-II transgenic mice were differentiated under Treg conditions with TGF-β plus RA in presence of irradiated APCs, mixed at a ratio of 1:5 (T cells/APCs), and OVA peptide (323-339) with or without anti–IL-6 and anti–IL-23 neutralizing Ab (10 μg/ml) and analyzed for Foxp3 and RORγt expression at day 5 by flow cytometry (n = 7). Bar diagrams represent percentage of Foxp3 and RORγt coexpressing Tregs. For FACS analysis in (A) and (B), cells were gated on live CD4+ T cells. Data in (B)–(D) are shown as mean ± SEM. Data are representative (or pooled results) of two or more independent experiments. For p values, two-tailed unpaired Student t test was used in (B); one-way ANOVA followed by Tukey post hoc test was used for (C) and (D). *p < 0.01, **p < 0.001. n.s, not significant.
FIGURE 2.
FIGURE 2.
RORγt represses IFN-γ induction and is critical for maintenance of Foxp3 during Treg differentiation. (A) Naive CD4+ T cells from Foxp3YFP-Cre (Foxp3WT) and Foxp3YFP-Cre.Rorcfl/fl (Foxp3ΔRORγt) mice were differentiated in vitro under Treg conditions in presence of plate-bound anti-CD3 and soluble anti-CD28 stimulation and analyzed for Foxp3 and CD4 expressions on day 3 and day 5. For flow cytometric analysis, cells were gated on live CD4+ T cells. (B) Kinetics of maintenance of Foxp3+ cells in Treg culture from the two above-mentioned groups (n = 6). (C and D) Expression of IL-17A and IFN-γ from gated Foxp3-expressing cells of WT and RORγt-deficient Tregs. Naive CD4+ T cells from Foxp3YFP-Cre and Foxp3YFP-Cre.Rorcfl/fl mice were differentiated under Treg conditions and analyzed for CD4, IL-17A, IFN-γ, and Foxp3 following PMA and ionomycin stimulation on day 3, as shown in representative FACS plots (C) and bar diagram showing frequencies of IL-17A+, IFN-γ+, and IL-17A+ IFN-γ+ cells from two above-mentioned groups of Tregs (D). (E) Cytokine ELISA from culture supernatants of RORγt-sufficient and -deficient in vitro–differentiated Tregs at day 4 (n = 6). (F) TCR restimulation of in vitro–generated Foxp3+ Tregs analyzed for retention of Foxp3 expression, as shown in representative contour FACS plots and bar diagrams (n = 7). Data in (B) and (D)–(F) are shown as mean ± SEM. Data are representative of, or pooled from, two or more independent experiments. For p values, the two-tailed unpaired Student t test was used in (D)–(F). *p < 0.01, **p < 0.001.
FIGURE 3.
FIGURE 3.
Deletion of T-bet restores Foxp3 expression and suppressor function of RORγt-deficient Foxp3+ Tregs. (A) Naive CD4+ T cells from Foxp3YFP-Cre, Foxp3YFP-Cre.Rorcfl/fl, and Foxp3YFP-Cre.Rorcfl/fl.Tbx21fl/fl (Foxp3ΔRORγtΔT-bet) mice were differentiated under Treg conditions and analyzed for expression of Foxp3 and T-bet in gated live CD4+ T cells, as shown by representative FACS plots (left); T-bet expression in Foxp3+ cells, as shown in the histograms (middle); and percentage Foxp3+T-bet+ versus Foxp3+Tbet cells in Tregs from the three indicated groups (right; n = 6). (B) Analysis of Foxp3 and Gata-3 expressions in gated live CD4+ T cells from the three indicated Treg groups, as shown by representative FACS plots (left), and expression of Gata-3 in gated Foxp3+ cells shown by histograms (right). (C) For suppression assay, YFP+ (Foxp3+) cells from in vitro–differentiated Tregs of the three groups were sorted on day 5 (left), incubated with CFSE-labeled responder cells (CD45.1+) at a 1:1 ratio for 72 h in presence of plate-bound anti-CD3 and soluble anti-CD28 stimulation, and assayed for proliferation of CFSE-labeled responder cells by flow cytometry (right). (D) Measurement of percentage viable Tregs present in the culture when incubated with CFSE-labeled CD45.1+ responder cells (1:1) for suppression assay after 72 h (n = 6). Data in (A) and (D) are shown as mean ± SEM. Data are representative of at least two independent experiments. For p values, two-tailed unpaired Student t test used in (A), and one-way ANOVA followed by Tukey post hoc test used in (D). *p < 0.001. n.s, not significant.
FIGURE 4.
FIGURE 4.
Treg-specific deletion of RORγt causes severe colitis with high mortality. Sorted naive CD45RBhiCD4+ T cells (4 × 10⁵ per mouse i.p.) from Foxp3WT and Foxp3ΔRORγt mice were adoptively transferred to Rag1−/− recipient mice for colitis induction. (A) Kinetics of loss of body weight expressed as a percentage of starting weight (left) and survival kinetics (right) of the two indicated groups of Rag1−/− recipients. (B, C, and D) Dissected colons (B), representative histopathology of H&E-stained colonic sections (original magnification ×40) (C), and inflammation score (D) at 6 wk post–adoptive transfer in two indicated groups of Rag1−/− recipient mice. Data in (A) and (D) are shown as mean ± SEM. Data are representative of three independent experiments (n = 8–10 per group). For p values, two-way ANOVA with Bonferroni post hoc test used in (A), Mann–Whitney U test used in (D). *p < 0.01, **p < 0.001.
FIGURE 5.
FIGURE 5.
PD-1 is downregulated in RORγt-deficient Tregs in a T-bet–dependent manner. Naive CD4+ T cells sorted from Foxp3WT, Foxp3ΔRORγt, and Foxp3ΔRORγtΔT-bet mice, were differentiated under Treg conditions and analyzed for surface expression of GITR, CD25, PD1, and both surface and intracellular expression of CTLA-4 along with Foxp3 gated on live CD4+ T cells at day 4 by flow cytometry, as shown in representative FACS plots (A) and scatterplots showing the percentage expression of GITR, CTLA-4, CD25, and PD-1 in gated Foxp3-expressing cells of the indicated groups (B). Data in (B) are shown as mean ± SEM (n = 6). Data are representative of two independent experiments. For p values, one-way ANOVA followed by Tukey post hoc test used in (B). *p < 0.001. n.s, not significant.
FIGURE 6.
FIGURE 6.
Colonic RORγt-deficient Tregs fail to maintain Foxp3 with high T-bet and low PD-1 expression during colitis. (A) Analysis of Foxp3 and PD-1 expression in colonic CD4+ LP cells obtained from two indicated groups of Rag1−/− recipients that received CD45RBhi Foxp3WT or Foxp3ΔRORγt CD4+ T cells at 4 wk and 6 wk post-transfer by flow cytometry. (B) Expression of T-bet and Gata-3 in colonic Foxp3+ cells from the two indicated groups of Rag1−/− recipients. (C) Tbx21 mRNA expression from sorted, live colonic YFP+ CD4+ T cells from the two indicated groups of Rag1−/− mice at 6 wk post-transfer (n = 6). (D) Frequency of colonic Foxp3+ Tregs in the two indicated Rag1−/− recipient groups at 4 wk and 6 wk post-transfer (n = 10 per group). (E) Frequency of PD-1–expressing colonic Foxp3+ Tregs in the two indicated groups of Rag1−/− recipients (n = 8 per group). Data in (C)–(E) are shown as mean ± SEM. Data are representative of three independent experiments (D and E) or pooled from two independent experiments (C). For p values, two-tailed unpaired Student t test used in (C)–(E). *p < 0.0001.
FIGURE 7.
FIGURE 7.
Treg therapy with RORγt-deficient Tregs fails to ameliorate colitis. CD45.1+CD45RBhi CD4+ T cell recipient Rag1−/− mice (4 × 10⁵ cells per mouse) were treated with in vitro–differentiated CD45.2+ Foxp3WT or Foxp3ΔRORγt Tregs (5 × 10⁵ Tregs per mouse) at 2 wk after naive CD45.1+CD4+ T cell transfer. (A) Histopathological scores of colonic tissue sections at 8 wk post-transfer from the three indicated naive CD45.1+CD4+ T cell recipient Rag1−/− groups where two recipient groups received CD45.2+ Treg therapy. (B) Representative histopathology of H&E-stained colonic sections of CD45.1+CD45RBhi Rag1−/− recipients treated with either Foxp3WT or Foxp3ΔRORγt Tregs. (C) Quantitation of total number of retrieved CD45.2+ cells (original magnification ×40) from colonic LP of Foxp3WT or Foxp3ΔRORγt Treg-treated Rag1−/− recipient groups, as indicated (n = 6). (D) Representative FACS plots (left) and bar diagram (right) showing percentage Foxp3 expression in gated CD45.2 compartment from the two indicated Treg-treated Rag1−/− recipient groups. (E) Representative FACS plots (left) and bar diagram showing percentage IFN-γ– and IL-17–expressing cells in gated CD45.2 compartment from the two indicated Treg-treated Rag1−/− recipient groups. Data (C, D, and E) are shown as mean ± SEM. Data in (A)–(E) are representative of two independent experiments (n = 8–10 per group). For p values, Kruskal–Wallis test was used in (A), and the two-tailed unpaired Student t test was used in (C)–(E). *p < 0.005, #p < 0.0001. n.s, not significant.
FIGURE 8.
FIGURE 8.
Deletion of T-bet from RORγt-deficient Tregs ameliorates colitis with low mortality. Sorted naive CD45RBhi cells from Foxp3WT and Foxp3ΔRORγtΔT-bet mice were adoptively transferred to Rag1−/− recipient mice for colitis induction. (A) Survival kinetics of the two indicated groups of Rag1−/− recipients. (B and C) Representative histopathology of H&E-stained colonic sections (original magnification ×40) and inflammation score of colonic tissue sections at 6 wk post–adoptive transfer from two indicated groups of Rag1−/− recipient mice. (D) Representative FACS plot showing Foxp3 and PD-1 expressions in colonic CD4+ LP cells obtained from the two indicated groups of Rag1−/− recipients at 6 wk post-transfer. (E and F) Frequency of Foxp3+ cells in colonic CD4+ T cells (E) and frequency of PD-1–expressing cells in colonic Foxp3+ Tregs from the two indicated groups of Rag1−/− mice (F) at 4 and 6 wk post-transfer. Data (C, E, and F) are shown as mean ± SEM. Data are representative of three or more independent experiments (n = 8–10 per group). For p values, Mann–Whitney U test was used in (C), and two-tailed unpaired Student t test was used in (E) and (F). *p < 0.05. n.s, not significant.

References

    1. Dominguez-Villar M., Hafler D. A.. 2018. Regulatory T cells in autoimmune disease. Nat. Immunol. 19: 665–673. - PMC - PubMed
    1. Sakaguchi S., Vignali D. A., Rudensky A. Y., Niec R. E., Waldmann H.. 2013. The plasticity and stability of regulatory T cells. Nat. Rev. Immunol. 13: 461–467. - PubMed
    1. Himmel M. E., Yao Y., Orban P. C., Steiner T. S., Levings M. K.. 2012. Regulatory T-cell therapy for inflammatory bowel disease: more questions than answers. Immunology 136: 115–122. - PMC - PubMed
    1. Kaser A., Zeissig S., Blumberg R. S.. 2010. Inflammatory bowel disease. Annu. Rev. Immunol. 28: 573–621. - PMC - PubMed
    1. Haribhai D., Lin W., Edwards B., Ziegelbauer J., Salzman N. H., Carlson M. R., Li S. H., Simpson P. M., Chatila T. A., Williams C. B.. 2009. A central role for induced regulatory T cells in tolerance induction in experimental colitis. J. Immunol. 182: 3461–3468. - PMC - PubMed

Publication types

MeSH terms

Substances