. 2021 Nov 15;27(22):6235-6249.
doi: 10.1158/1078-0432.CCR-21-0971. Epub 2021 Sep 13.

FLT3L Release by Natural Killer Cells Enhances Response to Radioimmunotherapy in Preclinical Models of HNSCC

Affiliations

FLT3L Release by Natural Killer Cells Enhances Response to Radioimmunotherapy in Preclinical Models of HNSCC

Thomas E Bickett et al. Clin Cancer Res. .

Abstract

Purpose: Natural killer (NK) cells are type I innate lymphoid cells that are known for their role in killing virally infected cells or cancer cells through direct cytotoxicity. In addition to direct tumor cell killing, NK cells are known to play fundamental roles in the tumor microenvironment through secretion of key cytokines, such as FMS-like tyrosine kinase 3 ligand (FLT3L). Although radiotherapy is the mainstay treatment in most cancers, the role of radiotherapy on NK cells is not well characterized.

Experimental design: This study combines radiation, immunotherapies, genetic mouse models, and antibody depletion experiments to identify the role of NK cells in overcoming resistance to radiotherapy in orthotopic models of head and neck squamous cell carcinoma.

Results: We have found that NK cells are a crucial component in the development of an antitumor response, as depleting them removes efficacy of the previously successful combination treatment of radiotherapy, anti-CD25, and anti-CD137. However, in the absence of NK cells, the effect can be rescued through treatment with FLT3L. But neither radiotherapy with FLT3L therapy alone nor radiotherapy with anti-NKG2A yields any meaningful tumor growth delay. We also identify a role for IL2 in activating NK cells to secrete FLT3L. This activity, we show, is mediated through CD122, the intermediate affinity IL2 receptor, and can be targeted with anti-CD25 therapy.

Conclusions: These findings highlight the complexity of using radio-immunotherapies to activate NK cells within the tumor microenvironment, and the importance of NK cells in activating dendritic cells for increased tumor surveillance.


Conflict of interest statement

Conflict of interests: The authors declare no potential conflicts of interest.

Figures

Figure 1
Figure 1
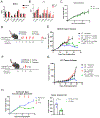
(A) Bulk RNAseq data from MOC2 and LY2 tumors showing the expression levels of Qa-1b 7 days after RT in the MOC2 model and 10 days after RT in the LY2 model; n=4. (B) Tumor volumes in mice bearing MOC2 and Ly2 tumors treated with RT and anti-NKG2A and either depleted or not depleted of NK cells; n=7. (C) Flow Cytometric analysis of NK cell populations in MOC2 tumors 3 days after RT and anti-NKG2A therapy shown as frequency of parent population; n=6. (D) Flow Cytometric analysis of DC populations in MOC2 tumors and ELISA analysis of FLT3L levels in serum 3 days after RT and anti-NKG2A therapy; n=6. (E) Flow Cytometric analysis of effector T cell populations in MOC2 tumors 3 days after RT and anti-NKG2A therapy; n=6.
Figure 2
Figure 2
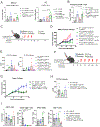
(A) Bulk RNAseq analysis of MOC2 tumors showing IL-15, IL-15RA, IL-2, IL-2RA, IL-2RB, FLT3L, and FLT3RA production in MOC2 tumors 7 days after RT; n=4. (B) Bulk RNAseq analysis of LY2 tumors showing IL-15, IL-15RA, IL-2, IL-2RA, IL-2RB, FLT3L, and FLT3RA production in LY2 tumors 10 days after RT; n=4. (C) MOC2 tumor volumes of mice treated with RT (8 Gy) on days 9, 18, and 22 with FLT3L HDT therapy starting on day 11; n=7. (D) Schematic of MOC2 experiment in C57BL/6 mice depicts days of 8 Gy RT (red lightning bolts), beginning of antibody therapy at day 4 (blue arrow), and FLT3L therapy at day 18 (i.p. injection daily for 10 days) (green arrow); n=7. (E) MOC2 tumor volumes of C57BL/6 mice treated with RT and isotype control (black line), anti-CD137 and anti-CD25 (blue line), anti-CD137 and anti-CD25 with NK cells depleted (red line), and anti-CD137 and anti-CD25 with NK cells depleted plus FLT3L therapy (green line); n=7. (F) Schematic of LY2 experiment in BALB/c mice depicts 10 Gy of RT at day 9 (red lightning bolt), beginning of antibody therapy at day 5 (blue arrow), and FLT3L therapy at day 10 (Hydrodynamic injection) (green arrow). (G) LY2 tumor volumes of BALB/c mice after treatment with RT and isotypes (black line), anti-CD25 (blue line), anti-CD25 with NK cells depleted (red line), anti-CD25 with NK cells depleted plus FLT3L HDT therapy (green line); n=7. (H) Tumor volumes on days 6, 12, 15, 19 (left panel) and on day 19 (right panel) in wild type C57BL/6 (green line) and FLT3L knockout (blue symbols) mice treated twice weekly with RT + anti-CD25 + anti-CD137 and 8 Gy buccal irradiation on days 8, 12, and 15; ****p≤0.0001; n=7.
Figure 3
Figure 3
(A) Flow Cytometric analysis of CD103+ DC populations in MOC2 and LY2 tumors. MOC2 tumors were taken 3 days after RT, NK cell depletion, and FLT3L therapy. LY2 tumors were taken 9 days post RT, anti-CD25, and FLT3L HDT; *p≤0.1 **p≤0.05 n=6. (B) Flow Cytometric analysis of CD8 T cell populations in MOC2 tumors 24 days after RT and 10 days after the start of FLT3L therapy; *p≤0.1, **p≤0.05; n=5. (C) Schematic of experimental procedure for CD4 and CD8 T cell depletion in C57BL/6 mice bearing MOC2 tumors depicts days of administration of 8 Gy RT (red lightning bolt), beginning of antibody therapy (blue arrow), and FLT3L HDT therapy (green arrow). (D) MOC2 Tumor volumes of C57BL/6 and RAG−/− mice treated with RT, anti-CD25, anti-CD137, and depleted of NK cells (black line), treated with FLT3L HDT therapy (green line) and depleted of CD4 T cells (blue line), CD8 T cells (red line), and RAG−/− mice devoid of CD4 and CD8 T cells (pink line); n=7. (E) FLT3L and IL-15 levels in serum of T cell-depleted (ELISA); n=6. (F) Schematic of experimental procedure involving WT C57BL/6 and BATF3−/− mice to be treated with RT, anti-CD25, anti-CD137, depleted of NK cells, and FLT3L HDT therapy depicts days of RT (red lightning bolt), beginning of antibody therapy (blue arrow), and FLT3L HDT therapy (green arrow). (G) MOC2 tumor volumes of WT C57BL/6 mice treated with RT, anti-CD25, and anti-CD137 (black line), NK cell depletion and FLT3L HDT therapy (green line), and BATF3−/− mice treated with RT, anti-CD25, anti-CD137, NK cell depletion, and FLT3L HDT therapy (blue line); n=7. (H) FLT3L serum levels (ELISA) in WT C57BL/6 mice and BATF3−/− mice treated with RT, anti-CD25, anti-CD137, NK cell depletion, and FLT3L HDT therapy; N=5. (I) Flow cytometric analysis of CD4 and CD8 T cell populations in tumors of WT C57BL/6 mice and BATF3−/− mice treated with RT, anti-CD137, anti-CD25, NK cell depletion, and FLT3L HDT therapy; n=5.
Figure 4
Figure 4
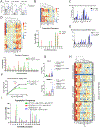
(A) Flow Cytometric analysis of NK cell populations in MOC2 tumors 3 days after start of treatment with 10 Gy RT, anti-CD25, anti-CD137, compared to RT alone.; *p≤0.1, **p≤0.05; n=5. (B) FlowSOM clustering of raw flow cytometry of NK cell populations in LY2 tumors treated with 10 Gy RT and either isotype antibody or anti-CD25 antibody. Tumors were taken 8 days after RT; *p≤0.1, **p≤0.05; n=5. (C) Flow Cytometry of NK cells in blood of LY2 tumor-bearing BALB/c mice taken 8 days after 10 Gy RT; *p≤0.1, **p≤0.05; n=5. (D) FlowSOM clustering of raw flow cytometry of NK cell populations in MOC2 tumors treated with 10 Gy RT and anti-CD137 antibody with and without anti-CD25 antibody. Tumors were taken 13 days after RT; *p≤0.05; n=5. (E) Flow cytometry of NK cells in blood of MOC2-bearing C57BL/6 mice taken 13 days after 10 gy RT; *p≤0.05; n=5. (F) Tumor volumes of MOC2 tumors from DEREG mice treated with 10 Gy RT, anti-CD137, and diphtheria toxin (DT) (black line) or treated with RT, anti-CD25, anti-CD137, and diphtheria toxin (DT) (green line); n=7. (G) Flow cytometry of NK cell populations in blood from WT C57BL/6 mice treated with 10 Gy RT, anti-CD25, and anti-CD137 and from DEREG mice treated with 10 Gy RT, anti-CD25, anti-CD137, and diphtheria toxin (DT); *p≤0.05; n=5. (H) Heatmap depicting the 14 populations of NK cells identified by FlowSOM, and the relative expression of markers of those populations in WT C57BL/6 mice treated with RT, anti-CD25, and anti-CD137 and in DEREG mice treated with RT, anti-CD137, and diphtheria toxin (DT) or treated with 10 Gy RT, anti-CD25, anti-CD137, and diphtheria toxin (DT); n=5. (I) Frequency of populations identified by FlowSOM in C57BL/6 mice treated with 10 Gy RT, anti-CD25, and anti-CD137 and in DEREG mice treated with 10 Gy RT, anti-CD137, and diphtheria toxin (DT) or treated with RT, anti-CD25, anti-CD137, and diphtheria toxin (DT); n=5.
Figure 5
Figure 5
(A) Percent killing of MOC2 tumor cells in vitro by NK cells harvested from the spleens of C57BL/6 mice by negative selection; n=5. (B) Flow cytometric analysis of in vitro NK cell populations; *p≤0.05, **p≤0.01; n=5. (C) Expression of CD122 and IL-2RB on NK cells treated in vitro; n=5. (D) Quantitation of IL-2 in the supernatant of isolated NK cells stimulated with or without anti-CD25; n=6. (E) Western blot of immunoprecipitated CD122 probed with anti-phosphotyrosine. CD122 was immunoprecipitated from NK cells isolated from C57BL/6 mice and stimulated with anti-CD25 and IL-2 as indicated. (F) Concentrations of IL-2 in serum of C57BL/6 mice; *p≤0.05; n=6. (G) Concentration of FLT3L in the supernatant of NK cells stimulated with exogenous IL-2 (ELISA) as indicated; *p≤0.05, ***p≤0.001; n=6. (H) Volumes of MOC2 tumors in mice treated with RT, anti-CD25, anti-CD137, and FLT3L hydrodynamic delivery; n=7.
Figure 6
Figure 6
(A) Overall survival of patients with high expression of both FLT3LG and FLT3 to patients with low expression of FLT3LG/FLT3. (B) Waterfall plot showing KEGG pathways upregulated in patients with high expression of both FLT3 and FLT3LG. all pathways displayed are top 15 pathways and have calculated adjusted p<0.001 as generated by fgsea. (C) Schematic depicting the interaction between NK cells, DCs, and Tregs in the TME and the cytokines that govern their interactions. In both the LY2 and MOC2 models NK cells are key, as the effect of therapy is removed upon their depletion, and can be rescued by FLT3L therapy. NK cells can be stimulated by IL-2, and play a critical role in producing FLT3L to activate DCs. DCs, once activated by FLT3L, increase tumor surveillance and T cell activation. Tregs play a negative role through IL-2 sequestration.

Similar articles

Cited by

References

    1. Nör JE, Gutkind JS. Head and Neck Cancer in the New Era of Precision Medicine. J Dent Res (2018) 97:601–602. doi:10.1177/0022034518772278 - DOI - PubMed
    1. Mandal R, Şenbabaoğlu Y, Desrichard A, Havel JJ, Dalin MG, Riaz N, Lee K-W, Ganly I, Hakimi AA, Chan TA, et al. The head and neck cancer immune landscape and its immunotherapeutic implications. JCI Insight (2016) 1:1–18. doi:10.1172/jci.insight.89829 - DOI - PMC - PubMed
    1. Oweida A, Lennon S, Calame D, Korpela S, Bhatia S, Sharma J, Graham C, Binder D, Serkova N, Raben D, et al. Ionizing radiation sensitizes tumors to PD-L1 immune checkpoint blockade in orthotopic murine head and neck squamous cell carcinoma. Oncoimmunology (2017) 6:1–10. - PMC - PubMed
    1. Karam SD, Raben D. Radioimmunotherapy for the treatment of head and neck cancer. Lancet Oncol (2019) 20:e404–e416. doi:10.1016/S1470-2045(19)30306-7 - DOI - PubMed
    1. Oweida A, Hararah MK, Phan A, Binder D, Bhatia S, Lennon S, Bukkapatnam S, Van Court B, Uyanga N, Darragh L, et al. Resistance to radiotherapy and PD-L1 blockade is mediated by TIM-3 upregulation and regulatory T-cell infiltration. Clin Cancer Res (2018) 24:5368–5380. doi:10.1158/1078-0432.CCR-18-1038 - DOI - PMC - PubMed

Publication types