. 2021 Sep 28;118(39):e2108909118.
doi: 10.1073/pnas.2108909118.

Model-driven mitigation measures for reopening schools during the COVID-19 pandemic

Affiliations

Model-driven mitigation measures for reopening schools during the COVID-19 pandemic

Ryan Seamus McGee et al. Proc Natl Acad Sci U S A. .

Abstract

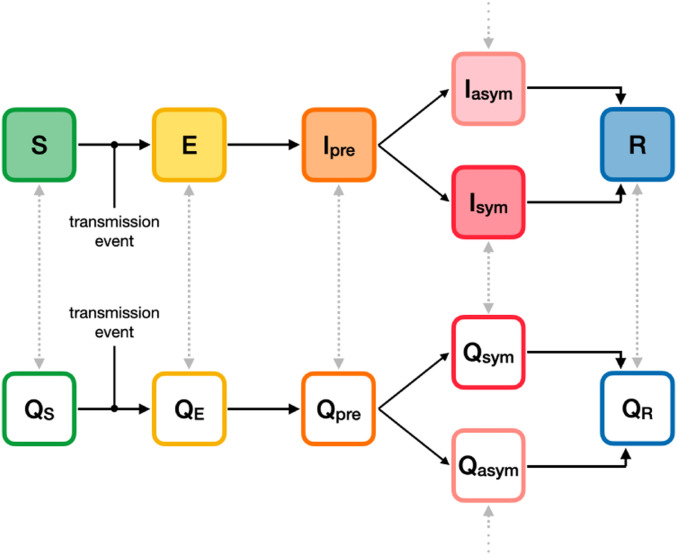
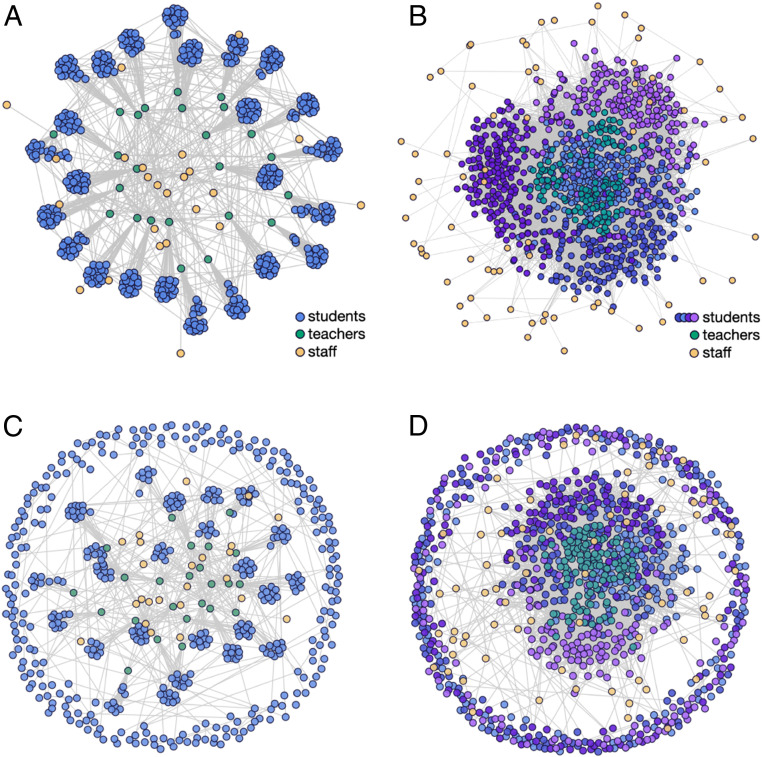
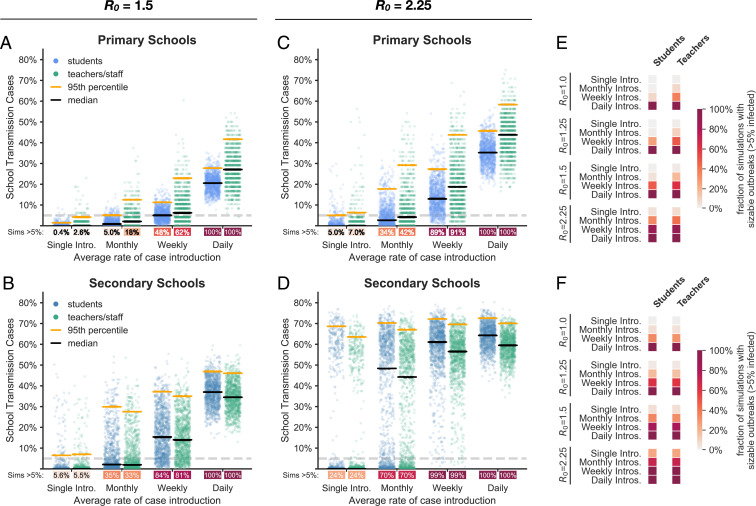
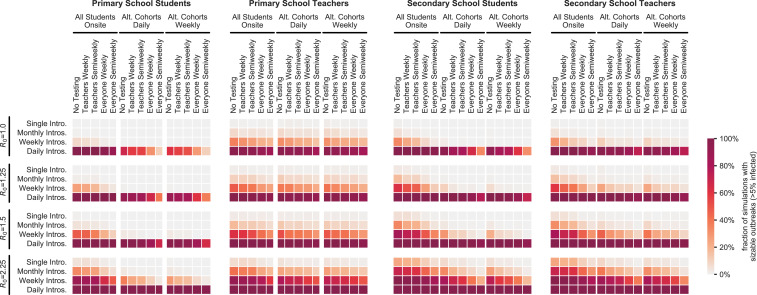
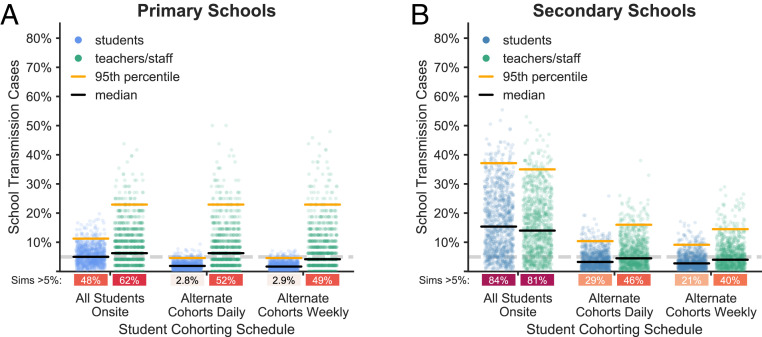
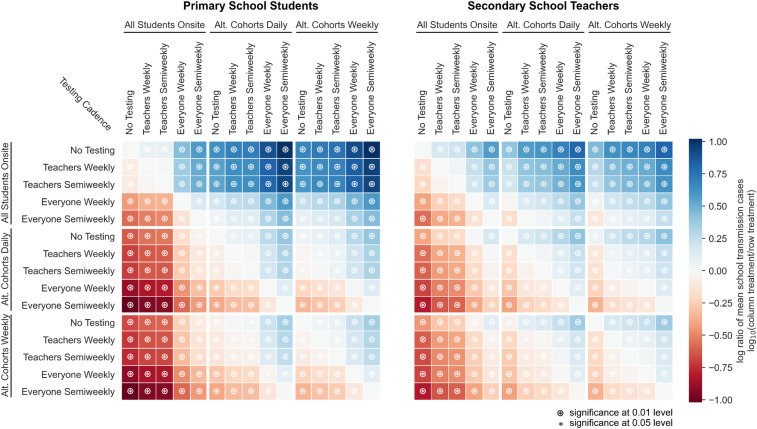
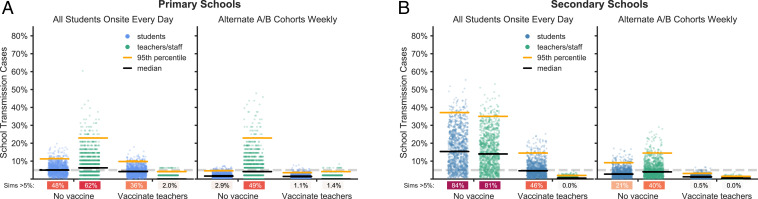
Reopening schools is an urgent priority as the COVID-19 pandemic drags on. To explore the risks associated with returning to in-person learning and the value of mitigation measures, we developed stochastic, network-based models of severe acute respiratory syndrome coronavirus 2 (SARS-CoV-2) transmission in primary and secondary schools. We find that a number of mitigation measures, alone or in concert, may reduce risk to acceptable levels. Student cohorting, in which students are divided into two separate populations that attend in-person classes on alternating schedules, can reduce both the likelihood and the size of outbreaks. Proactive testing of teachers and staff can help catch introductions early, before they spread widely through the school. In secondary schools, where the students are more susceptible to infection and have different patterns of social interaction, control is more difficult. Especially in these settings, planners should also consider testing students once or twice weekly. Vaccinating teachers and staff protects these individuals and may have a protective effect on students as well. Other mitigations, including mask wearing, social distancing, and increased ventilation, remain a crucial component of any reopening plan.

Keywords: SARS-CoV-2; epidemiology; primary schools; secondary schools.


Conflict of interest statement

Competing interest statement: C.T.B. and R.S.M. consult for Color Health. C.T.B. has received honoraria from Novartis. H.E.W. and A.Y.Z. are currently employed by and have equity interest in Color Health. J.R.H. was previously employed by and holds an equity stake in Color Health. J.R.H. is currently employed and has an equity interest in Maze Therapeutics.

Figures

Fig. 1.
Fig. 1.
Compartment model. The progression of disease states in the extended SEIR network model is represented by the compartments shown. Susceptible (S) individuals become infected (exposed) following transmissive contact with an infectious individual. Newly exposed (E) individuals undergo a latent period, during which time they are infected but not contagious. Infected individuals then progress to a presymptomatic infectious state (Ipre), in which they are contagious but not yet presenting symptoms. Some infectious individuals go on to develop symptoms (Isym), while others will remain asymptomatic (Iasym). At the conclusion of the infectious period, infected individuals enter the recovered state (R) and are no longer contagious or susceptible to infection. The unshaded compartments represent quarantined individuals in the respective disease states. Individuals are moved into a quarantine compartment upon isolation due to symptoms or a positive test (gray arrows).
Fig. 2.
Fig. 2.
Network structures for primary and secondary schools. Each individual is represented by a circle, with gray lines connecting close contacts. (A) Primary school students (blue) are organized into classes with close contacts between all students in each classroom as well as a single teacher (green). School staff (yellow) interact with teachers and other staff. (B) Secondary school students (shades of blue and purple indicating grade levels) move between classrooms and have close contact with six teachers (green) each. School staff (yellow) interact with teachers and other staff. Secondary school students are clustered into loose social groups and are more likely to interact with other students in the same grade. (C and D) Example contact networks for primary and secondary schools, respectively, on a given day in a cohorting strategy in which students are divided into two groups that alternate in-person learning. Students that are in school on a given day (interior nodes) maintain the same school interactions as in the baseline networks. Students in the out-of-school cohort (peripheral nodes) make connections with any students that share their household (students in the same household are assigned to the same cohort in our model), but are disconnected from all other students and teachers. Students alternate between these interaction patterns according to a weekly or daily cohorting schedule.
Fig. 3.
Fig. 3.
Effect of community prevalence. The distributions of school transmission cases as a percentage of the school population when new cases are introduced at different average rates. In these simulations, all students are in school 5 d a week, and there is no proactive testing. (A and B) Outcomes for primary schools and secondary schools, respectively, with baseline transmission R0 = 1.5. Black and orange lines represent median and 95th percentile outcomes, respectively. Under each jitter distribution, we list the percentage of simulations where more than 5% (gray dashed line) of the population are infected in school. (C and D) Outcomes for primary and secondary schools in scenarios with heightened transmission R0 = 2.25 due to the predominance of a highly transmissible strain. (E and F) Heatmaps show the fraction of simulations where more than 5% of the student or teacher population are infected in primary and secondary schools, respectively, across a range of R0 values and introduction rates.
Fig. 4.
Fig. 4.
Effects of cohorting and testing strategies. Heatmaps illustrate the interactions of three student cohorting strategies and five proactive testing strategies (horizontal axis) across a range of transmission levels (R0) and new case introduction rates (vertical axis). The color of each cell indicates the fraction of 1,000 simulations for the given parameter set that result in sizable outbreaks where more than 5% of the population is infected. Outcomes are shown for student and teacher populations in primary and secondary schools as indicated by the title above each heatmap.
Fig. 5.
Fig. 5.
Effects of cohorting strategies. The distributions of school transmission cases as a percentage of school population for 1,000 simulations under different student cohorting strategies in (A) primary schools and (B) secondary schools with R0 = 1.5, approximately weekly new case introductions, and no testing. Under each jitter distribution, we list the percentage of simulations that result in outbreaks affecting more than 5% of the population.
Fig. 6.
Fig. 6.
Relative effects of testing and cohorting in a secondary school setting. A heatmap of pairwise comparisons of testing and cohorting interventions illustrates the effects of various combinations on mean outbreak sizes. Each cell is colored according to the log-ratio of mean outbreak sizes for the two interventions, which represents the effect of the column intervention relative to the row intervention. A blue cell indicates that the column intervention achieves a lower mean outbreak size than the row intervention; a red cell indicates that the column intervention has worse outcomes than the row intervention on average. Symbols in cells denote statistically significant differences in outbreak size distributions according to the Mann−Whitney U test at the 0.01 () and 0.05 (*) levels. Results are shown for scenarios where R0 = 1.5, case introductions occur weekly on average, and only the positive individual is quarantined when cases are detected.
Fig. 7.
Fig. 7.
Effects of vaccinating teachers. The distributions of school transmission events as a percentage of school population for 1,000 simulations with either no vaccination or vaccination of all teachers and staff in (A) primary schools and (B) secondary schools. Results are shown for scenarios with R0 = 1.5, approximately weekly new case introductions, and no testing. Because vaccination is only 90% effective in the model, some teachers and staff become infected even when all are vaccinated. Effective vaccinations block both disease and transmission.

References

    1. United Nations Educational, Scientific and Cultural Organization , 1.3 billion learners are still affected by school or university closures. https://en.unesco.org/news/13-billion-learners-are-still-affected-school.... Accessed 9 November 2020.
    1. Hanushek E., Woessmann L., The economic impacts of learning losses. 10.1787/21908d74-en. Accessed 1 February 2021. - DOI
    1. Nierenberg A., Pasick A., Will any more schools reopen in 2020? NY Times, 11 November 2020. https://www.nytimes.com/2020/11/11/us/will-any-more-schools-reopen-in-20.... Accessed 1 February 2021.
    1. Leidman E., COVID-19 trends among persons aged 0–24 years — United States, March 1–December 12, 2020. MMWR Morb. Mortal. Wkly. Rep. 70, 88–94 (2021). - PMC - PubMed
    1. R. P., Walensky, Walke H. T., Fauci A. S., SARS-CoV-2 variants of concern in the United States challenges and opportunities. JAMA 325, 1037–1038 (2021). - PMC - PubMed

Publication types