. 2021 Sep 13;12(1):5404.
doi: 10.1038/s41467-021-25260-9.

SMARCA4/2 loss inhibits chemotherapy-induced apoptosis by restricting IP3R3-mediated Ca2+ flux to mitochondria

Affiliations

SMARCA4/2 loss inhibits chemotherapy-induced apoptosis by restricting IP3R3-mediated Ca2+ flux to mitochondria

Yibo Xue et al. Nat Commun. .

Erratum in

Abstract

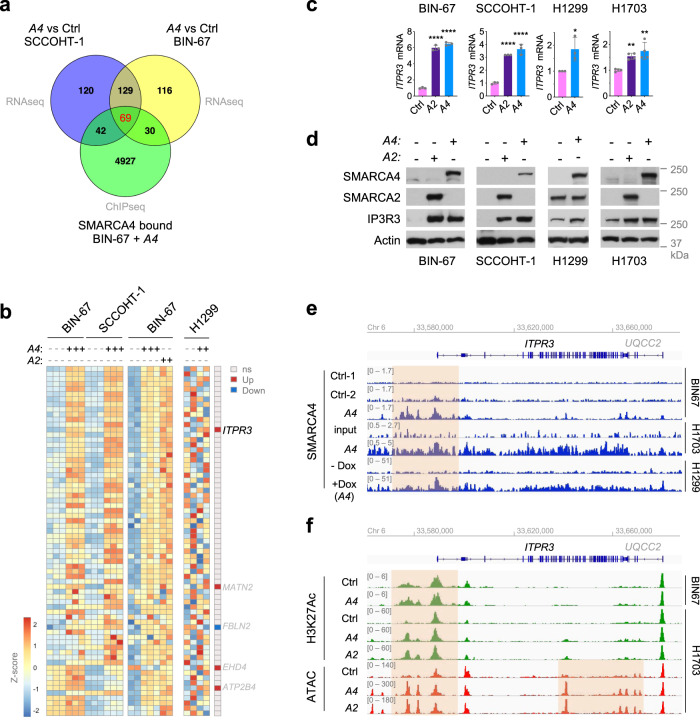
Inactivating mutations in SMARCA4 and concurrent epigenetic silencing of SMARCA2 characterize subsets of ovarian and lung cancers. Concomitant loss of these key subunits of SWI/SNF chromatin remodeling complexes in both cancers is associated with chemotherapy resistance and poor prognosis. Here, we discover that SMARCA4/2 loss inhibits chemotherapy-induced apoptosis through disrupting intracellular organelle calcium ion (Ca2+) release in these cancers. By restricting chromatin accessibility to ITPR3, encoding Ca2+ channel IP3R3, SMARCA4/2 deficiency causes reduced IP3R3 expression leading to impaired Ca2+ transfer from the endoplasmic reticulum to mitochondria required for apoptosis induction. Reactivation of SMARCA2 by a histone deacetylase inhibitor rescues IP3R3 expression and enhances cisplatin response in SMARCA4/2-deficient cancer cells both in vitro and in vivo. Our findings elucidate the contribution of SMARCA4/2 to Ca2+-dependent apoptosis induction, which may be exploited to enhance chemotherapy response in SMARCA4/2-deficient cancers.


Conflict of interest statement

The authors declare no competing interests.

Figures

Fig. 1
Fig. 1. SMARCA4/2 loss causes resistance to chemotherapeutics in ovarian and lung cancers.
The half maximal inhibitory concentration (IC50) of cisplatin in pan cancer (a) and lung cancer (b) cell lines with differential mRNA expression for SMARCA4 and SMARCA2 (see Supplementary Fig. 2b for stratification). A4H: SMARCA4High; A4L: SMARCA4Low; A2H: SMARCA2High; A2L: SMARCA2Low. Cell line numbers are indicated in gray below each group. One-way ANOVA Kruskal–Wallis test followed by Dunn’s test for multiple comparisons to A4HA2H group, p values (p): a A4HA2L—0.5338, A4LA2H—0.0035, A4LA2L < 0.0001; b A4HA2L—0.4615, A4LA2H—0.0517, A4LA2L—0.0019. c Schematic outline of a pooled CRISPR screen with a sgRNA knockout library against epigenetic regulators to identify genes required for cisplatin response in OVCAR4 cells. d MAGeCK analysis,, for screen in c. Genes were ranked by robust rank aggregation (RRA). Immunoblots (e), annexin V+/PI apoptotic cell population determined by flow cytometry (f), and representative phase-contrast images (g) of OVCAR4 cells with indicated SMARCA4/2 perturbations and cisplatin treatments (e, f 48 h). Immunoblots (h), annexin V+/PI apoptotic cell population (i), and representative phase-contrast images (j) of H1703 cells with indicated SMARCA4/2 perturbations and cisplatin treatments (h, i 72 h). ej Ctrl Control, A4KO SMARCA4 knockout, shA2 shRNA targeting SMARCA2, cl. PARP cleaved PARP, cl. caspase 3 cleaved caspase 3, A4 SMARCA4, A2 SMARCA2. Scale bar, 150 μm. Mean ± SD, n = 3 independent experiments, one-way ANOVA followed by Dunnett’s test for multiple comparisons, p values (p): f all (<0.0001); i A2 (0 μM)—0.0032, A4 (0 μM)—0.0023, A2 or A4 (3 μM) < 0.0001. **p < 0.01, ****p < 0.0001.
Fig. 2
Fig. 2. SMARCA4 modulates Ca2+ flux from the ER to mitochondria.
Gene set enrichment analysis plots of indicated Gene Ontology terms in SCCOHT-1 (a) and BIN-67 (b) cells ± SMARCA4 (A4) restoration. Ctrl control, FDR false discovery rate. c Immunoblots of indicated proteins in SCCOHT-1 cells ± A4 restoration. Changes of cytosolic (d) and mitochondrial (e) Ca2+ contents in SCCOHT-1 cells ± A4 restoration upon histamine stimulation. d 28 Ctrl and 21 A4 cells from n = 4 independent experiments were analyzed. e 44 Ctrl and 20 A4 cells from n = 4 independent experiments were analyzed. f Immunoblots of indicated proteins in H1703 cells ± A4 restoration. Changes of cytosolic (g) and mitochondrial (h) Ca2+ contents in H1703 cells ± A4 restoration upon histamine stimulation. g 41 Ctrl and 74 A4 cells from n = 3 independent experiments were analyzed. h 45 Ctrl and 63 A4 cells from n = 3 independent experiments were analyzed. i Immunoblots of indicated proteins in OVCAR4 cells ± SMARCA4 knockout (A4KO). Changes of cytosolic (j) and mitochondrial (k) Ca2+ contents in OVCAR4 cells with ± A4KO upon histamine stimulation. j 60 Ctrl and 53 A4KO cells from n = 3 independent experiments were analyzed. k 41 Ctrl and 40 A4KO cells from n = 3 independent experiments were analyzed. l Immunoblots of indicated proteins in H1437 cells ± A4KO. Changes of cytosolic (m) and mitochondrial (n) Ca2+ contents in H1437 cells ± A4KO upon histamine stimulation. m 39 Ctrl and 37 A4KO cells from n = 3 independent experiments were analyzed. n 38 Ctrl and 42 A4KO cells from n = 3 independent experiments were analyzed. d, e, g, h, j, k, m, n Left: traces of cytosolic and mitochondrial Ca2+ contents upon 100 μM histamine stimulation (mean ± SEM). Right: quantification of the maximal Ca2+ signal peaks induced by histamine stimulation (mean ± SD). The Ca2+ probes R-GECO (R-GECO F/F0) and CEPIA-2mt (CEPIA-2mt F/F0) were used to monitor cytosolic and mitochondrial Ca2+, respectively. Arb. units arbitrary units. Two-tailed t-test, p values (p): d 0.0003, e 0.0016, g 0.0012, h 0.0084, j 0.0088, k 0.0182, m 0.0004, n 0.0084. *p < 0.05, **p < 0.01, ***p < 0.001.
Fig. 3
Fig. 3. SMARCA4/2 regulate ITPR3 transcription through remodeling chromatin accessibility at its gene locus.
a Venn diagram of Ca2+-related genes from Fig. 2a, b that are enriched in SCCOHT-1 and BIN-67 cells with SMARCA4 restoration. b Heatmap of Ca2+-related genes bound by SMARCA4 (n = 69) in indicated SCCOHT (SCCOHT-1 and BIN-67) and NSCLC (H1299) cell lines with SMARCA4/2 restoration. Left: normalized reads from RNA-seq data of BIN-67 and SCCOHT-1 cells with SMARCA4 restoration. Middle: normalized reads from RNA-seq data of BIN-67 cells with SMARCA4/2 restoration. Right: normalized signal from microarray data of H1299 cells with SMARCA4 restoration. Row scaling was used to generate the heatmap. The last column represents changes of genes in H1299 cells ± SMARCA4 restoration: ns not significant, up upregulated, down downregulated. c RT-qPCR measurements of ITPR3 mRNA expression in indicated SCCOHT and NSCLC cell lines with SMARCA4/2 restoration. GAPDH was used for normalization. Mean ± SD, n = 3 (BIN-67, SCCOHT-1, H1299) or 4 (H1703) independent experiments, one-way ANOVA followed by Dunnett’s test for multiple comparisons to the control group (BIN-67, SCCOHT-1, H1703) or two-tailed t-test (H1299), p values (p): BIN-67, all <0.0001; SCCOHT-1, A2—0.0004, A4—0.0001; H1299—0.0318; H1703, A2—0.0097, A4—0.0013. d Immunoblots of indicated proteins in indicated SCCOHT and NSCLC cell lines ± SMARCA4/2 restoration. e SMARCA4 occupancy in vicinity of the ITPR3 locus assessed by chromatin immunoprecipitation sequencing (ChIP-seq) in indicated SCCOHT and lung cancer cell lines ± SMARCA4 restoration. SMARCA4 in H1299 cells was induced by doxycycline (Dox). Track height is normalized to relative number of mapped reads. f Chromatin structure changes in vicinity of the ITPR3 locus assessed by H3K27Ac ChIP-seq and assay for transposase-accessible chromatin sequencing (ATAC-seq) in indicated SCCOHT and lung cancer cell lines ± SMARCA4/2 restoration. Track height is normalized to relative number of mapped reads. af Ctrl control, A4 SMARCA4, A2 SMARCA2. *p < 0.05, **p < 0.01, ****p < 0.0001.
Fig. 4
Fig. 4. SMARCA4/2 loss inhibits apoptosis by constricting IP3R3-mediated Ca2+ flux.
a Immunoblots of SCCOHT-1 cells ± SMARCA4 (A4) and ITPR3 (R3) perturbations. shR3: shRNA targeting ITPR3. Changes of cytosolic (b) and mitochondrial (c) Ca2+ contents in SCCOHT-1 cells ± A4 and R3 perturbations upon histamine stimulation. b 43 control (Ctrl), 30 A4, 51 A4 ShR3♯1, and 50 A4 ShR3♯2 cells from n = 4 independent experiments were analyzed. c 31 Ctrl, 30 A4, 50 A4 ShR3♯1, and 50 A4 ShR3♯2 cells from n = 4 independent experiments were analyzed. d Immunoblots of H1703 cells ± A4 and R3 perturbations. siR3 siRNA targeting ITPR3. Changes of cytosolic (e) and mitochondrial (f) Ca2+ contents in H1703 cells ± A4 and R3 perturbations upon histamine stimulation. e 64 Ctrl, 70 A4, and 64 A4 siR3 cells from n = 3 independent experiments were analyzed. f 53 Ctrl, 53 A4, and 50 A4 siR3 cells from n = 3 independent experiments were analyzed. g Immunoblots of OVCAR4 cells with ITPR3 knockdown 48 h post cisplatin treatment. cl cleaved. h Annexin V+/PI apoptotic cell population determined by flow cytometry in OVCAR4 cells described in g. Immunoblots of H1703 cells ± R3 overexpression (i) or ±A4 and R3 perturbations (j). Cells were collected 72 h after the treatment. k Annexin V+/PI apoptotic cell population determined by flow cytometer in H1703 cells described in j. b, c, e, f Left: traces of cytosolic or mitochondrial Ca2+ contents upon 100 μM histamine stimulation (mean ± SEM). Right: quantification of the maximal Ca2+ signal peaks induced by histamine (mean ± SD). The Ca2+ probes R-GECO (R-GECO F/F0) and CEPIA-2mt (CEPIA-2mt F/F0) were used to monitor cytosolic and mitochondrial Ca2+, respectively. Arb. units arbitrary units. One-way ANOVA followed by Dunnett’s test for multiple comparisons to Ctrl, p values (p): b A4—0.0003, shR3#1—0.6223, shR3#2—0.9866; c A4 < 0.0001, shR3#1—0.9109, shR3#2—0.9845; e A4—0.0038, siR3—0.4232; f A4—0.0007, siR3—0.1620. h, k Mean ± SD, n = 3 independent experiments, one-way ANOVA followed by Dunnett’s test for multiple comparisons, p values (p): all <0.0001. *p < 0.01, ***p < 0.001, ****p < 0.0001; ns not significant.
Fig. 5
Fig. 5. IP3R3 expression is reduced in SMARCA4/2-deficient cancers.
a Correlation of ITPR3 and SMARCA2 (A2) mRNA in ovarian (n = 11) and lung (n = 48) cancer cell lines with low expression of SMARCA4 (A4). Expression data were obtained from Cancer Cell Line Encyclopedia (CCLE) in reads per kilobase million (RPKM). A4Low, bottom quartile. r: Pearson correlation; p: p value (two-tailed). b Immunoblots of lung cancer cell lines with indicated SMARCA4/2 (A4/2) status. Pro proficient, def deficient; * KRAS mutant. c Correlation of ITPR3 and SMARCA2 mRNA in ovarian cancer (n = 89) and lung adenocarcinoma (LUAD, n = 128) patient tumors with low expression of SMARCA4. Gene expression data were obtained from UCSC Xena in fragments per kilobase million (FPKM). A4Low, bottom quartile. r, Pearson correlation; p, p value (two-tailed). d ITPR3 mRNA expression in SCCOHT and ovarian cancer patient tumors. TCGA ovarian cancers (OV) (n = 379) were stratified based on SMARCA4/2 expression as indicated in Supplementary Fig. 2b. ITPR3 expression in FPKM was normalized to ACTB. H: high; L: low. One-way ANOVA Brown–Forsythe and Welch tests followed by Dunnett’s test for multiple comparisons to A4HA2H, p values (p): A4HA2L—0.3830, A4LA2H—0.0009, A4LA2L < 0.0001, SCCOHT—0.0108, or two-tailed t-test between A4LA2L group and SCCOHT, p = 0.4953. Representative images (e, g) and H-score (f, h) of immunohistochemistry analysis for IP3R3 and SMARCA4 expression in patient tumors. e, f HGSC (n = 49) and SCCOHT (n = 45). g, h NSCLC (n = 59). Scale bar, 100 μm. Mann–Whitney test (two-tailed), p values (p): f 0.0066, h 0.0270. i Tumor growth in H1703 xenograft models ± exogenous SMARCA4 expression. Doxycycline (Dox) was given daily starting on day 21 to induce SMARCA4. Upper, tumor size; lower, endpoint tumor weight. Mean ± SEM, − Dox (n = 4 animals), + Dox (n = 6 animals), two-way ANOVA (upper), two-tailed t-test (lower), p values (p): upper—0.0014, lower—0.0008. Representative images (j) and digital quantification (k) of immunohistochemistry analysis in endpoint tumors described in i. Scale bar, 100 μm. Mean ± SD, − Dox (n = 4), + Dox (n = 6), two-tailed t-test (lower), p values (p): upper, middle <0.0001; lower—0.0041. *p < 0.05, **p < 0.01, ***p < 0.001, ****p < 0.0001; ns not significant.
Fig. 6
Fig. 6. The histone deacetylase inhibitor quisinostat rescues IP3R3 expression and enhances cisplatin response in SMARCA4/2-deficient cancer cells.
a SMARCA2 and ITPR3 mRNA expression in H1703 cells treated with quisinostat for 48 h. Mean ± SD, n = 3 independent experiments, one-way ANOVA followed by Dunnett’s tests for multiple comparisons to untreated, p values (p): left, 10 nM—0.0003, 40 nM < 0.0001; right, 10 nM—0.0027, 40 nM—0.0002. Immunoblots (b) and annexin V+/PI apoptotic population (c) in H1703 cells treated with cisplatin (3 μM) and quisinostat (10 nM) for 72 h. cl cleaved. Mean ± SD, n = 3 independent experiments, one-way ANOVA followed by Dunnett’s test for multiple comparisons, p values: all <0.0001. d Colony formation assay for H1703 cells treated with cisplatin and quisinostat for 12 days. Immunoblots of H1703 cells ± SMARCA2 knockout (e) or ±IP3R3 knockdown (f) treated with cisplatin (3 μM) and quisinostat (10 nM) for 72 h. g Representative images from confocal live-cell imaging of H1703 cells overexpressing the mitochondrial Ca2+ probe CEPIA-2mt treated with quisinostat or/and cisplatin and stained with the mitochondrial marker Mitotracker deep red. Cisplatin: 2 μM, 24 h; quisinostat: 40 nM, 72 h. Scale bar, 25 μm. h Quantification of basal mitochondrial Ca2+ levels from g, showing the ratio of CEPIA-2mt/Mitotracker fluorescence intensities compared to control. 43 control (ctrl), 42 cisplatin, 38 quisinostat, and 46 quisinostat/cisplatin cells from n = 4 independent experiments were analyzed. Mean ± SD, one-way ANOVA followed by Dunnett’s test for multiple comparisons to ctrl, p values: cisplatin—0.2105, quisinostat—0.2985, combination—0.0032. i Tumor growth in H1703 xenograft models treated with cisplatin (4 mg kg−1) and quisinostat (10 mg kg−1). Vehicle (n = 6 animals), all other groups (n = 5 animals); upper, tumor volume, mean ± SEM, two-way ANOVA; lower, endpoint tumor weight, one-way ANOVA followed by Dunnett’s tests for multiple comparisons to the combination, p values: upper, cisplatin < 0.0001, quisinostat—0.0054; lower, cisplatin—0.0008, quisinostat—0.0330. Representative images (j) and digital quantification (k) of immunohistochemistry analysis in endpoint tumors described in i. Scale bar, 100 μm. Mean ± SD, all groups (n = 5), one-way ANOVA followed by Dunnett’s test for multiple comparisons, p values: all <0.0001. *p < 0.05, **p < 0.01, ***p < 0.001, ****p < 0.0001; ns not significant.

References

    1. Kadoch C, Crabtree GR. Mammalian SWI/SNF chromatin remodeling complexes and cancer: mechanistic insights gained from human genomics. Sci. Adv. 2015;1:e1500447. doi: 10.1126/sciadv.1500447. - DOI - PMC - PubMed
    1. Wilson BG, Roberts CW. SWI/SNF nucleosome remodellers and cancer. Nat. Rev. Cancer. 2011;11:481–492. doi: 10.1038/nrc3068. - DOI - PubMed
    1. Hodges C, Kirkland JG, Crabtree GR. The many roles of BAF (mSWI/SNF) and PBAF complexes in cancer. Cold Spring Harb. Perspect. Med. 2016;6:a026930. doi: 10.1101/cshperspect.a026930. - DOI - PMC - PubMed
    1. Kadoch C, et al. Proteomic and bioinformatic analysis of mammalian SWI/SNF complexes identifies extensive roles in human malignancy. Nat. Genet. 2013;45:592–601. doi: 10.1038/ng.2628. - DOI - PMC - PubMed
    1. Campbell JD, et al. Distinct patterns of somatic genome alterations in lung adenocarcinomas and squamous cell carcinomas. Nat. Genet. 2016;48:607–616. doi: 10.1038/ng.3564. - DOI - PMC - PubMed

Publication types

MeSH terms