. 2021 Sep 13;12(1):5395.
doi: 10.1038/s41467-021-25403-y.

Multi-platform profiling characterizes molecular subgroups and resistance networks in chronic lymphocytic leukemia

Affiliations

Multi-platform profiling characterizes molecular subgroups and resistance networks in chronic lymphocytic leukemia

Johannes Bloehdorn et al. Nat Commun. .

Abstract

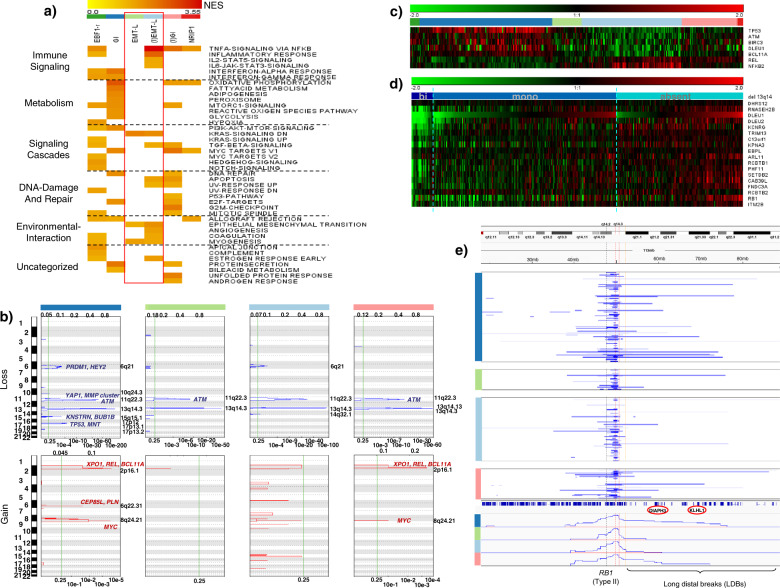
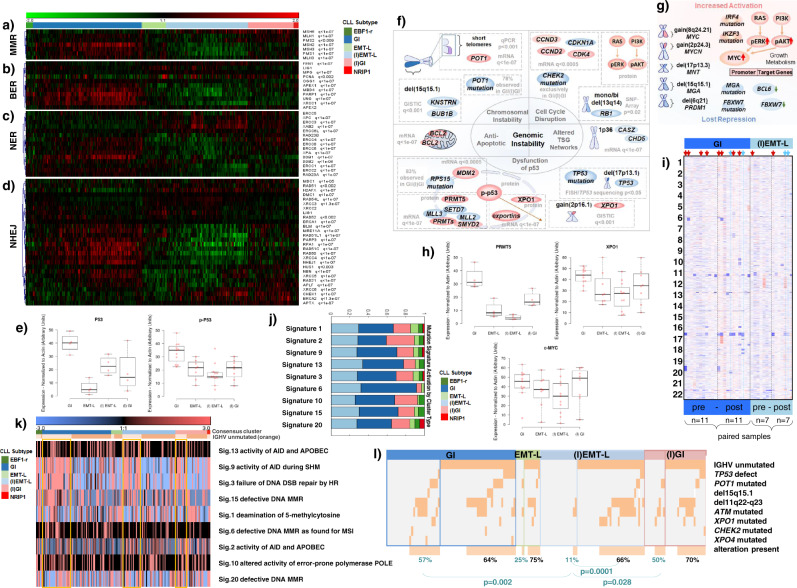
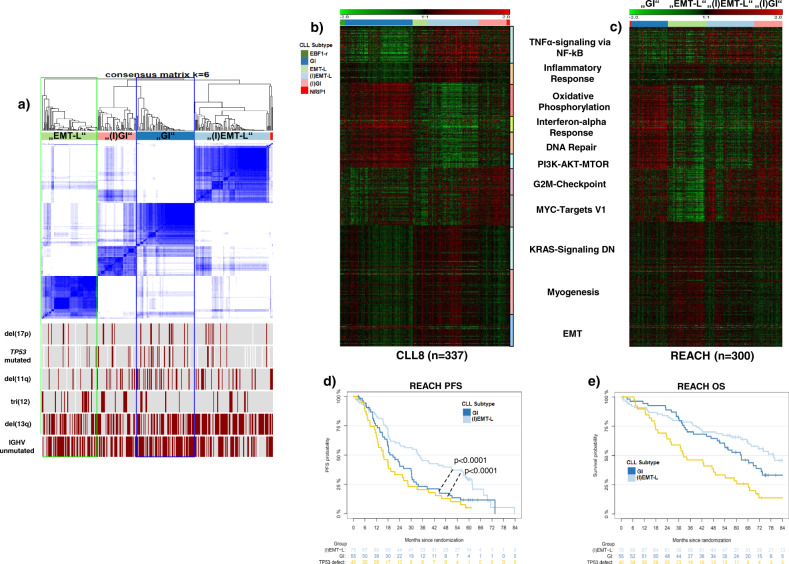
Knowledge of the genomic landscape of chronic lymphocytic leukemia (CLL) grows increasingly detailed, providing challenges in contextualizing the accumulated information. To define the underlying networks, we here perform a multi-platform molecular characterization. We identify major subgroups characterized by genomic instability (GI) or activation of epithelial-mesenchymal-transition (EMT)-like programs, which subdivide into non-inflammatory and inflammatory subtypes. GI CLL exhibit disruption of genome integrity, DNA-damage response and are associated with mutagenesis mediated through activation-induced cytidine deaminase or defective mismatch repair. TP53 wild-type and mutated/deleted cases constitute a transcriptionally uniform entity in GI CLL and show similarly poor progression-free survival at relapse. EMT-like CLL exhibit high genomic stability, reduced benefit from the addition of rituximab and EMT-like differentiation is inhibited by induction of DNA damage. This work extends the perspective on CLL biology and risk categories in TP53 wild-type CLL. Furthermore, molecular targets identified within each subgroup provide opportunities for new treatment approaches.


Conflict of interest statement

S.S. received advisory board honoraria, research support, travel support, speaker fees from AbbVie, Amgen, AstraZeneca, Celgene, Gilead, GSK, Hoffmann-La Roche, Janssen, Novartis, Sunesis. O.E. is supported by Janssen, Johnson and Johnson, Volastra Therapeutics, AstraZeneca, and Eli Lilly research grants. He is a scientific advisor and equity holder in Freenome, Owkin, Volastra Therapeutics and One Three Biotech and paid scientific advisor to Champion Oncology. M.S.C. is a retained consultant for BioInvent International and has performed educational and advisory roles for Roche, Boehringer Ingelheim, Baxalta, Merck KGaA, and GLG. He has received research funding from Bioinvent, Roche, Gilead, iTeos, UCB, and GSK. He is co-inventor of patent WO2012022985A1 protecting antibodies directed to hFcgRIIB in combination with CD20 specific antibodies. L.B.: Advisory Committees Abbvie, Amgen, Astellas, Bristol-Myers Squibb, Celgene, Daiichi Sankyo, Gilead, Hexal, Janssen, Jazz Pharmaceuticals, Menarini, Novartis, Pfizer, Sanofi, Seattle Genetics. R-F.Y. and M.W. are employed by Genentech and Roche, respectively. J.B. received travel support from Janssen and research support from Roche. The remaining authors declare no competing interests.

Figures

Fig. 1
Fig. 1. Composition and relationship of CLL subtypes in clustered data.
a Schematic representation for analysis, identification of CLL subtypes in the CLL8, and confirmation in the REACH cohort. The four largest clusters (GI, (I)GI, EMT-L, (I)EMT-L), and associations of NRIP1 with the inflammatory or tri(12) with the EBF1-r signature were also identified in the independent validation cohort of the REACH trial. Co-clustering of GI/(I)GI and EMT-L/(I)EMT-L cases in the REACH cohort supports the selection of subgroup-specific characteristics during treatment. b Heatmap showing the consensus clustering for k = 6 used for defining CLL subtypes (n = 337). The distribution of genetic characteristics is shown below the heatmap. Significant enrichment of variables in clusters is observed for del(17p) (p = 0.05), TP53 mutation (p = 0.01), tri(12) (p = 7e−06), del(13q) (p = 0.03), and IGHV mutation status (p = 0.008) (all Fisher’s exact test (two-sided)). TP53 frameshift mutations occur exclusively in GI and splice site mutations in EBF1-r cases. Tri(12) is strongly overrepresented in EBF1-r (72.7%). c Telomere length is significantly different across CLL subtypes (p < 0.001, Kruskal–Wallis test), and shortest length is observed in GI with a median of 3.8 kb (p = 0.003, Mann–Whitney (two-sided), for GI vs. (I)EMT-L) (n = 333). d White blood cell counts are significantly different across CLL subtypes (p < 0.0001, Kruskal-Wallis test), show decreased counts in inflammatory CLL and are lowest in (I)EMT-L with median 61.1 G/L (p < 0.0001, Mann–Whitney (two-sided), for GI vs. (I)EMT-L) (n = 330). For Fig. 1a–d, data within individual figures derives from biologically independent samples. For the boxplots, centerline, box limits, and whiskers represent the median, 25th, and 75th percentiles, and 1.5× interquartile range, respectively.
Fig. 2
Fig. 2. Pathway activation and genetic alterations in CLL subtypes.
a Heatmap showing overrepresented gene sets (FDR < 0.05) identified through GSEA. The intensity range of normalized enrichment scores (NES) illustrates the degree of enrichment in CLL subtypes. Gene sets are grouped together according to the biological context. CLL subtype color code defined in Fig. 2a applies for Fig. 2a–c, e. b GISTIC analysis of copy number alterations (CNA). Chromosomal positions (1–22) on the y-axis (left) indicate losses (blue, upper panels) or gains (red, lower panels) for major clusters. Affected genes representing CNA targets within biological networks (such as YAP1) are shown for respective peaks. The most significant chromosomal peaks for major clusters are indicated on the right of each panel. GISTIC q-values at each locus are plotted from left to right on a log scale (bottom of each panel). Altered regions with FDR q ≤ 0.25 (vertical green line) are considered significant. GISTIC G-Scores (amplitude of the aberration × frequency of its occurrence across samples) are plotted on top of the panels. c Heatmap showing GEP of genes located within or adjacent to the minimally deleted or minimally gained regions of recurrent aberrations (n = 337). FDRs for DEGs ((I)EMT-L vs. GI) are highly significant (q < 1e−07). d Heatmap showing GEP of genes located at/adjacent to the minimally deleted region on 13q (n = 335). The blue color code indicates deletions (dark blue: biallelic; light blue: monoallelic) and the absence of del(13q) (cyan blue). Genes are ordered corresponding to chromosomal positions for the region between DLEU1 and RB1. e Visualization of del(13q) per case (blue horizontal lines). y-Axis: cluster color code, x-axis: representative genes and topography for the cumulative coverage of segment breaks per cluster. A vertical black dotted line indicates the RB1 locus. Vertical red dotted lines indicate the majority of distal losses (around 50–51 mb). Losses extending to the distal end of cytoband 13q14.3 (orange dotted line) are variably distributed. LDBs involve/exceed the majority of cytoband 13q21.1 (distal of 54.7 mb). Biallelic deletions of 13q14 mostly cover a small region and rarely occur together with larger 13q deletions. For Fig. 2a–e, data within individual figures derives from biologically independent samples.
Fig. 3
Fig. 3. Biological processes operative in genomically instable CLL.
ad Heatmap showing expression profiles (n = 337) for genes involved in a mismatch repair (MMR), b base excision repair (BER), c nucleotide excision repair (NER), d non-homologous end joining (NHEJ). FDRs of DEGs (GI vs. (I)EMT-L) are indicated (q). Single genes may be involved in multiple processes. e Protein expression in CLL subtypes; p53 (n = 4 each), phospho-p53 (GI/(I)EMT-L: n = 11 each, (I)GI/EMT-L: n = 8 each) (normalized to actin). f, g Models summarizing alterations which contribute to f genomic instability, g activation of MYC family members in GI/(I)GI. Source/method (e.g., mRNA/GISTIC) and significance/frequencies are shown in gray, along with estimated mode of regulation/biological effect (red: increase/activation; blue: decrease/inactivation). h Protein expression in CLL subtypes; PRMT5 (n = 4 each), XPO1/cMYC (GI/(I)EMT-L: n = 11 each, (I)GI/EMT-L: n = 8 each) (normalized to actin). i Heatmap showing CNAs (paired CLL8 cases; before treatment (pre), at relapse (post)). CNAs are frequent at relapse (TP53 wild-type: GI/(I)EMT-L; p < 0.05, Wilcoxon signed-rank test (two-sided)). GI cases show more aberrations (mean) before ((I)EMT-L: 0.83; GI: 1.71) and after treatment ((I)EMT-L: 2.17; GI: 3.43), with considerable increase after treatment when TP53 mutations are included (GI(pre): 1.91, GI(post): 4.36; p < 0.01, Wilcoxon signed-rank test (two-sided)). Arrowheads highlight TP53 inactivation (preexisting: red; acquired: blue). GI alterations often involve chromosomes other than 13, 12, 11, and 17. j Fraction of signature activations in CLL subtypes (EBF1-r n = 6, GI n = 68, EMT-L n = 11, (I)EMT-L n = 52, (I)GI n = 31, NRIP1 n = 3) and k activation levels of mutational signatures (median centered) with order/color code according to clusters and IGHV status (light orange: IGHV mutated, yellow box: GI/(I)GI/(I)EMT-L). IGHV mutated cases show higher activations for signatures 9, 3, 15, and 20. l Alterations in DNA-damage response genes are more frequent in IGHV mutated GI/(I)GI cases (57%/50% ≥ one alteration) vs. IGHV mutated (I)EMT-L cases (11% ≥ one alteration) (p < 0.05, Mann–Whitney (two-sided)). IGHV unmutated cases (either subtype) have similar frequencies (64–70% ≥ one alteration). Only cases with WES for respective genes and known TP53 status (excluding EBF1-r/NRIP1) were used (n = 156). For Fig. 3a–l, data within individual figures derives from biologically independent samples. For boxplots, centerline, box limits, and whiskers represent the median, 25th, and 75th percentiles and 1.5× interquartile range, respectively.
Fig. 4
Fig. 4. Biological processes operative in CLL with EMT-like networks.
ad Heatmap showing expression profiles (n = 337) for a genes indicating activated TNFα/NF-kB signaling, b EMT-TFs, c NOTCH target genes (intensity range −1:1), d histone lysine methyltransferases. FDRs of DEGs (GI vs. (I)EMT-L) are indicated on the right (q). CLL subtype color code defined in Fig. 4a applies for Fig. 4a–d, j–m. e GEP of the CD19 positive (+) and negative (−) compartment from CLL samples with inflammatory (I) and non-inflammatory (NI) signatures. f GEP of 2374 variably expressed genes for the CD19 negative fraction. g Tumor GEP indicating activated TNFα/NF-kB signaling and induction of EMT-like programs after BCL1 tumor transplantation. y-axis: median centered expression, x-axis: days (d) after transplantation of individual samples (p < 0.05 shown for d7 vs. d21, Mann–Whitney (two-sided)). h Heatmap showing gene set enrichment, characteristic for CLL with genomic instability or activation of EMT-like programs, in Eµ-Myc and Eµ-TCL1 mice. Gene sets were identified through GSEA (FDR < 0.05) on proteome profiles of splenic tumor cells from leukemic or terminal Eµ-Myc and Eµ-TCL1 mice (n = 4, in two pools) compared with B cells of tumor-free wild-type mice (n = 12, in two pools). Color-coded normalized enrichment scores (NES) (degree of enrichment; positive: yellow to red; negative: blue, light to dark). Gene sets are grouped according to the biological context. i Model illustrating biologic characteristics and regulatory interplay of processes in major subgroups (GI and (I)EMT-L), as specified in respective results sections. j Expression profiles for 2359 variably expressed genes (SD > 0.5). Genes with the highest significance (q < 1e−05) for the EMT-L, EBF1-r, and NRIP1 cluster are indicated. Fold change (FC) is indicated for EBF1-r specific genes (EBF1-r vs. all other). k Piecharts illustrating global gene expression, percentages indicating over- or under-expression in relation to the median expression per gene across the dataset. l Heatmap showing genes (n = 69) with strongest differential expression (q ≤ 0.05, FC ≥ 2) between the EBF1-r vs. all other clusters. CD19 sorted healthy donor B cells are included (orange). Arrowheads indicate cases with tri(12). m Agglomerative hierarchical clustering (2359 genes, Pearson complete) for n = 337 CLL and n = 5 healthy donor B cells (orange). For Fig. 4a–f, h–m, data within individual figures derives from biologically independent samples.
Fig. 5
Fig. 5. CLL subtype, genetic markers, and treatment outcome in CLL8.
a PFS (left) and OS (right) according to treatment arm (FC: dotted line; FCR: continuous line) and subtype (color-coded) (n = 319). CLL subtype color code defined in Fig. 5a applies for Fig. 5a, b. b PFS (left) and OS (right) according to the IGHV mutation status and subtype (color-coded) (both treatment arms) (n = 310). c PFS according to subtypes; GI (dark blue) and (I)EMT-L (light blue), TP53, and ATM mutation and/or deletion status (shown for all cases and individual treatment arms) (n = 147). CLL subtype color code defined in Fig. 5c applies for Fig. 5c, d. d PFS in TP53 wild-type cases according to SF3B1 mutation status for GI (dark blue) or (I)EMT-L (light blue) (n = 193). For Fig. 5a–d, the log-rank test was used to compare the survival distributions. Data within individual figures derives from biologically independent samples.
Fig. 6
Fig. 6. Validation of CLL subtypes and prognostic impact in the REACH trial cohort.
a Consensus heatmap showing the 4 major CLL subtypes identified in the REACH expression dataset (n = 295); only a few cases (n = 5) segregate in undefined clusters (red/orange). Recurrent alterations are depicted below, inactivation (del/mut) of TP53 is heterogeneously distributed (“EMT-L”: 11%, “(I)GI”: 16%, “GI”: 20%, “(I)EMT-L”: 9%). b Heatmap depicting characteristic GEP in CLL8 (major core enrichment gene sets, 931 genes). c Heatmap showing expression of core enrichment gene sets (as used in (b)) for the REACH dataset. For better comparability, CLL8-complementary clusters (indicated by labels in quotation marks) are ordered in the same order as found by consensus clustering in CLL8. Increased biologic homogeneity is observed in “GI”/“(I)GI” cases and supported through co-clustering in (a). d PFS in the REACH dataset for all cases with TP53 defect (yellow), “(I)EMT-L” and “GI” cases without TP53 defect (n = 173). The significance level for GI vs. (I)EMT-L cases is calculated based on clustering from (a). e OS in the REACH dataset for all cases with TP53 defect (yellow), “(I)EMT-L” and “GI” cases without TP53 defect (n = 173). For d, e, the log-rank test was used to compare the survival distributions. Data within individual figures derives from biologically independent samples.
Fig. 7
Fig. 7. CONSORT diagram for the discovery and validation cohort.
CONSORT diagram providing information on enrollment and randomization for the CLL8 and REACH trial, along with details on the selection process of patient specimens used for class discovery and validation by gene expression profiling.

References

    1. Edelmann J, et al. High-resolution genomic profiling of chronic lymphocytic leukemia reveals new recurrent genomic alterations. Blood. 2012;120:4783–4794. doi: 10.1182/blood-2012-04-423517. - DOI - PubMed
    1. Landau DA, et al. Mutations driving CLL and their evolution in progression and relapse. Nature. 2015;526:525–530. doi: 10.1038/nature15395. - DOI - PMC - PubMed
    1. Stilgenbauer S, et al. Gene mutations and treatment outcome in chronic lymphocytic leukemia: results from the CLL8 trial. Blood. 2014;123:3247–3254. doi: 10.1182/blood-2014-01-546150. - DOI - PubMed
    1. Skowronska A, et al. Biallelic ATM inactivation significantly reduces survival in patients treated on the United Kingdom Leukemia Research Fund Chronic Lymphocytic Leukemia 4 trial. J. Clin. Oncol. 2012;30:4524–4532. doi: 10.1200/JCO.2011.41.0852. - DOI - PubMed
    1. Stankovic, T. et al. Ataxia telangiectasia mutated-deficient B-cell chronic lymphocytic leukemia occurs in pregerminal center cells and results in defective damage response and unrepaired chromosome damage. Blood10.1182/blood.V99.1.300 (2002). - PubMed

Publication types

MeSH terms