. 2021 Sep 13;12(1):5406.
doi: 10.1038/s41467-021-25661-w.

DNA methylation landscapes of 1538 breast cancers reveal a replication-linked clock, epigenomic instability and cis-regulation

Affiliations

DNA methylation landscapes of 1538 breast cancers reveal a replication-linked clock, epigenomic instability and cis-regulation

Rajbir Nath Batra et al. Nat Commun. .

Abstract

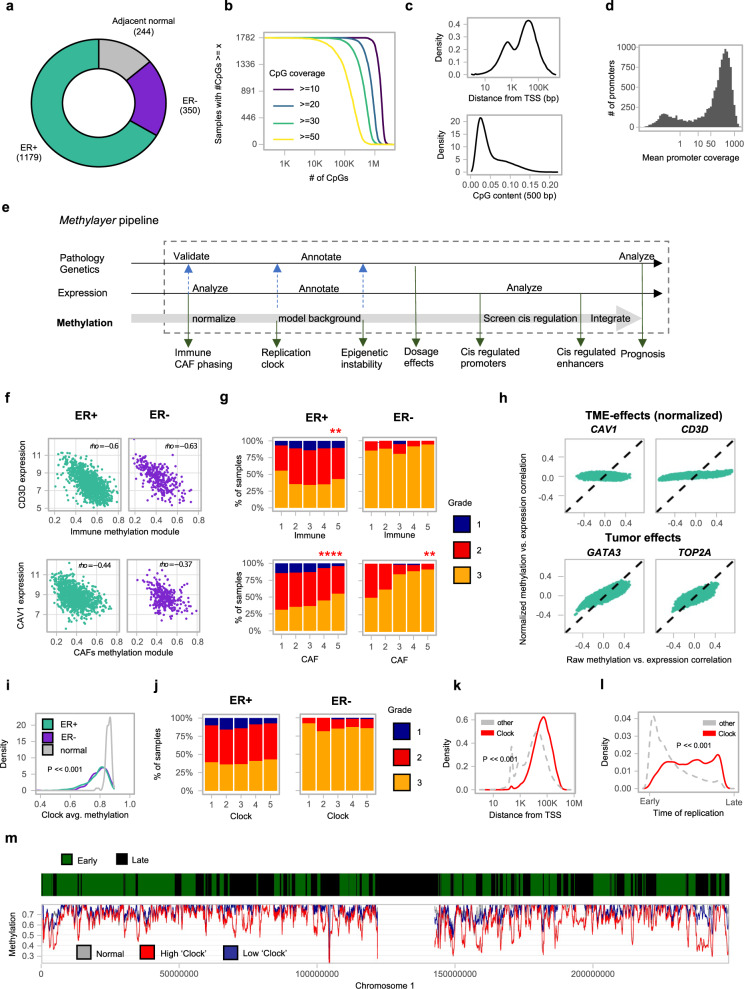
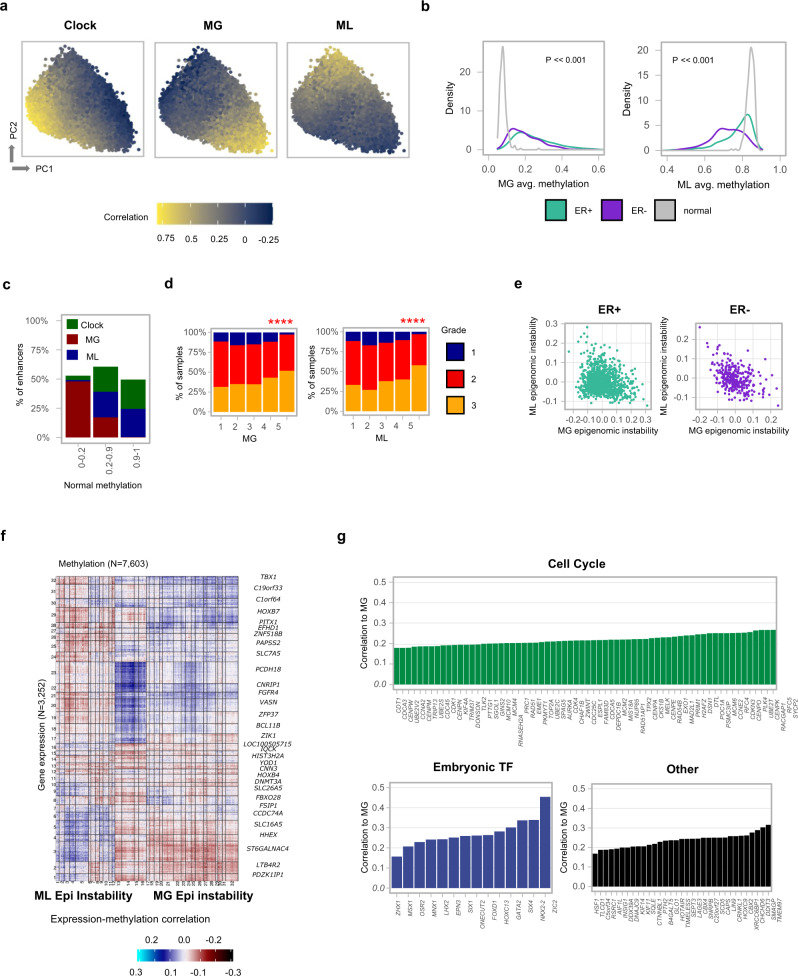
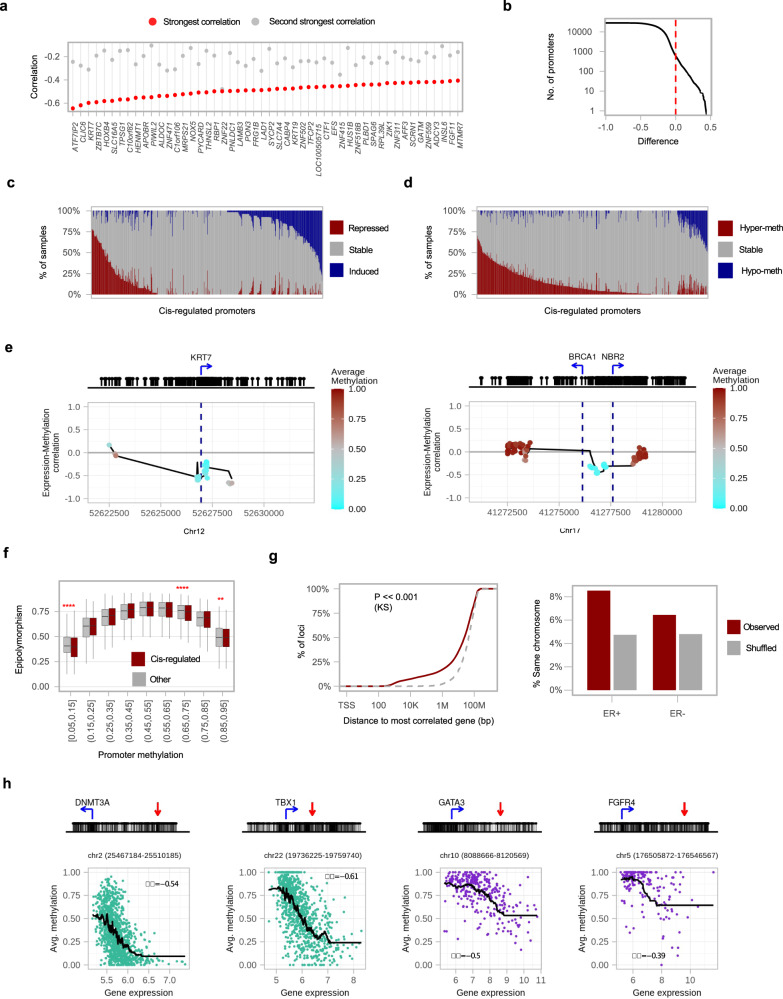
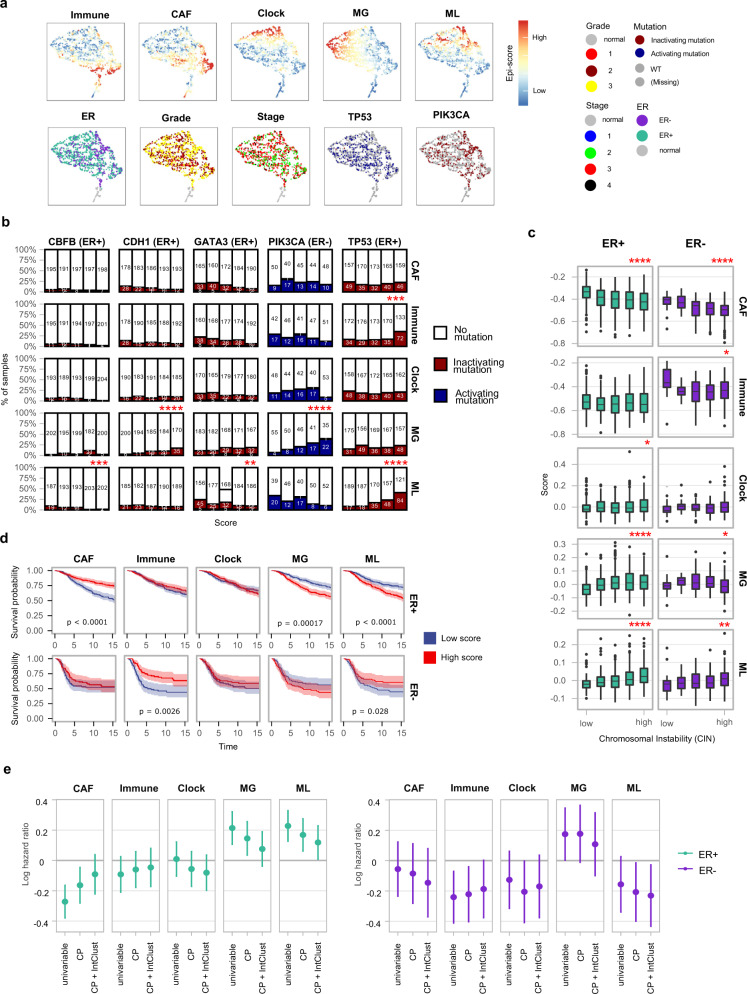
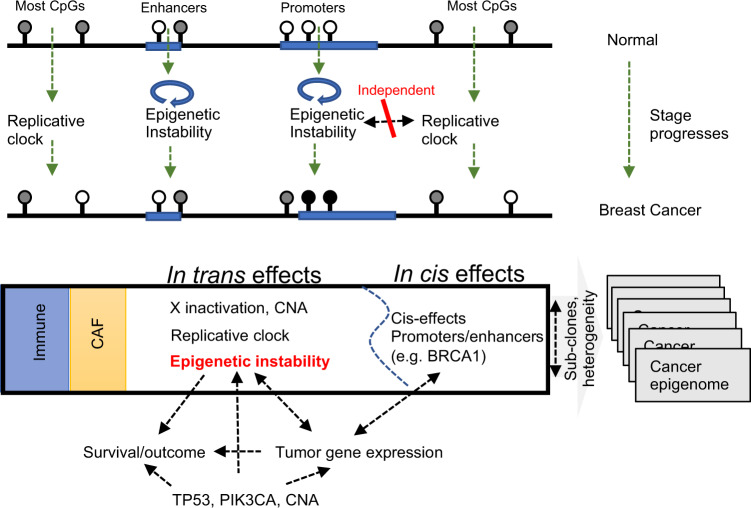
DNA methylation is aberrant in cancer, but the dynamics, regulatory role and clinical implications of such epigenetic changes are still poorly understood. Here, reduced representation bisulfite sequencing (RRBS) profiles of 1538 breast tumors and 244 normal breast tissues from the METABRIC cohort are reported, facilitating detailed analysis of DNA methylation within a rich context of genomic, transcriptional, and clinical data. Tumor methylation from immune and stromal signatures are deconvoluted leading to the discovery of a tumor replication-linked clock with genome-wide methylation loss in non-CpG island sites. Unexpectedly, methylation in most tumor CpG islands follows two replication-independent processes of gain (MG) or loss (ML) that we term epigenomic instability. Epigenomic instability is correlated with tumor grade and stage, TP53 mutations and poorer prognosis. After controlling for these global trans-acting trends, as well as for X-linked dosage compensation effects, cis-specific methylation and expression correlations are uncovered at hundreds of promoters and over a thousand distal elements. Some of these targeted known tumor suppressors and oncogenes. In conclusion, this study demonstrates that global epigenetic instability can erode cancer methylomes and expose them to localized methylation aberrations in-cis resulting in transcriptional changes seen in tumors.


Conflict of interest statement

S.A.J.R.A. is founder and shareholder of Contextual Genomic and a scientific advisor to Sangamo Biosciences and Takeda Pharmaceuticals. C.C. is a scientific advisor to AstraZeneca-iMed and has received research funding (administered by the University of Cambridge) from AstraZeneca, Servier, and Genentech/Roche.

Figures

Fig. 1
Fig. 1. Dissecting tumor, immune, and CAF methylation in the METABRIC cohort.
a Distribution of METABRIC samples used for RRBS profiling. b Number of samples (Y axis) with a given number of CpGs (X axis) covered with at least 10, 20, 30, or 50 reads. For example, in all samples 449,710 CpGs are covered with over 10 reads. c Distribution of TSS distance (top) and CpG content (bottom) for CpGs covered by at least 5 reads in half or more samples. d Distribution of mean promoter coverage over all METABRIC samples, considering 13,198 active promoters (“Methods”). e The Methylayer analysis pipeline. Integration of data is marked by black arrows. Annotation of the model is marked by blue dashed arrows. f Correlation of average expression of CD3D/CAV1 and the immune/CAF methylation module. g Distribution of tumor grade stratified by five bins of Immune/CAF methylation scores (χ2 test: p = 0.0056 for Immune score in ER+, p = 0.3052 for Immune score in ER−, p = 0.00001 for CAF score in ER+, p = 0.0031 for CAF score in ER−). *p ≤ 0.05, **p ≤ 0.01, ***p ≤ 0.001, ****p ≤ 0.0001. h Distribution of correlations of four key gene expression profiles with raw-methylation levels of individual gene promoters (X axis), versus the correlation derived after normalizing methylation for CAF/immune composition using a K-nn strategy (as described in “Methods”). Flattening of the post normalization correlations demonstrate the effect of the CAF/immune normalization, while maintenance of the post normalization correlations demonstrates that the genes that are not affected by normalization. i Distribution of average (non-normalized) methylation over loss-clock loci (correlation over 0.6 with the score) for normal breast, ER+ and ER− breast cancer samples (two-tailed Kolmogorov–Smirnoff test, p < 2.2e−16). j Distribution of tumor grade stratified by five bins of loss-clock score. k Distribution of TSS distance for loss-clock loci versus other loci (two-tailed Kolmogorov–Smirnoff test, p < 2.2e−16). l Distribution of time-of-replication for loss-clock loci (red) versus overall distribution of non-promoter loci (gray) (two-tailed Kolmogorov–Smirnoff test, p < 2.2e−16). m Replication time classifications for chromosome 1 (top color-coded bar). The average methylation in non-promoter loci, computed for normal breast tissues (gray), and two ER+ breast cancer groups with high (red) and low (blue) clock scores, respectively, is shown below.
Fig. 2
Fig. 2. Epigenomic instability in breast cancers.
a Color-coded maps represent 201,082 genomic loci projected over the two first principal components given their correlations with the three Methylayer scores. b Distribution of average (non-normalized) methylation over MG and ML loci (correlation over 0.5 with each score) for normal breast, ER+ and ER− breast cancer samples (two-tailed Kolmogorov–Smirnoff test: MG loci, p < 2.2e−16; ML loci, p < 2.2e−16). c Fraction of enhancers (grouped by their normal methylation level) that are linked (correlation > 0.25) with each of the three Methylayer scores. d Distribution of ER+ tumor grade stratified by five bins of MG/ML methylation scores. ****p < 0.0001 (χ2 test: MG loci, p = 0.000002; ML loci, p < 5.4e−10). e Comparing ML and MG scores over ER+ and ER− samples. f Clustered correlation heat map between normalized methylation profiles (columns, including all loci with correlation >0.3 for MG or ML) and matching gene expression (rows) in ER+ tumors. Clusters are labeled by their top correlated gene. Complete information is available in Supplementary Data 4. g Groups of genes showing positive expression correlation with the MG score (see Supplementary Data 6. Complete information for ML score is also available in this table).
Fig. 3
Fig. 3. Expression–methylation correlation in cis.
a Plot of the 50 genes with strongest negative correlation (red) of expression with their own promoter methylation profile (in cis E–M correlation) in ER+ tumors, compared to the correlation with the second strongest promotor locus in the genome (out of 9360 candidates, gray). b Distribution of the difference between in cis E–M correlation, and the top correlation of the same gene with any other promoter. Positive values represent cases where the in cis E–M correlation is the maximum. c For 612 genes with support for in cis E–M correlation, we show the distribution of differential tumor expression relative to matched normal tissues. Repressed/induced: over twofold change. d For 612 promoters with support for in cis E–M correlation, we show the distribution of differential methylation compared to matched normal tissues. Hyper-/hypo-methylated: over 0.2 different in average methylation. e Correlation of CpG methylation with gene expression in KRT7 locus (in ER+ tumors) and BRCA1 (in ER− tumors). f Distribution of Epi-polymorphism for promoters defined with high in cis E–M correlation. Shown are promoters that had at least one tumor sample with average methylation above 0.05 (red, n = 306). Loci are grouped by average promoter methylation and other promoter loci (gray, n = 3570) are provided for control. *p ≤ 0.05, **p ≤ 0.01, ***p ≤ 0.001, ****p ≤ 0.0001 (one-sided Wilcox test). The middle line indicates the median, box limits represent quartiles, and whiskers are 1.5× the interquartile range. g Left: Cumulative distribution of the distance between methylation loci and the promoter with highest expression correlation to them (within the same chromosome, two-tailed Kolmogorov–Smirnoff test, p < 2.2e−16). Right: fraction of loci for which the best-correlated promoter is located on the same chromosome. Gray line/bars represent shuffled controls (see “Methods”). h Examples for matching expression and methylation for non-promoter genomic loci located in the proximity of their most correlated gene (DNMT3A and TBX1 in ER+ tumors; GATA3 and FGFR4 in ER− tumors). Above: Location of the non-promoter genomic loci (red arrow) relative to the TSS of the gene (blue arrow). Below: Correlation of the matching expression of the most correlated gene (X axis) and methylation (Y axis) for the non-promoter genomic loci.
Fig. 4
Fig. 4. Epigenomic instability correlates with genomic features and with poor survival.
a Projection of METABRIC tumor samples on a unified epigenetic signatures space, colored by the five epigenetic scores, ER status, grade, stage, TP53, and PIK3CA mutations. b Tumors were stratified into five groups (bars) for each of five different methylation signatures (rows). Shown are the fraction of cases with specific mutations in each stratum. *FDR ≤ 0.05, **FDR ≤ 0.01, ***FDR ≤ 0.001, ****FDR ≤ 0.0001 (two-sided Wilcox test). c Boxplots show distribution of epigenomic signatures in ER+ (left, n = 1108) and ER− (right, n = 310) cancers stratified according to estimated chromosomal instability levels (derived from CNA data). *p ≤ 0.05, **p ≤ 0.01, ***p ≤ 0.001, ****p ≤ 0.0001 (Spearman rho). The middle line indicates the median, box limits represent quartiles, and whiskers are 1.5× the interquartile range. d Kaplan–Meier survival plots for ER+ (top, n = 1108) and ER− (bottom, n = 310) tumors grouped into high-scoring and low-scoring groups for each epigenomic signature (top 1/3 and bottom 1/3 of the samples). 95% confidence intervals are shown. Log-rank p-values for survival difference are reported. e Log hazard ratios (normalized by SD) calculated for each epigenomic signature using 4 distinct Cox proportional hazards regression models: (i) Univariable (unadjusted for confounders); CP (adjusted for clinico-pathological variables—age, grade, tumor size, and lymph node status); CP + IntClust (adjusted for clinico-pathological variables and integrative cluster subtypes). Censoring at 15 years. Mean with 95% confidence intervals are shown. Models are stratified for ER+ (left, n = 1055) and ER− (right, n = 300) tumors.
Fig. 5
Fig. 5. Unified model delineating the multi-factorial processes giving rise to breast cancer DNA methylation.
As the carcinogenesis process progresses (top), epigenomes are affected by replication-dependent methylation loss in most of the genome, and by a second, uncorrelated epigenetic instability process modulating methylation in promoters and enhancers. When cancer epigenomes are surveyed (middle), the observed profiles involve a superposition of TME signatures, with the patient-specific replication and instability signatures, and with epigenetic dosage compensation. These processes are each affecting a large number of genomic loci through one common mechanism (in trans effects). Additional localized patient-specific methylation aberrations are uncorrelated with these in trans effects and may regulate gene expression in cis. Deconvolution of these multi-layered effects shows linkage between epigenetic instability and disease stage and prognosis (bottom). Cancer epigenomic heterogeneity is also induced by cellular heterogeneity (such as clonal structure).

References

    1. Hanahan, D. & Weinberg, R. A. The hallmarks of cancer. Cell100, 57–70 (2000). - PubMed
    1. Ciriello G, Cerami E, Sander C, Schultz N. Mutual exclusivity analysis identifies oncogenic network modules. Genome Res. 2012;22:398–406. doi: 10.1101/gr.125567.111. - DOI - PMC - PubMed
    1. Saghafinia, S., Mina, M., Riggi, N., Hanahan, D. & Ciriello, G. Pan-cancer landscape of aberrant DNA methylation across human tumors. Cell Rep.25, 1066–1080 (2018). - PubMed
    1. Feinberg AP, Vogelstein B. Hypomethylation distinguishes genes of some human cancers from their normal counterparts. Nature. 1983;301:89–92. doi: 10.1038/301089a0. - DOI - PubMed
    1. Herman, J. G., Graff, J. R., Myohanen, S., Nelkin, B. D. & Baylin, S. B. Methylation-specific PCR: a novel PCR assay for methylation status of CpG islands. Proc. Natl Acad. Sci. USA10.1073/pnas.93.18.9821 (2002). - PMC - PubMed

Publication types