. 2021 Sep 13;12(1):5403.
doi: 10.1038/s41467-021-25652-x.

Ectomycorrhizal access to organic nitrogen mediates CO2 fertilization response in a dominant temperate tree

Affiliations

Ectomycorrhizal access to organic nitrogen mediates CO2 fertilization response in a dominant temperate tree

Peter T Pellitier et al. Nat Commun. .

Abstract

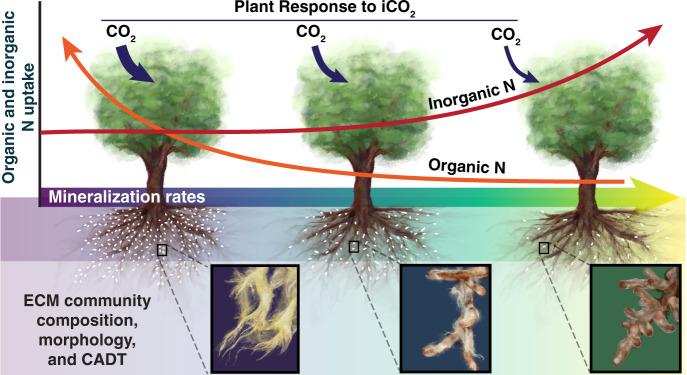
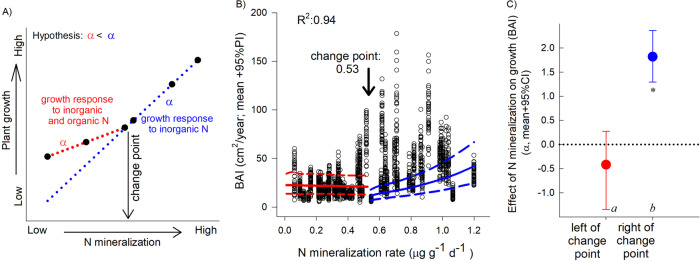
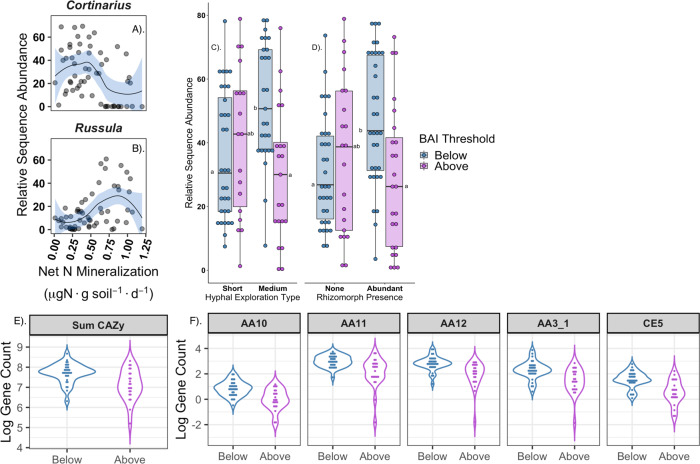
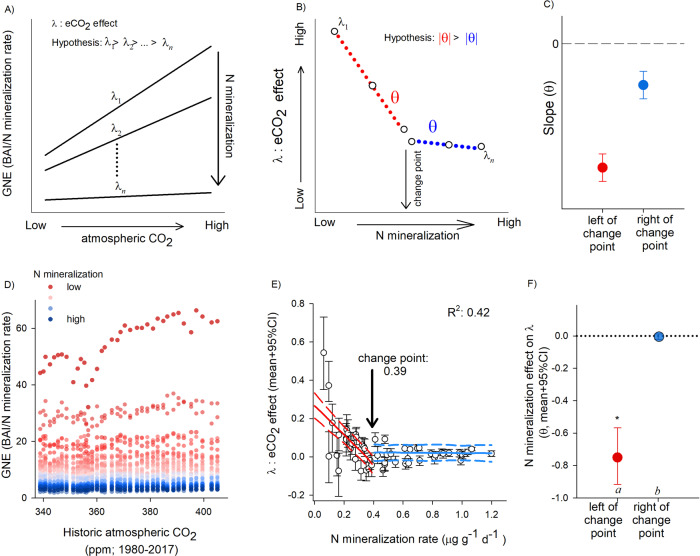
Plant-mycorrhizal interactions mediate plant nitrogen (N) limitation and can inform model projections of the duration and strength of the effect of increasing CO2 on plant growth. We present dendrochronological evidence of a positive, but context-dependent fertilization response of Quercus rubra L. to increasing ambient CO2 (iCO2) along a natural soil nutrient gradient in a mature temperate forest. We investigated this heterogeneous response by linking metagenomic measurements of ectomycorrhizal (ECM) fungal N-foraging traits and dendrochronological models of plant uptake of inorganic N and N bound in soil organic matter (N-SOM). N-SOM putatively enhanced tree growth under conditions of low inorganic N availability, soil conditions where ECM fungal communities possessed greater genomic potential to decay SOM and obtain N-SOM. These trees were fertilized by 38 years of iCO2. In contrast, trees occupying inorganic N rich soils hosted ECM fungal communities with reduced SOM decay capacity and exhibited neutral growth responses to iCO2. This study elucidates how the distribution of N-foraging traits among ECM fungal communities govern tree access to N-SOM and subsequent growth responses to iCO2.


Conflict of interest statement

The authors declare no competing interests.

Figures

Fig. 1
Fig. 1. Hypothesized contribution of different nitrogen (N) forms to tree growth (red and orange lines; y-axis) and tree responses to historic increases in CO2 (iCO2).
These responses occur along a gradient of varying supply rates of inorganic N (net N mineralization rates: x-axis). Dark blue arrows show the relativized fertilization response (arrow width) to iCO2. ECM fungal community composition, morpho-traits, and community aggregated decay traits (CADT) estimated using metagenomic approaches, are  hypothesized to vary with soil inorganic N availability. Note hypothesized turnover in the dominance of ECM taxa with extra-radical rhizomorphic hyphae and long-and medium-distance exploration morphologies. White speckles on roots depict hypothesized relative abundance of ECM root-tips. Illustration by Callie R. Chappell, with permission from Reinhard Agerer.
Fig. 2
Fig. 2. Analysis framework and modeled contribution of inorganic N and N-SOM to plant growth.
A Representative analysis of tree growth as a function of net N mineralization rates. The change point analysis identifies the occurrence and location of an inflection point, if any, and the value of the slope parameters on each side. B Basal Area Increment (BAI), from 54 Q. rubra trees along the studied net N mineralization gradient (black circles correspond to an individual growth year). Red and blue lines indicate model estimated BAI mean and 95% PI above and below the identified change-point (BAI change point; estimates were calculated at average values of the other covariates). R2 denotes overall Bayesian model fit. C Slope parameters are significantly different from each other (95% CIs do not overlap; different letters (n = 54). Asterisks indicates parameter is different from zero (95% CI does not overlap with zero).
Fig. 3
Fig. 3. Compositional, morphological and functional turnover along the soil nitrogen gradient consistent with shifts in ectomycorrhizal (ECM) fungal N foraging traits.
A, and B relative sequence abundance of the ECM fungal genera Cortinarius and Russula along the gradient of net N mineralization rates (x-axis). Colored bands depict GAM fits. C Box-and whisker plot depicting ECM fungi forming short or medium-distance exploration types. Letters denote statistical significance D. ECM fungi forming rhizomorphic hyphae above and below the BAI statistical threshold (0.53 µgN g soil−1 day−1); letters adjacent to median line of box, denote statistical significance, points are individual communities totaling n = 58. Upper and lower hinges depict 25th and 75th percentiles. E Sum of CAZy gene counts (n = 100 gene families). F Specific gene families (headers) significantly enriched below the BAI change point. AA10, AA11 encode lytic polysaccharide monooxygenases, AA12 is an oxidoreductase, AA3_1: cellobiose dehydrogenase, CE5: acetyl xylan esterase.
Fig. 4
Fig. 4. Analysis framework and evidence for context-dependent iCO2 fertilization responses.
A Representative analysis framework of growth-nitrogen efficiency index (GNE) as a function of increasing concentrations of historic atmospheric CO2 at each point along the net N mineralization gradient (different lines and their relative slopes). B Conceptual diagram of the effects of iCO2 (λ) on plant growth; change point analysis can detect an inflection point along the soil gradient, if any. C Differences in θ derived from the red and blue portion of panel B, indicate distinct slope values. D Dendrochronological data collected from 54 Q. rubra trees from the past 38 years. Individual points represent estimated annual GNE values colored by tree-specific rates of net-N mineralization. E Individual points represent individual trees response to iCO2 (mean model slopes derived from D) over the study period. Red and blue lines denote Bayesian change-point model with plotted 95% PI (dashed lines; estimated at average values of other covariates) (n = 54). F Denotes mean and 95% CI for the red and blue slopes depicted in E; different letters denote significant differences between slopes, asterisks indicate significant differences from zero (95% CI do not include zero; n = 54).

References

    1. Campbell JE, et al. Large historical growth in global terrestrial gross primary production. Nature. 2017;544:84–87. doi: 10.1038/nature22030. - DOI - PubMed
    1. Schwalm CR, et al. Modeling suggests fossil fuel emissions have been driving increased land carbon uptake since the turn of the 20th Century. Sci. Rep. 2020;10:9059. doi: 10.1038/s41598-020-66103-9. - DOI - PMC - PubMed
    1. Wenzel S, Cox PM, Eyring V, Friedlingstein P. Projected land photosynthesis constrained by changes in the seasonal cycle of atmospheric CO2. Nature. 2016;538:499–501. doi: 10.1038/nature19772. - DOI - PubMed
    1. Piao S, et al. Characteristics, drivers and feedbacks of global greening. Nat. Rev. Earth Environ. 2020;1:14–27. doi: 10.1038/s43017-019-0001-x. - DOI
    1. Ellsworth DS, et al. Elevated CO2 does not increase eucalypt forest productivity on a low-phosphorus soil. Nat. Clim. Change. 2017;7:279–282. doi: 10.1038/nclimate3235. - DOI

Publication types