. 2021 Sep 13;12(1):5401.
doi: 10.1038/s41467-021-25642-z.

OPTN is a host intrinsic restriction factor against neuroinvasive HSV-1 infection

Affiliations

OPTN is a host intrinsic restriction factor against neuroinvasive HSV-1 infection

Joshua Ames et al. Nat Commun. .

Abstract

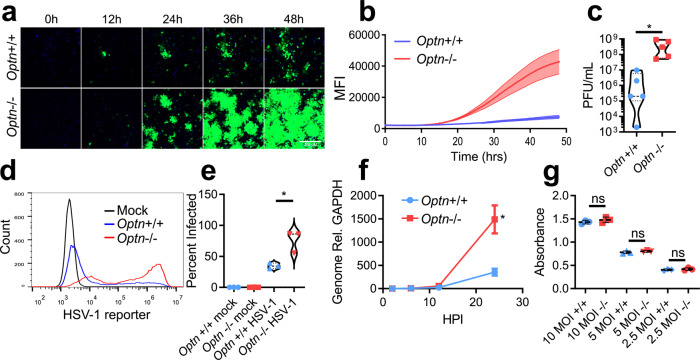
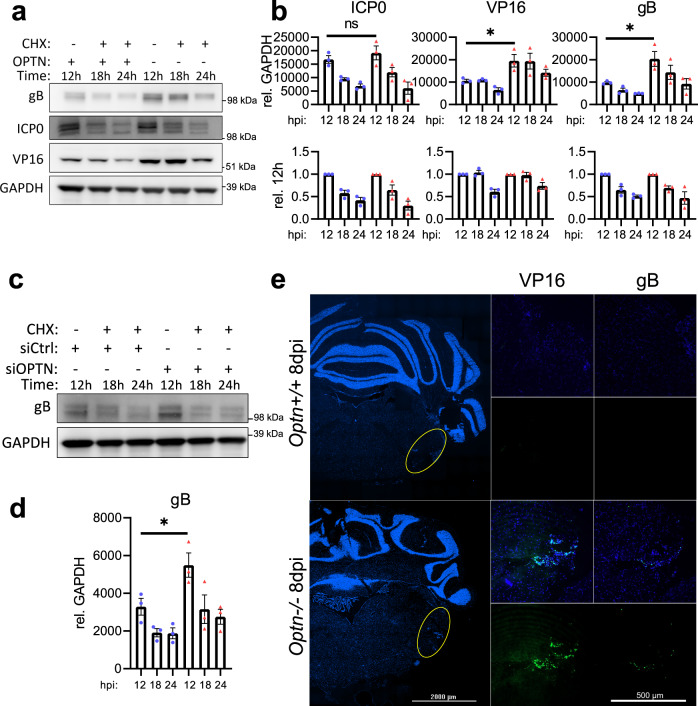
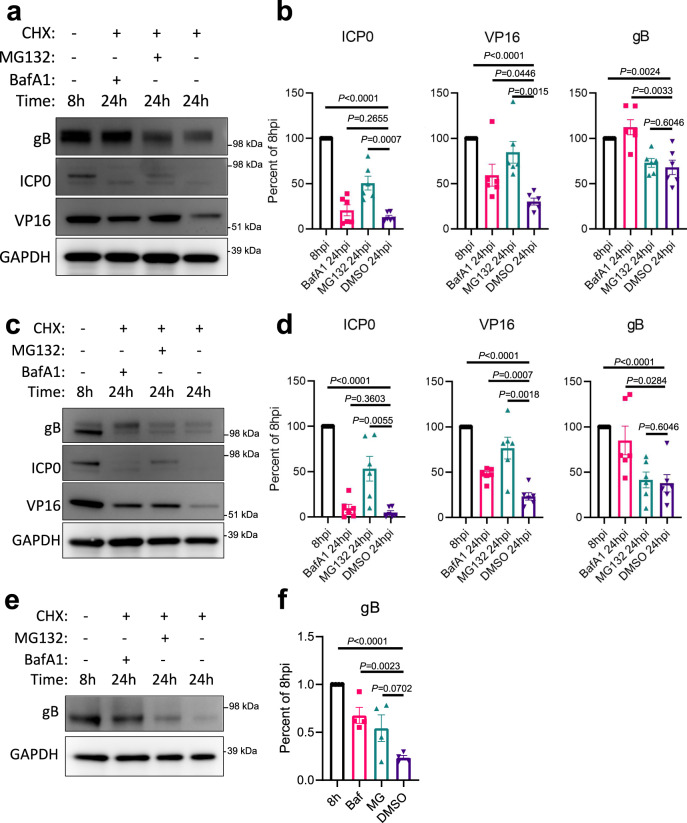
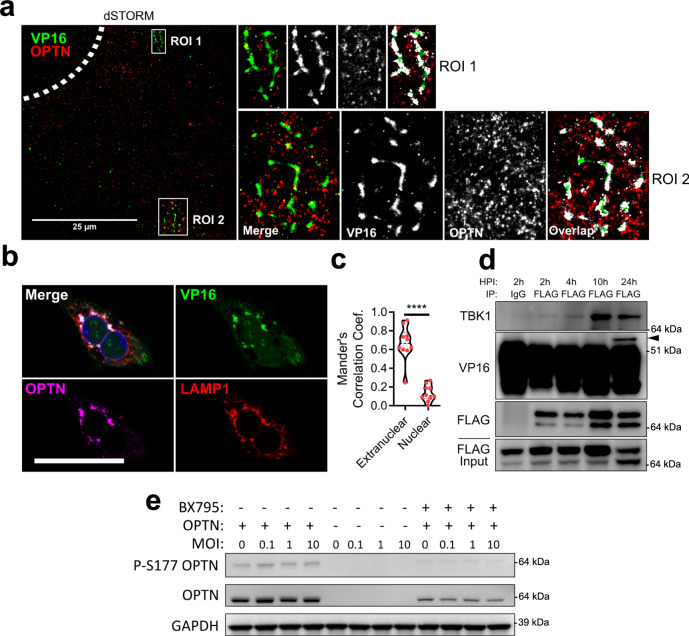
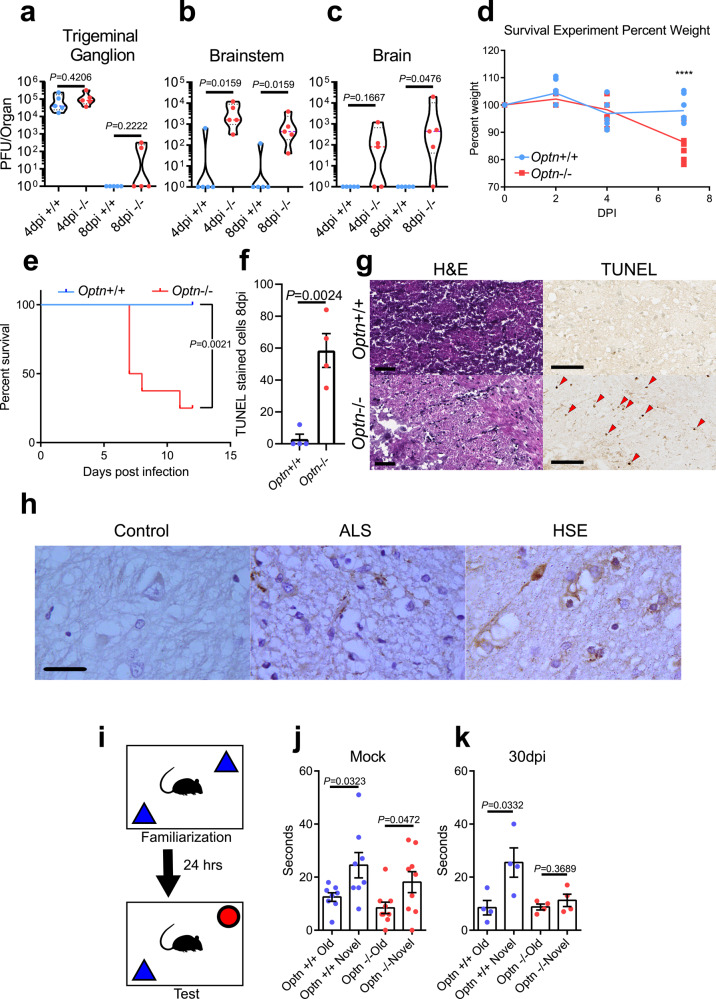
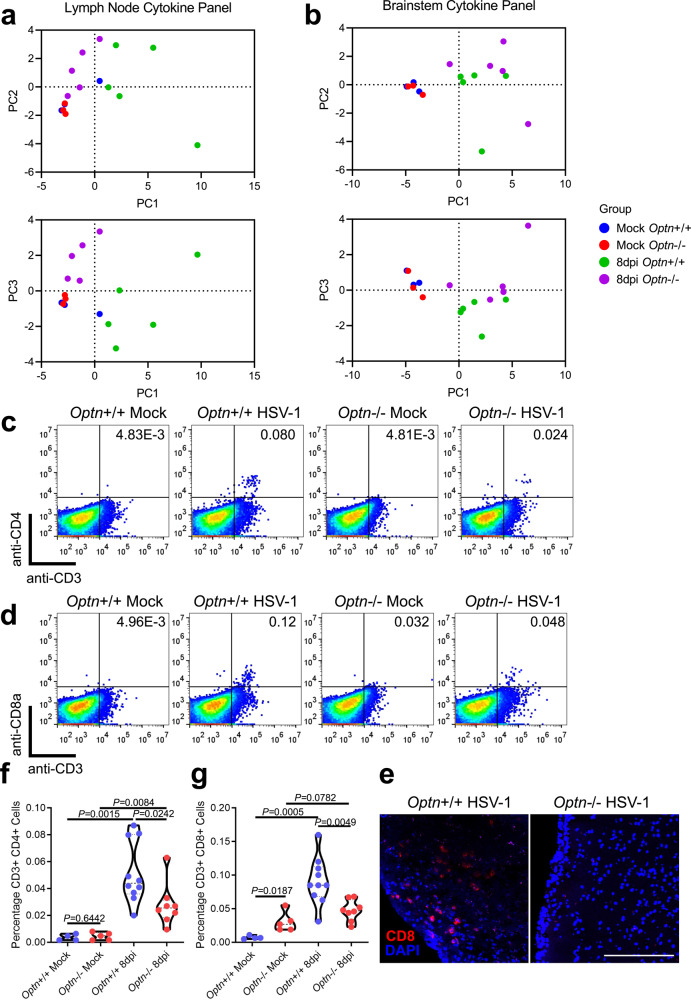
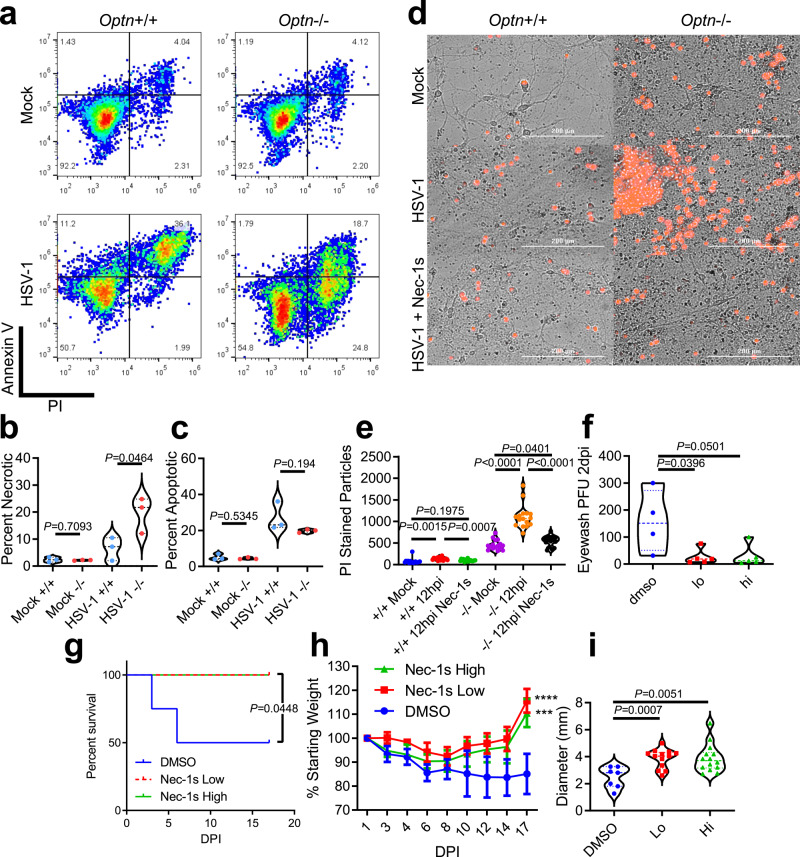
Fast-replicating neurotropic herpesviruses exemplified by herpes simplex virus-1 (HSV-1) naturally infect the central nervous system (CNS). However, most individuals intrinsically suppress the virus during a primary infection and preclude it from significantly damaging the CNS. Optineurin (OPTN) is a conserved autophagy receptor with little understanding of its role in neurotropic viral infections. We show that OPTN selectively targets HSV-1 tegument protein, VP16, and the fusion glycoprotein, gB, to degradation by autophagy. OPTN-deficient mice challenged with HSV-1 show significant cognitive decline and susceptibility to lethal CNS infection. OPTN deficiency unveils severe consequences for recruitment of adaptive immunity and suppression of neuronal necroptosis. Ocular HSV-1 infection is lethal without OPTN and is rescued using a necroptosis inhibitor. These results place OPTN at the crux of neuronal survival from potentially lethal CNS viral infections.


Conflict of interest statement

The authors declare no competing interests.

Figures

Fig. 1
Fig. 1. OPTN restricts spread of HSV-1.
a Representative time-lapse imaging of Optn+/+ and −/− cells infected with GFP-HSV-1 17-strain at 0.1 MOI for 48 h. Time interval was 30 min. Scale bar is 250 µm. b Quantification of average time-lapse fluorescent intensity over time for three replicates. c Violin plot of Optn+/+ and −/− cells infected with HSV-1 at 0.1 MOI and assayed for plaques 24 hpi. n = 5 independent replicates per group. P = 0.0446. d, e (left) Histogram of Optn+/+ and −/− cells infected with GFP- HSV-1 at 0.1 MOI 24 hpi measured by flow cytometry, (right) violin plot of percentage of cells infected with GFP-HSV-1. n = 3 independent replicates per group. P = 0.0174. f Genomes present in Optn+/+ and −/− cells infected with GFP- HSV-1 at 0.1 MOI. n = 3 independent replicates per group. P = 0.0220. g Colorimetric readout of replication deficient and β-galactosidase expressing HSV-1 infected Optn+/+ and −/− cells at multiple MOIs. n = 3 independent replicates per group. P = 0.3083 (10 MOI), P = 0.3575 (5 MOI), P = 0.4945 (2.5 MOI). Data are presented as mean values ± SEM (b, f). Two-tailed Student’s t test was performed for statistical analysis (α = 0.05). p < 0.05; ns not significant. Source data are provided as a Source Data file.
Fig. 2
Fig. 2. OPTN suppresses expression of essential HSV-1 proteins VP16 and gB, but not ICP0.
Optn+/+ and −/− HeLa cells or siOPTN and siCtrl transfected HCE cells were infected at 1 MOI with HSV-1 17-strain for 12 h before CHX addition to block protein synthesis, then cells were sampled at 12 h, 18 h, and 24 h after infection. a Shown for HeLa cells are immunoblots against the HSV-1 proteins gB, ICP0, VP16, and the internal reference GAPDH, b with band quantification relative to GAPDH or relative to initial normalized protein levels (n = 3 replicates). P = 0.4591 (ICP0), P = 0.0368 (VP16), P = 0.0347 (gB). c Shown for HCE cells are immunoblots against the HSV-1 protein gB and the internal reference GAPDH, d with band quantification relative to GAPDH (n = 3 replicates). P = 0.0475. e Representative staining for VP16 and gB in brainstems of HSV-1 infected Optn+/+ or −/− mice 8 dpi. Data are presented as mean values ± SEM (b, d). Two-tailed Student’s t test was performed for statistical analysis (α = 0.05). p < 0.05; ns not significant. Source data are provided as a Source Data file.
Fig. 3
Fig. 3. HSV-1 VP16 and gB, but not ICP0, are degraded in an autophagy dependent manner.
Wildtype cells were infected at 1 MOI with HSV-1 17-strain for 8 h before CHX addition to block protein synthesis. In combination with CHX, either the autophagy inhibitor BafA1, the proteosome inhibitor MG132, or DMSO were added to cells. Cells were sampled at 8 h, and 24 h after infection. a Shown for HeLa cells are immunoblots against the HSV-1 proteins gB, ICP0, VP16, and the internal reference GAPDH, b with band quantification relative to GAPDH (n = 6 replicates). c Shown for HCE cells are immunoblots against the HSV-1 proteins gB, ICP0, VP16, and the internal reference GAPDH, d with band quantification relative to GAPDH (n = 6 replicates). Similarly, LUHMES cells were infected at 2.5 MOI with HSV-1 17-strain for 8 h before CHX addition to block protein synthesis. In combination with CHX, either BafA1, MG132 or DMSO were added to cells. Cells were sampled at 8 h, and 24 h after infection. e Shown for LUHMES cells are immunoblots against the HSV-1 protein gB and the internal reference GAPDH, f with band quantification relative to GAPDH (n = 4 replicates). Data are presented as mean values ± SEM (b, d, f). Two-tailed Student’s t test was performed for statistical analysis (α = 0.05). p < 0.05; ∗∗p < 0.01; ∗∗∗p < 0.001, ∗∗∗∗p < 0.0001, ns not significant. Source data are provided as a Source Data file.
Fig. 4
Fig. 4. OPTN is associated with VP16 during HSV-1 infection and is activated by TBK1.
a dSTORM super-resolution microscopy for OPTN and VP16 staining. Enlarged images highlight association of OPTN and VP16 stained structures. Shown to the right are the enlarged images for regions of interest (ROI) representing the merged images, the raw signal for VP16 and OPTN, and the pixel overlap between the channels. Scale bar is 25 µm. Dashed line represents nucleus. b Representative image of Optn+/+ cells infected with VP16-gfp HSV-1 at MOI 1 for 12 h stained for OPTN and LAMP1. Scale bar is 50 µm. c Mander’s colocalization coefficient representing the proportion of VP16 and OPTN co-staining. n = 10 cells analyzed for colocalization. P < 0.0001. d Immunoblot of anti-FLAG co-immunoprecipitation of Optn+/+ cells expressing FLAG-OPTN and infected with HSV-1 at 1 MOI. Arrow points to VP16 band. e Immunoblot of Optn+/+, Optn−/−, or Optn+/+ cells treated with TBK1 inhibitor, BX795 (50 µM), infected with HSV-1 for 3 h. Two-tailed Student’s t test was performed for statistical analysis (α = 0.05). ∗∗∗∗p < 0.0001. Source data are provided as a Source Data file.
Fig. 5
Fig. 5. OPTN is neuroprotective against herpes simplex virus encephalitis.
Mice were infected using corneal scarification using 5 × 105 PFU of HSV-1 McKrae strain. ac Tissue plaque assay for trigeminal ganglion (left), brainstem (middle), and brain (right) (n = 5 mice per group). Two-tailed Mann–Whitney U test was used where p < 0.05 indicates significance. d Weight changes of mice (n = 5 mice per group) up to 7dpi. Two-way repeated-measures ANOVA F(3,42) = 9.908, p < 0.0001. e Kaplan–Meier curve for HSV-1 infected Optn+/+ (n = 8) and −/− (n = 8) mice. Logrank test was used to compare curves with p < 0.05 being significant. f, g (left) Quantitation of TUNEL stained cells in brainstems of Optn+/+ and −/− mice 8dpi (n = 4 mice per group). (right) Representative images of H&E staining and TUNEL staining (dark brown) for brainstems. Arrows highlight TUNEL positive cells. Scale bar is 50 µm. h Immunohistochemistry staining of OPTN (dark brown) in human brainstem tissue from a healthy, amyotrophic lateral sclerosis (ALS), or HSE patient shows aggregation of OPTN protein expression in diseased tissues. Scale bar is 100 µm. i Schematic of Novel Object Recognition (NOR) test for mice. j mock-infected Optn+/+ and −/− mouse exploration times for old and novel objects. (n = 8 mice per group) (k) Optn+/+ and −/− mouse exploration times for old and novel objects at 30 dpi with 1 × 105 PFU of HSV-1 McKrae strain (n = 4 mice per group). Data are presented as mean values ± SEM (f, j, k). Unless otherwise indicated, Two-tailed Student’s t test was performed for statistical analysis (α = 0.05). p < 0.05; ∗∗p < 0.01; ∗∗∗∗p < 0.0001, ns not significant. Source data are provided as a Source Data file.
Fig. 6
Fig. 6. OPTN deficiency impairs recruitment of CD4 and CD8 lymphocytes to the CNS.
Principal component analysis of cytokine protein expression profiles from 8dpi (n = 5 mice per group) or mock infected (n = 3 mice per group) Optn+/+ or −/− mice to compare (top) PC1 vs PC2 or (bottom) PC1 vs PC3 are shown for a draining lymph nodes and b brainstems. Brainstem cell suspensions from mock infected Optn+/+ (n = 4 mice), mock infected Optn−/− (n = 5 mice), 8dpi Optn+/+ (n = 10 mice), and 8 dpi Optn −/− (n = 8 mice) were analyzed using flow cytometry to measure the percentage of T cells present. c Dot plots representing CD3 + CD4 + cells. d Dot plots representing CD3 + CD8 + cells. f Quantification of percentage CD3 + CD4 + cells. g Quantification of CD3 + CD8 + cells. e Staining for CD8 in 8 dpi mouse brainstem tissue. Scale bar is 200 µm. Two-tailed Student’s t test was performed for statistical analysis (α = 0.05). p < 0.05; ∗∗p < 0.01; ∗∗∗p < 0.001, ns, not significant. Source data are provided as a Source Data file.
Fig. 7
Fig. 7. OPTN suppresses necroptosis in vitro and in neurons during HSV-1 infection.
a Dot plots of flow cytometry analysis of Optn+/+ and −/− cells stained for Annexin V and propidium iodide (PI). b, c Percentage of (b) Annexin V lo, PI hi cells indicating necrotic cells or c Annexin V hi, PI hi cells indicating apoptotic cells. d Representative images of primary embryonic neurons from Optn+/+ or −/− mice that were mock infected, HSV-1 infected, or HSV-1 infected and Nec-1s treated. Dead cells were stained using PI (Red). e Image quantification of PI-stained primary neurons. fi Optn−/− were treated with hi Nec-1s (n = 5 mice), lo Nec-1s (n = 5 mice), or DMSO (n = 4 mice) during infection. f Plaque assay on ocular washes from Optn−/− mice 2 dpi. g Kaplan–Meier curve for HSV-1 infected Optn−/− treated with DMSO, lo or hi Nec-1s. Logrank test for trend was used to compare curves with P < 0.05 being significant. h Percentage of initial weight over time. Two-way repeated-measures ANOVA F(16,88) = 1.758, p = 0.0503, multiple comparisons at 17 dpi (DMSO vs. Nec-1s Low) p < 0.0001, (DMSO vs. Nec-1s High) p = 0.0009. i dLN diameters for Optn−/− mice treated with DMSO, lo Nec-1s, or hi Nec-1s at 17dpi and data are presented as mean values ± SEM. Unless otherwise stated Two-tailed Student’s t test was performed for statistical analysis (α = 0.05). p < 0.05; ∗∗p < 0.01; ∗∗∗p < 0.001, ∗∗∗∗p < 0.0001, ns not significant. Source data are provided as a Source Data file.

References

    1. Eimer WA, et al. Alzheimer’s disease-associated β-amyloid is rapidly seeded by herpesviridae to protect against brain infection. Neuron. 2018;100:1527–1532. doi: 10.1016/j.neuron.2018.11.043. - DOI - PubMed
    1. Readhead B, et al. Multiscale analysis of independent Alzheimer’s cohorts finds disruption of molecular, genetic, and clinical networks by human herpesvirus. Neuron. 2018;99:64–82. doi: 10.1016/j.neuron.2018.05.023. - DOI - PMC - PubMed
    1. Krueger GRF, et al. Comparison of seroprevalences of human herpesvirus-6 and −7 in healthy blood donors from nine countries. Vox Sang. 1998;75:193–197. doi: 10.1046/j.1423-0410.1998.7530193.x. - DOI - PubMed
    1. Liesegang TJ. Herpes simplex virus epidemiology and ocular importance. Cornea. 2001;20:1–13. doi: 10.1097/00003226-200101000-00001. - DOI - PubMed
    1. Rezaie T, et al. Adult-onset primary open-angle glaucoma caused by mutations in optineurin. Science. 2002;295:1077–1079. doi: 10.1126/science.1066901. - DOI - PubMed

Publication types

MeSH terms