. 2021 Sep 13;11(1):18135.
doi: 10.1038/s41598-021-97623-7.

Human age-declined saliva metabolic markers determined by LC-MS

Affiliations

Human age-declined saliva metabolic markers determined by LC-MS

Takayuki Teruya et al. Sci Rep. .

Abstract

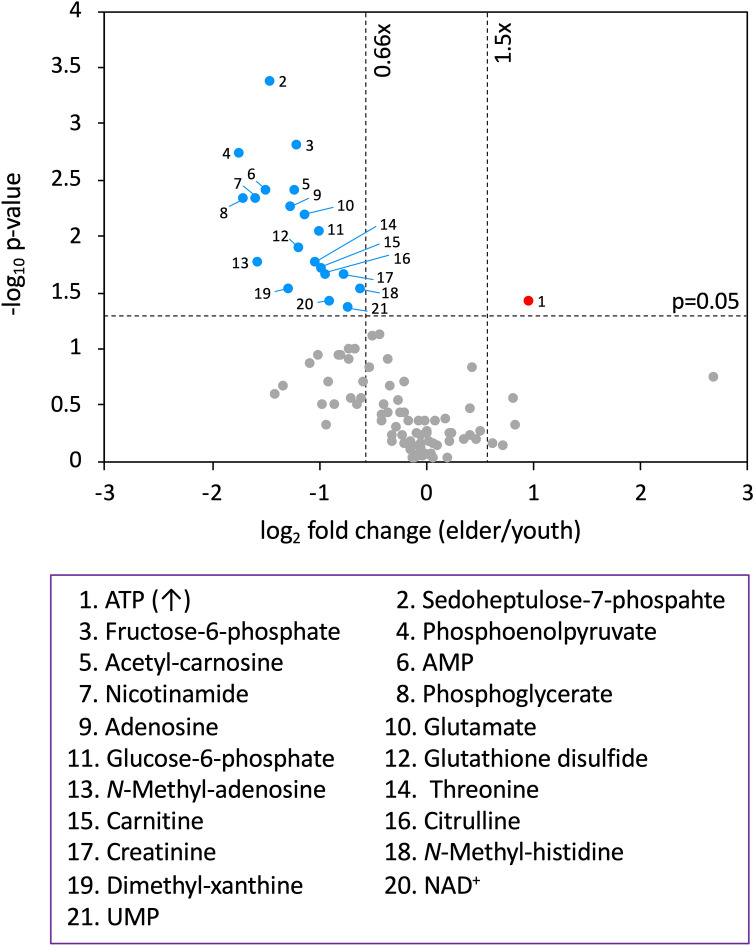
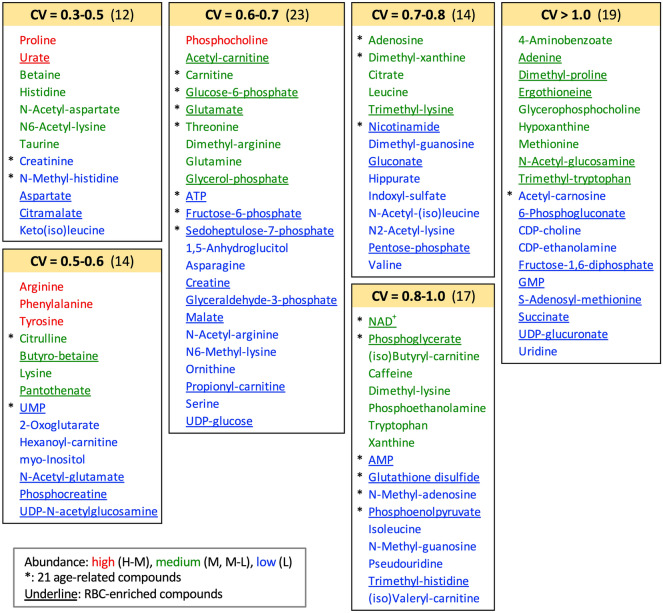
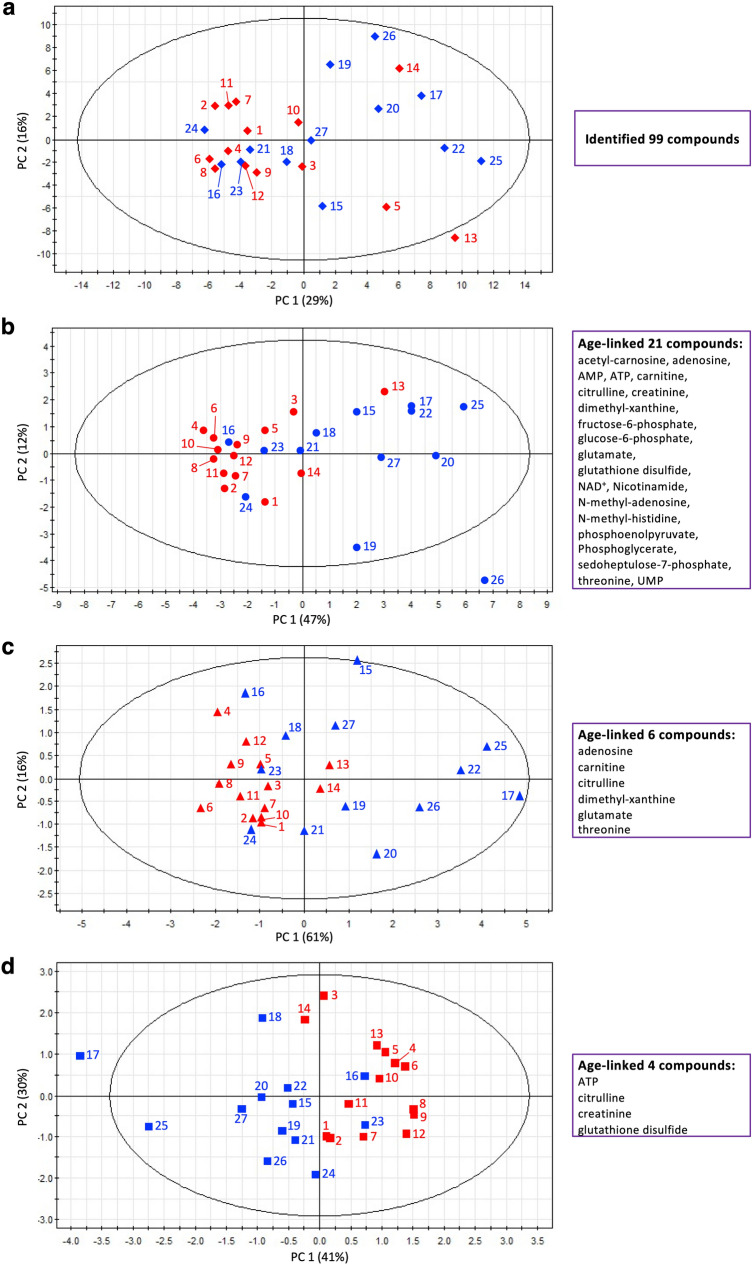
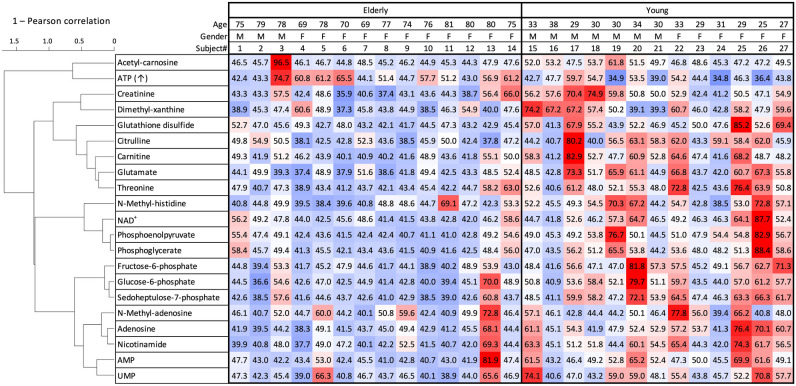
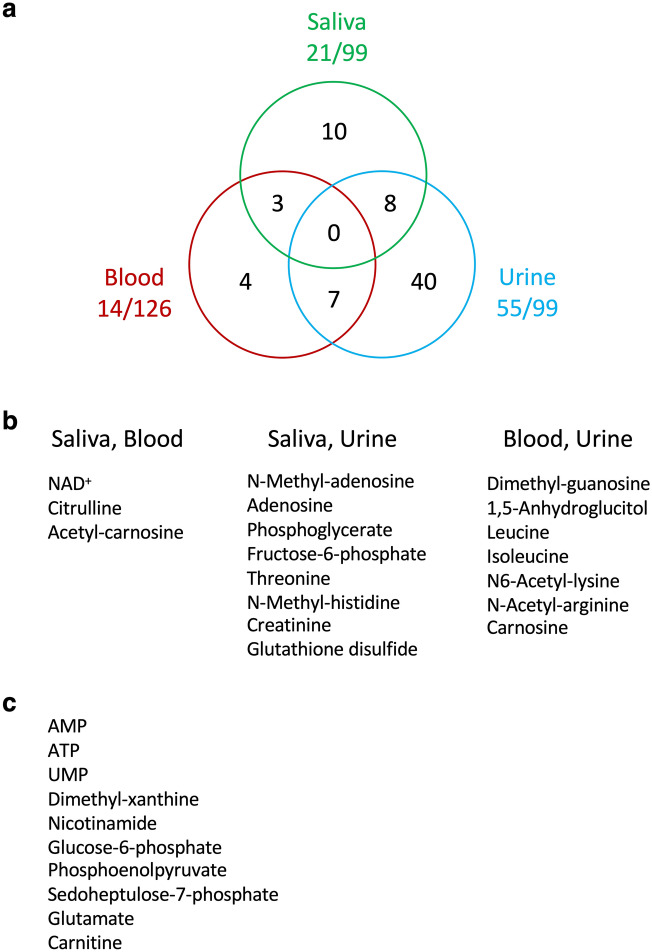
Metabolites in human biofluids reflect individual physiological states influenced by various factors. Using liquid chromatography-mass spectrometry (LC-MS), we conducted non-targeted, non-invasive metabolomics using saliva of 27 healthy volunteers in Okinawa, comprising 13 young (30 ± 3 year) and 14 elderly (76 ± 4 year) subjects. Few studies have comprehensively identified age-dependent changes in salivary metabolites. Among 99 salivary metabolites, 21 were statistically age-related. All of the latter decline in abundance with advancing age, except ATP, which increased 1.96-fold in the elderly, possibly due to reduced ATP consumption. Fourteen age-linked and highly correlated compounds function in a metabolic network involving the pentose-phosphate pathway, glycolysis/gluconeogenesis, amino acids, and purines/pyrimidines nucleobases. The remaining seven less strongly correlated metabolites, include ATP, anti-oxidation-related glutathione disulfide, muscle-related acetyl-carnosine, N-methyl-histidine, creatinine, RNA-related dimethyl-xanthine and N-methyl-adenosine. In addition, glutamate and N-methyl-histidine are related to taste, so their decline suggests that the elderly lose some ability to taste. Reduced redox metabolism and muscle activity are suggested by changes in glutathione and acetyl-carnosine. These age-linked salivary metabolites together illuminate a metabolic network that reflects a decline of oral functions during human aging.


Conflict of interest statement

The authors declare no competing interests.

Figures

Figure 1
Figure 1
Volcano plot showing different levels of salivary metabolites in young and elderly subjects. The x-axis is the log2 fold change, whereas the y-axis is the -log10 p value of the Mann Whitney U-test. Two vertical dashed lines show the border of 0.66- and 1.5-fold change, respectively. The horizontal dashed line shows a p value = 0.05. Plots represent significantly higher (red), lower (blue), and unchanged metabolites (gray) in the elderly group. Twenty-one metabolites manifesting age differences are listed in the purple box.
Figure 2
Figure 2
Coefficients of variation (CVs) of 99 salivary metabolites in 27 people from Onna Village, Okinawa. Compounds were classified into 6 sub-groups according to their CVs, as explained in Chaleckis et al.. Numbers of compounds belonging to subgroups are shown in parentheses. Abundances of compounds are semi-quantitatively indicated by their peak areas. In blood, compounds underlined are enriched in RBCs. Compounds shown with asterisks are age-related in saliva.
Figure 3
Figure 3
PCA of age-linked salivary compounds. (a) Taken together, all 99 identified metabolites cannot separate young (blue) and elderly subjects (red). (b) Oral aging may be detected by PCA of 21 age-linked metaoblites in a 2D manner (see text for explanation). Elderly subjects (no. 1–12, 14) are located in the negative domain of the x-axis, while young subjects (no. 15, 17–20, 22, 25–27) are located in the positive domain. However, four young subjects 16, 21, 23 and 24, appear in the negative domain, while elderly subject 13 is located in the positive domain. These positions parallel heatmap data (Fig. 4) which show metabolite levels for individual subjects. (c) Six metabolites can separate young and elderly subjects. (d) Even four metabolites largely separate them.
Figure 4
Figure 4
Hierarchical clustering heatmap of 21 salivary age-related metabolites in 14 elderly and 13 young subjects. Correlations between compounds are reflected by bar lengths, which is consistent with the correlation network data (Supplementary Fig. S3). Standardized scores (T scores) for each metabolite are represented by colors. The average value (50), white; values above average, red; values below average, blue. Color intensity of the cells reflects the T score. The cluster dendrogram was created by using R. Microsoft Excel was used to calculate T scores and create the heatmap.
Figure 5
Figure 5
Common human age-related metabolites in saliva, blood, and/or urine. (a) Numbers of shared compounds in overlapping regions. No compound was common to saliva, blood, and urine. Three, 7, and 8 compounds were common between saliva and blood, between blood and urine, and between saliva and urine, respectively. (b) Three, 8 and 7 age-linked compounds were found commonly between saliva and blood, between saliva and urine, and between blood and urine, respectively. (c) Ten salivary age-linked metabolites that did not overlap with blood or urine age-linked metabolites.

References

    1. Dettmer K, Aronov PA, Hammock BD. Mass spectrometry-based metabolomics. Mass Spectrom. Rev. 2007;26:51–78. doi: 10.1002/mas.20108. - DOI - PMC - PubMed
    1. Patti GJ, Yanes O, Siuzdak G. Innovation: Metabolomics: The apogee of the omics trilogy. Nat. Rev. Mol. Cell Biol. 2012;13:263–269. doi: 10.1038/nrm3314. - DOI - PMC - PubMed
    1. Chaleckis R, Murakami I, Takada J, Kondoh H, Yanagida M. Individual variability in human blood metabolites identifies age-related differences. Proc. Natl. Acad. Sci. USA. 2016;113:4252–4259. doi: 10.1073/pnas.1603023113. - DOI - PMC - PubMed
    1. Darst BF, Koscik RL, Hogan KJ, Johnson SC, Engelman CD. Longitudinal plasma metabolomics of aging and sex. Aging (Albany NY) 2019;11:1262–1282. doi: 10.18632/aging.101837. - DOI - PMC - PubMed
    1. Srivastava S. Emerging insights into the metabolic alterations in aging using metabolomics. Metabolites. 2019;9:301. doi: 10.3390/metabo9120301. - DOI - PMC - PubMed

Publication types