. 2022 Jan;21(1):110-119.
doi: 10.1038/s41563-021-01085-1. Epub 2021 Sep 13.

A microenvironment-inspired synthetic three-dimensional model for pancreatic ductal adenocarcinoma organoids

Affiliations

A microenvironment-inspired synthetic three-dimensional model for pancreatic ductal adenocarcinoma organoids

Christopher R Below et al. Nat Mater. 2022 Jan.

Abstract

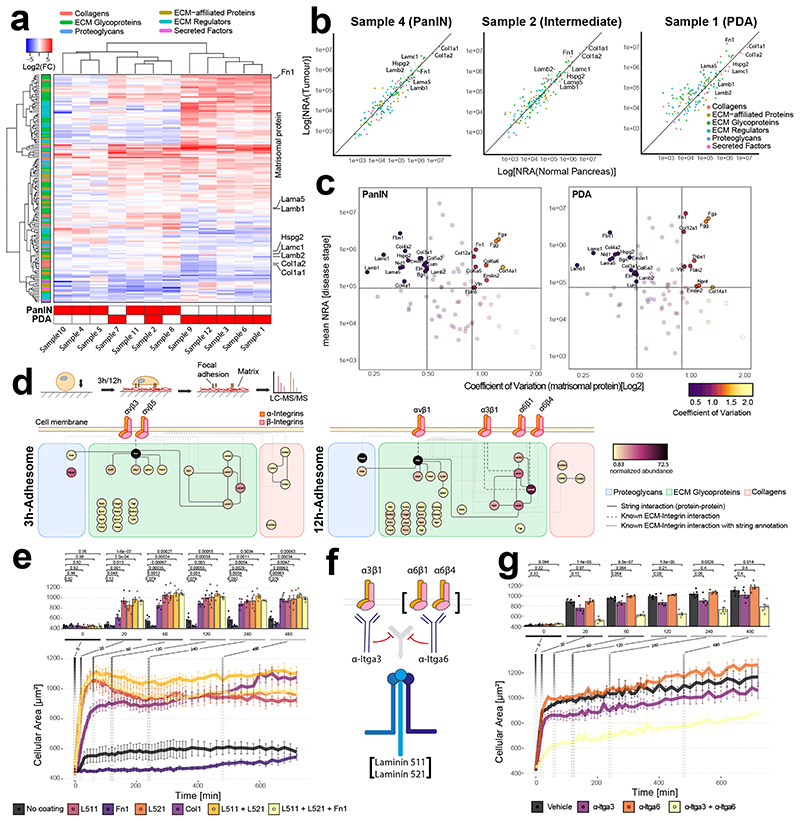
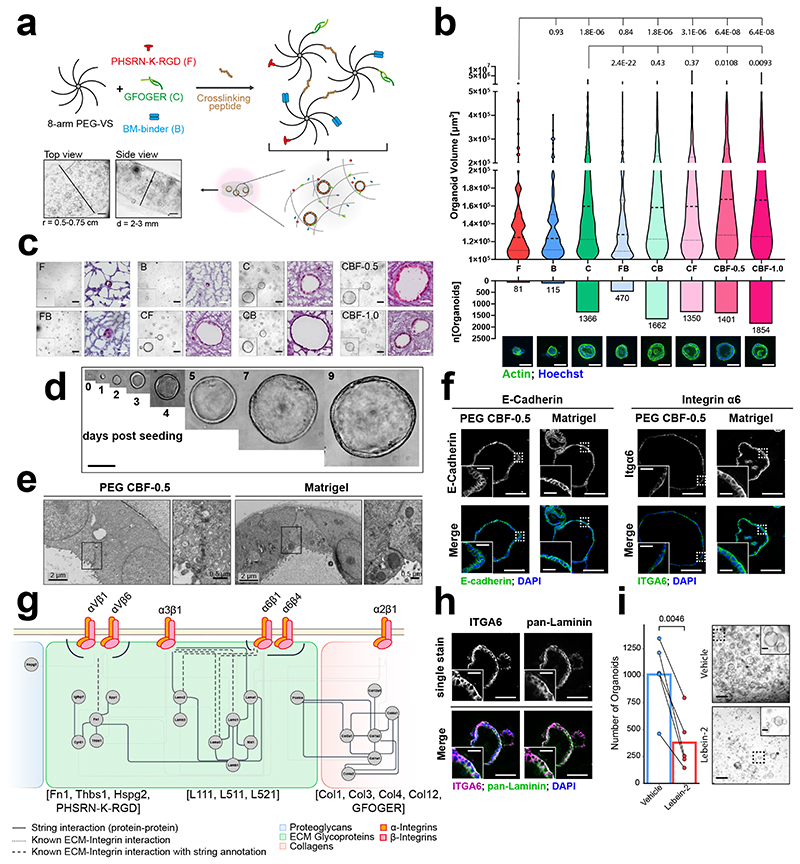
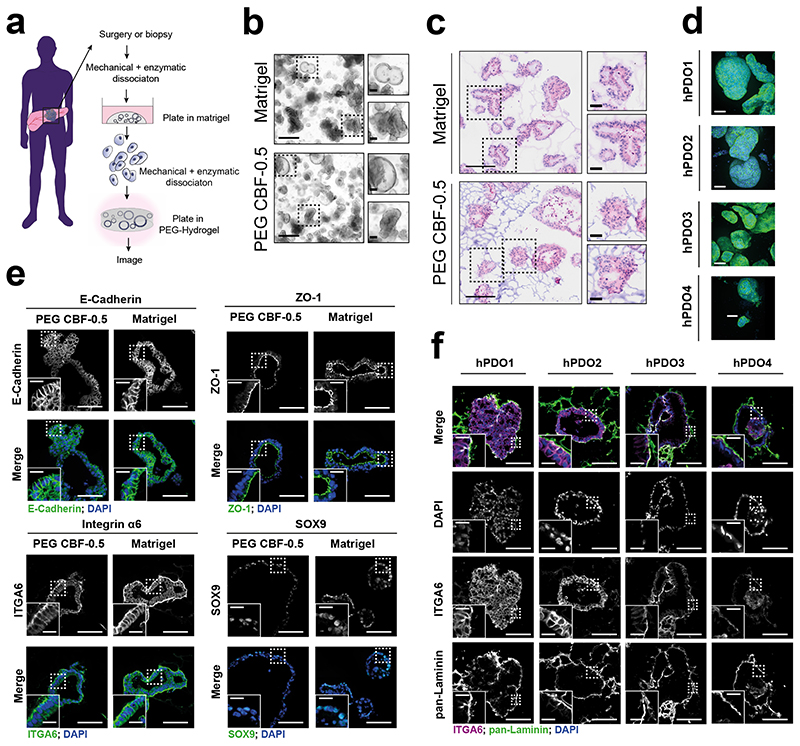
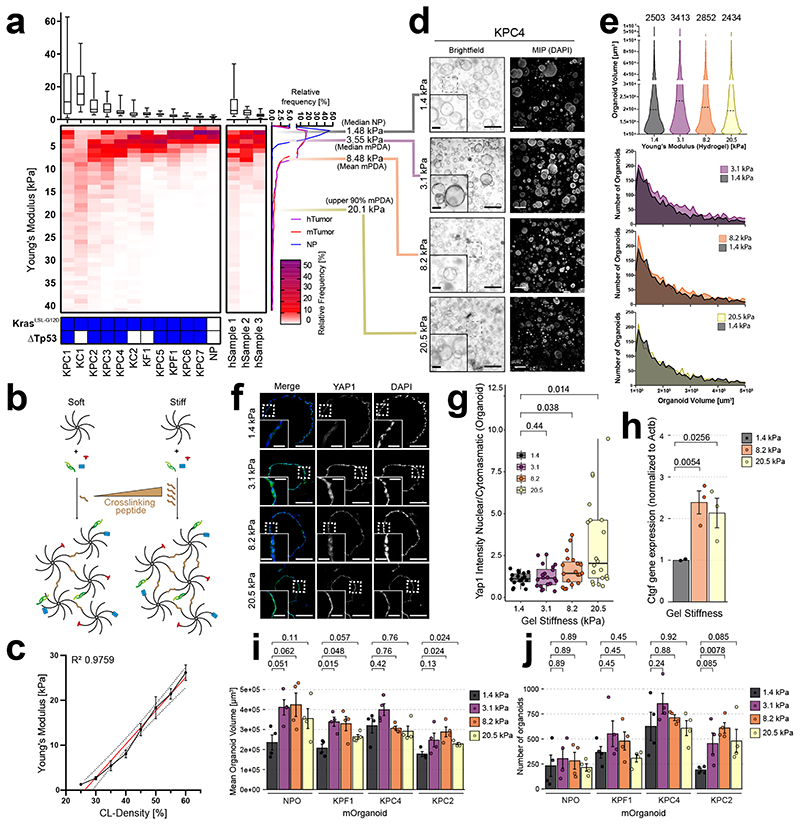
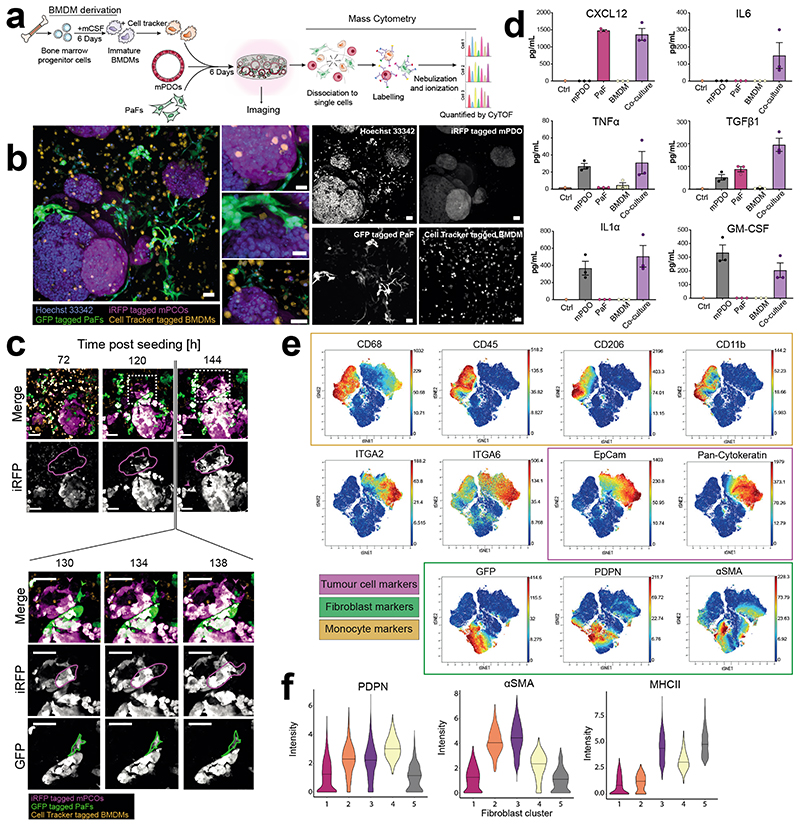
Experimental in vitro models that capture pathophysiological characteristics of human tumours are essential for basic and translational cancer biology. Here, we describe a fully synthetic hydrogel extracellular matrix designed to elicit key phenotypic traits of the pancreatic environment in culture. To enable the growth of normal and cancerous pancreatic organoids from genetically engineered murine models and human patients, essential adhesive cues were empirically defined and replicated in the hydrogel scaffold, revealing a functional role of laminin-integrin α36 signalling in establishment and survival of pancreatic organoids. Altered tissue stiffness-a hallmark of pancreatic cancer-was recapitulated in culture by adjusting the hydrogel properties to engage mechano-sensing pathways and alter organoid growth. Pancreatic stromal cells were readily incorporated into the hydrogels and replicated phenotypic traits characteristic of the tumour environment in vivo. This model therefore recapitulates a pathologically remodelled tumour microenvironment for studies of normal and pancreatic cancer cells in vitro.


Conflict of interest statement

Competing interests:

LGG has patent application pending related to the hydrogel system. The rest of the authors have no competing interests to disclose.

Figures

Figure 1
Figure 1. Defining adhesive requirements of pancreatic cancer cells.
a, Hierarchical clustering of matrisomal protein relative abundances (compared to normal pancreas). Histological grade (bottom) and selected matrisomal proteins (right side) are shown. b, Normalised relative abundance (NRA) of matrisomal proteins from 3 representative samples (PanIN: Pancreatic Intraepithelial Neoplasia; Intermediate: mixed sample containing PanIN and PDA; PDA: Pancreatic ductal adenocarcinoma). c, Scatter plot displaying the variance of core matrisome proteins over mean NRA in PanIN (top) or PDA (bottom). Vertical lines represent the 25% quantile and 75% quantile coefficient of variation. Horizontal line indicates median abundance. d, Outline of integrin adhesion complex (IAC) isolation (top) and identified proteins (bottom). Interactions of selected proteins identified in IACs isolated from KPC-1s after 3h (left) or 12h (right) are shown. Proteins are colour-coded according to their relative abundance. e, Time-course of GFP-labelled human Suit-2 PCCs spreading on indicated ECM proteins. f, Schematic outline of blocking antibodies targeting integrins α6β1, α6β4 or α3β1. g, Effect of blocking antibodies on GFP-labelled Suit-2 cells spreading on L511- and L521-coated dishes. e,g, Bar graphs show mean values (n=5), with each data point representing the median cellular area of >100 measured cells for indicated timepoints. Two-sided parametric Welch’s t-test with Benjamini-Hochberg correction; error bars: s.e.m
Figure 2
Figure 2. Optimising PEG hydrogel composition for pancreatic organoids.
a, Illustration of 3D PEG hydrogel scaffold crafting and organoid encapsulation. b, Image analysis of murine pancreatic cancer organoids (mPCOs) grown in 3D PEG hydrogels prepared with different adhesion-mimetic peptides as indicated. Violin plots display the volume distribution of individual organoids (top) (d4, n=3, two-tailed Wilcoxon test with Benjamini-Hochberg correction). Dashed bold line indicates median organoid volume. Total organoid number and representative images of analysed mPCOs are shown (bottom). Scale bar = 50 μm. c, Representative brightfield and H&E images of mPCOs in 3D PEG hydrogels using adhesion-mimetic peptides as indicated (d4, n=3). Scale bars: Brightfield: 200 μm; H&E: 50 μm. d, Representative brightfield images of mPCOs developing in 3D PEG CBF-0.5 hydrogels (n=3). Scale bar: 100 μm. e, Representative electron microscopy (EM) images of mPCOs grown as indicated (d4). Scale bars: 2 μm, Inlay: 500 nm. Images are representative of minimum five organoids in each gel. f, Immunofluorescence (IF) images of mPCOs in PEG CBF-0.5 hydrogels or Matrigel. Scale bar: 100 μm, Inlay: 25 μm. Images are representative of minimum 5 organoids in the respective gel (d4, n=2). g, Protein-Protein interaction network of identified integrin-ECM interactions of mPCOs in 3D PEG CBF-0.5 hydrogels highlighting main ECM ligands of identified integrins. h, Dual-IF of pan-Laminin and ITGA6 in mPCOs in 3D PEG CBF-0.5 hydrogels. Images are representative of minimum five organoids (d4, n=2). Scale bar: 100 μm, Inlay: 25 μm. i, Quantification (left) and representative brightfield images (right) of mPCOs in 3D PEG CBF-0.5 hydrogels with vehicle or lebein-2 (d4, n=5, paired parametric two-sided Welch’s t-test). Individual replicates are linked. Scale bar: 500 μm, Inlay: 100 μm. Abbreviations: F – PHSRN-K-RGD, B – BM-binder, C – GFOGER, FB; CB; CF – combinations of indicated peptides, CBF-0.5; CBF-1.0 – combination of indicated peptides with PHSRN-K-RGD at 0.5 or 1 mM.
Figure 3
Figure 3. Human PDO formation in defined PEG matrices.
a, Schematic of human pancreatic ductal organoid (hPDO) establishment. b, Representative brightfield images of hPDOs in 3D PEG CBF-0.5 hydrogels or Matrigel (d6). Images are representative of at least 3 independent experiments. Scale bar: 500 μm, Inlay: 100 μm. c, H&E staining of organoids from b. Scale bar: 200 μm, Inlay: 50 μm. d, Maximum intensity projection of hPDOs from four patients stained with Phalloidin and Hoechst to visualize organoid morphology and cellular structures. Images show representative morphology of organoids from each line. Scale bar: 200 μm. e, IF analysis of indicated markers in hPDO2 organoids grown in PEG CBF-0.5 hydrogels or Matrigel (d6, n=2). Scale bar: 100 μm, Inlay: 25 μm. Images are representative of minimum five organoids. f, Dual IF for pan-Laminin and ITGA6 in hPDOs grown in PEG CBF-0.5 hydrogels (d6, n=2). Images are representative of minimum five organoids. e,f, Scale bar: 100 μm, inlay: 25 μm.
Figure 4
Figure 4. Recapitulating the stiffness range of PDA in PEG hydrogels.
a, Boxplot (top) and heatmap (bottom) displaying stiffness frequency (Young’s modulus) for murine (left, n=11 tumour, n=3 NP) and human (center, n=3) samples. Boxplots represent individual measurements (>800/sample). Bold line represents median, with boxes representing 25th to 75th percentile and whiskers indicate 90% confidence interval. Genotype of murine samples is shown (below). Cumulated relative stiffness frequency (right). Median stiffness for normal (grey) as well as median (purple), mean (orange) and upper 90% border (yellow) of murine cancerous samples. b, Illustration of how crosslinking density after PEG functionalisation control stiffness. c, AFM measurements of PEG CBF-0.5 hydrogels (n=3, error bars, s.e.m). Linear regression (red) and 95% c.i. shown (dashed line). d, Representative brightfield images (left) and maximum intensity projections of DAPI (right) from mPCOs grown at indicated stiffnesses (d4, n=4). Scale bar: 500 μm, inlay: 100 μm (left); 200 μm (right). e, Violin plot of organoid volume (top) and frequency plots of numbers (bottom) from d. Dashed bold lines show median organoid volume. Number of analysed organoids shown above the plot. f, IF of yes-associated protein 1 (YAP1) and DAPI in mPCOs grown at indicated stiffness. IF images are representative of minimum five organoids (n=2). Scale bars: 100 μm, Inlay: 25 μm. g, Nuclear/cytoplasmatic ratio of YAP1 in individual organoids from f. Mean shown as bold line. Two-sided parametric Welch’s t-test used for 1.4, 3.1 or 8.2 kPa and two-sided non-parametric Wilcoxon test for 20.5 kPa with Benjamini-Hochberg correction. Boxes show 25th and 75th percentiles with 50th percentile depicted and whiskers with 1.5 · IQR from hinges. h, Normalised Ctgf expression in mPCOs grown at indicated stiffness (n=3, parametric Welch’s t-test, error bars: s.e.m.). i, j, Mean organoid volume i, and numbers j, of mPCOs grown at indicated stiffness (n=4, two-sided parametric Welch’s t-test with Benjamini-Hochberg correction, error bars: s.e.m.).
Figure 5
Figure 5. 3D PEG-VS CBF-0.5 gels support stromal co-cultures.
a, Overview of co-culture in PEG-VS CBF-0.5 hydrogels. b, Representative image of co-cultures (d6). Scale bars: 70 μm, images representative of three independent experiments. c, Representative images of co-cultures in 3D PEG-VS CBF-0.5 hydrogels at indicated time after seeding (top) and representative examples of fibroblasts and cancer cells (bottom). Images are representative of at least five individual regions centred around mPCOs. Scale bar: 60 μm. d) ELISA of conditioned medium from mono- and co-cultures grown in PEG-hydrogels for six days (n=3). Error bars: Standard error of mean. e) t-SNE visualisation of mass cytometry analysis of PEG-CBF-0.5 gel co-cultures overlaid with relative quantification of selected markers (d6, n=2). Integrin markers were not used in definition of t-SNE plots. Range of colorimetric scale is indicated for individual markers. f) Violin plots of selected markers for all detected fibroblast clusters. Bold line indicates median intensity of each marker and population.

Comment in

References

    1. Egeblad M, Nakasone ES, Werb Z. Tumors as Organs: Complex Tissues that Interface with the Entire Organism. Dev Cell. 2010;18:884–901. - PMC - PubMed
    1. Feig C, et al. The pancreas cancer microenvironment. Clin Cancer Res. 2012;18:4266–4276. - PMC - PubMed
    1. Sahai E, et al. A framework for advancing our understanding of cancer-associated fibroblasts. Nat Rev Cancer. 2020;6:1–13. - PMC - PubMed
    1. DeNardo DG, Ruffell B. Macrophages as regulators of tumour immunity and immunotherapy. Nature Reviews Immunology. 2019;7:1–14. - PMC - PubMed
    1. Biankin AV, et al. Pancreatic cancer genomes reveal aberrations in axon guidance pathway genes. Nature. 2012;491:399–405. - PMC - PubMed

Publication types

LinkOut - more resources