. 2022 Jan 17;23(1):bbab382.
doi: 10.1093/bib/bbab382.

The substitution spectra of coronavirus genomes

Affiliations

The substitution spectra of coronavirus genomes

Diego Forni et al. Brief Bioinform. .

Abstract

The severe acute respiratory syndrome coronavirus 2 (SARS-CoV-2) pandemic has triggered an unprecedented international effort to sequence complete viral genomes. We leveraged this wealth of information to characterize the substitution spectrum of SARS-CoV-2 and to compare it with those of other human and animal coronaviruses. We show that, once nucleotide composition is taken into account, human and most animal coronaviruses display a mutation spectrum dominated by C to U and G to U substitutions, a feature that is not shared by other positive-sense RNA viruses. However, the proportions of C to U and G to U substitutions tend to decrease as divergence increases, suggesting that, whatever their origin, a proportion of these changes is subsequently eliminated by purifying selection. Analysis of the sequence context of C to U substitutions showed little evidence of apolipoprotein B mRNA editing catalytic polypeptide-like (APOBEC)-mediated editing and such contexts were similar for SARS-CoV-2 and Middle East respiratory syndrome coronavirus sampled from different hosts, despite different repertoires of APOBEC3 proteins in distinct species. Conversely, we found evidence that C to U and G to U changes affect CpG dinucleotides at a frequency higher than expected. Whereas this suggests ongoing selective reduction of CpGs, this effect alone cannot account for the substitution spectra. Finally, we show that, during the first months of SARS-CoV-2 pandemic spread, the frequency of both G to U and C to U substitutions increased. Our data suggest that the substitution spectrum of SARS-CoV-2 is determined by an interplay of factors, including intrinsic biases of the replication process, avoidance of CpG dinucleotides and other constraints exerted by the new host.

Keywords: RNA viruses; SARS-CoV-2; coronavirus; substitutions; transitions; transversions.


Figures

Figure 1
Figure 1
Transition and transversion frequencies in coronaviruses and other positive-sense RNA viruses. Transition and transversion frequencies are reported after normalization by base frequency and by overall number of mutations. Data for SARS-CoV-2 are plotted as mean and standard deviation of 100 sets of 1000 genomes each. For all other viruses, the sequences analyzed were as follows: mink SARS-CoV-2 = 880, SARS-CoV = 48, human MERS-CoV = 314, camel MERS-CoV = 342, South Koean MERS-CoV = 34, HCoV-OC43 = 167, HCoV-NL63 = 68, BCoV = 84, PDCoV = 124, PEDV = 471, FCoV = 52, IBV = 404, HRV-A = 198, E71 = 994, RUBV = 82, ZIKV = 659, SINV = 76, CHIKV = 157 and YFV = 35.
Figure 2
Figure 2
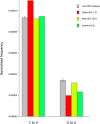
C to U and G to U substitutions frequencies for VOCs and non-VOC lineages. Substitution frequencies are reported after normalization by base frequency and by overall number of mutations. Data for non-VOC genomes are plotted as mean and standard deviation of 100 sets of 1000 genomes each.
Figure 3
Figure 3
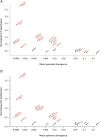
Correlation between substitutions and sequences divergence. C to U and G to U substitution frequencies are plotted against the mean pairwise divergence for coronaviruses (red dots) and a set of positive strand RNA viruses (black dots). C to U and G to U frequencies are calculated as described in Figure 1 and then divided by the sum of the other transition and transversion substitutions, respectively.
Figure 4
Figure 4
Sequence context of C to U and G to U substitutions in coronaviruses and other positive-sense RNA viruses. The frequency of nucleotides flanking (−1 and +1 positions) C to U and G to U changes are reported after normalization by dinucleotide genome composition. Data for SARS-CoV-2 are plotted as mean and standard deviation of 100 sets of 1000 genomes each.
Figure 5
Figure 5
Sequence context of synonymous substitutions in SARS-CoV-2. (A) For C to U synonymous changes, bars represent the frequency of substitutions that occur at NNC codons when the next codon is GNN or HNN (where H is A or C or U). (B) For G to U synonymous changes, bars indicate the frequency of substitutions that change an NCG codon and those that change an NDG codon (where D is G or A or U). All data are plotted as mean and standard deviation of 100 sets of 1000 genomes each.
Figure 6
Figure 6
Change of the substitution spectrum over time. Frequency of C to U and G to U mutations that have appeared per month (see Materials and Methods). Frequencies are normalized by the frequency of the changing nucleotide and by the overall number of changes occurring each month. From March 2020 onward, data are plotted as mean and standard deviation of 10 sets of 500 genomes each. For January and February 2020, data represent frequencies calculated over 497 and 500 sequences, respectively.

References

    1. Blanco-Melo D, Nilsson-Payant BE, Liu WC, et al. . Imbalanced host response to SARS-CoV-2 drives development of COVID-19. Cell 2020;181:1036–1045.e9. - PMC - PubMed
    1. Hayn M, Hirschenberger M, Koepke L, et al. . Systematic functional analysis of SARS-CoV-2 proteins uncovers viral innate immune antagonists and remaining vulnerabilities. Cell Rep 2021;35:109126. - PMC - PubMed
    1. Lowery SA, Sariol A, Perlman S. Innate immune and inflammatory responses to SARS-CoV-2: implications for COVID-19. Cell Host Microbe 2021;29:1052–62. - PMC - PubMed
    1. Mahmud SMH, Al-Mustanjid M, Akter F, et al. . Bioinformatics and system biology approach to identify the influences of SARS-CoV-2 infections to idiopathic pulmonary fibrosis and chronic obstructive pulmonary disease patients. Brief Bioinform 2021. 10.1093/bib/bbab115. - DOI - PMC - PubMed
    1. Sa Ribero M, Jouvenet N, Dreux M, et al. . Interplay between SARS-CoV-2 and the type I interferon response. PLoS Pathog 2020;16:e1008737. - PMC - PubMed

Publication types