Review
. 2021 Dec;24 Suppl 2(Suppl 2):16-25.
doi: 10.1111/ocr.12520. Epub 2021 Sep 14.

Complexity and data mining in dental research: A network medicine perspective on interceptive orthodontics

Affiliations
Review

Complexity and data mining in dental research: A network medicine perspective on interceptive orthodontics

Tommaso Gili et al. Orthod Craniofac Res. 2021 Dec.

Abstract

Procedures and models of computerized data analysis are becoming researchers' and practitioners' thinking partners by transforming the reasoning underlying biomedicine. Complexity theory, Network analysis and Artificial Intelligence are already approaching this discipline, intending to provide support for patient's diagnosis, prognosis and treatments. At the same time, due to the sparsity, noisiness and time-dependency of medical data, such procedures are raising many unprecedented problems related to the mismatch between the human mind's reasoning and the outputs of computational models. Thanks to these computational, non-anthropocentric models, a patient's clinical situation can be elucidated in the orthodontic discipline, and the growth outcome can be approximated. However, to have confidence in these procedures, orthodontists should be warned of the related benefits and risks. Here we want to present how these innovative approaches can derive better patients' characterization, also offering a different point of view about patient's classification, prognosis and treatment.

Keywords: artificial intelligence; big data; complexity; machine learning; musculoskeletal magnetic resonance imaging; network medicine; orthodontics.


Conflict of interest statement

The authors have no conflict of interests to declare.

Figures

FIGURE 1
FIGURE 1
Schematic depiction of bone and tooth multiscale hierarchical structure from macroscopic bone (up raw) and tooth (bottom raw) to their nanoscopic elements. This hierarchical organization is the genesis of bone and dentine properties, including stress tolerance, adaptability and development during the growth process. In dentine, tubules are the prominent structural feature at a micro‐level, whereas collagen fibres decorated with apatite crystallite platelets dominate the nanoscale. In bone, hydroxyapatite (HA) crystals at nanometer‐level periodically are deposited within the gap zones of collagen fibrils during the bone biomineralization process. This hierarchical arrangement produces nanomechanical heterogeneities, which enable a mechanism for high energy dissipation and resistance to fracture. At a micro‐macro‐level, bone marrow quality in spongy bone and trabecular network rearrangement affects the resistance of bone to mechanical stress. Adapted from reference, , , ,
FIGURE 2
FIGURE 2
Schematic representation of muscle multiscale hierarchical structure. Most of the physiological muscle functions are related to its hierarchical organization and components. Physical inactivity causes a decrease in muscle mass and an increase in fat mass, but a chronic high fat diet also increases muscle fat, limiting full muscle function. Muscles quality is often related to skeletal tissue quality. Parameters that quantify the craniofacial muscles quality of an orthodontic patient should constitute the data set to be collected for planning treatment. Adapted from references,
FIGURE 3
FIGURE 3
Artificial neural network schematization. An artificial neural network is based on a set of connected nodes, where connections, like synapses in a biological brain, can transmit a signal from a node to another. The transmitted signal is a real number, and the output of each node is computed by some non‐linear function of the sum of its inputs. Connections (also called edges or links) typically have a weight that adjusts as learning proceeds. Nodes are aggregated into layers, and different layers may perform various transformations on their inputs. Signals travel from the first layer to the last one (the output layer), often after going through the mid‐layers (hidden layers) multiple times. According to the number of layers included in the neural network, different machines can be realized, from simple machine‐learning engines to deep learning ones
FIGURE 4
FIGURE 4
Machine learning. Different approaches to the learning process produce different machine‐learning schemes. According to the number of features used to train the machine, one can obtain supervised learning (labelled data sets are used to train the machine), unsupervised learning (unlabelled data sets are used to train the machine), semi‐supervised learning (a mix of labelled and unlabelled data sets are used to train the machine) and reinforcement learning (there are not data sets to train the machine). According to the quality of the target data (continuous or categorical), different tasks can be performed by the learning processes
FIGURE 5
FIGURE 5
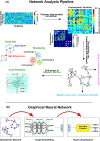
Complex Networks and data analytics. (A) Network analysis pipeline for orthodontics data. Once cephalometric variables are standardized to Z‐values, they are entered in a cross‐correlation process that returns a symmetric matrix, whose entries are the intervariable Pearson's correlation coefficients across subjects. A threshold is set to the matrix according to the P‐values associated with the coefficients. The final matrix (a weighted adjacency matrix) is translated into a network whose nodes are the cephalometric variables and the weights of the links the Pearson's correlation coefficients that survived the thresholding process. Finally, different metrics have been calculated from the network topology: centrality measures, modules or communities and the core‐periphery structure. (B) GNN. Low‐dimensional node representations are first learned from networks by graph embedding and then used as features to build specific classifiers for different tasks

References

    1. Andersen PW. More is different. Science. 1972;177(4047):393‐396. 10.1126/science.177.4047.393 - DOI - PubMed
    1. Polimeni A. Pediatric Dentistry (2nd Ed). Edra (Ed); 2020.
    1. Yan G, Tsekenis G, Barzel B, Slotine JJ, Liu YY, Barabási AL. Spectrum of controlling and observing complex networks. Nat Phys. 2015;11:779‐786. 10.1038/nphys3422 - DOI
    1. Scale‐Free CG. Networks: Complex Webs in Nature and Technology. Oxford University Press; 2007. 10.1093/acprof:oso/9780199211517.001.0001 - DOI
    1. Barabási AL, Gulbahce N, Loscalzo J. Network medicine: A network‐based approach to human disease. Nat Rev Genet. 2011;12(1):56‐68. 10.1038/nrg2918 - DOI - PMC - PubMed