. 2022 Feb 21;31(4):587-603.
doi: 10.1093/hmg/ddab269.

Mitochondrial enzyme GPT2 regulates metabolic mechanisms required for neuron growth and motor function in vivo

Affiliations

Mitochondrial enzyme GPT2 regulates metabolic mechanisms required for neuron growth and motor function in vivo

Ozan Baytas et al. Hum Mol Genet. .

Abstract

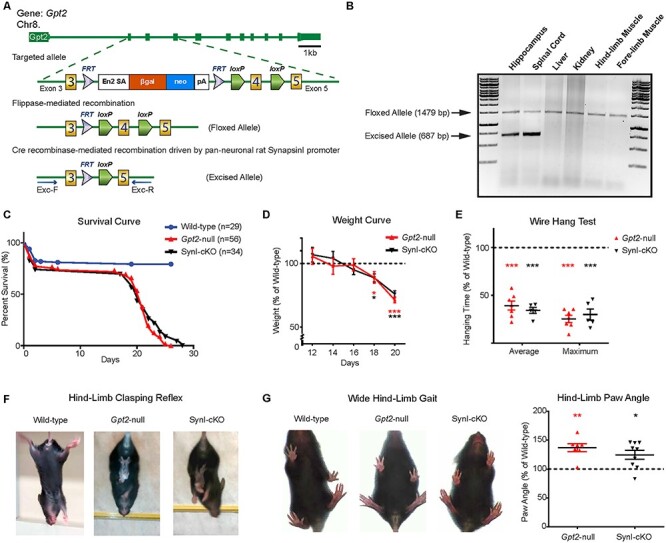
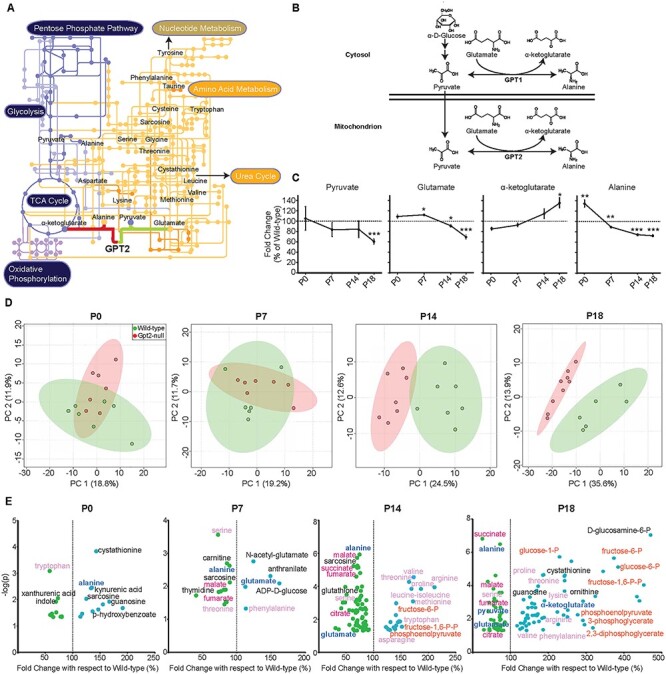
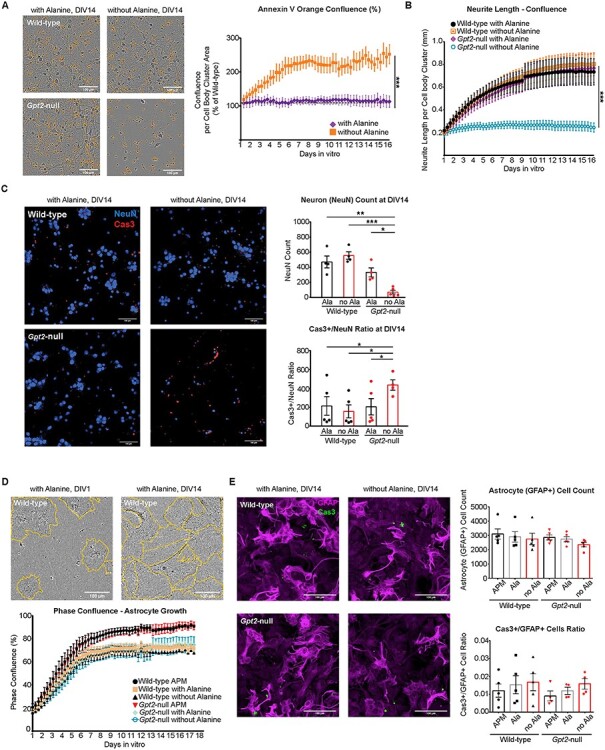
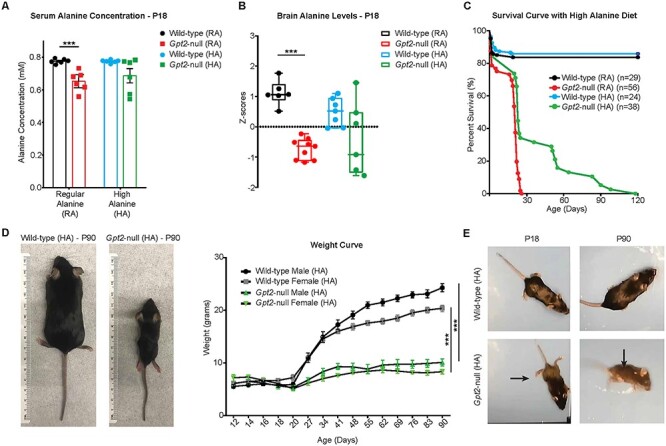
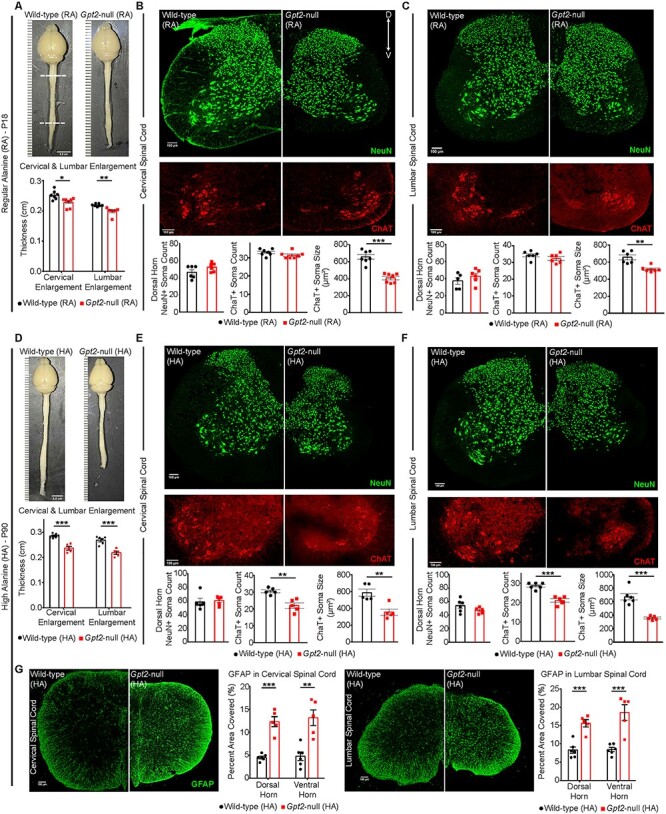
The metabolic needs for postnatal growth of the human nervous system are vast. Recessive loss-of-function mutations in the mitochondrial enzyme glutamate pyruvate transaminase 2 (GPT2) in humans cause postnatal undergrowth of brain, and cognitive and motor disability. We demonstrate that GPT2 governs critical metabolic mechanisms in neurons required for neuronal growth and survival. These metabolic processes include neuronal alanine synthesis and anaplerosis, the replenishment of tricarboxylic acid (TCA) cycle intermediates. We performed metabolomics across postnatal development in Gpt2-null mouse brain to identify the trajectory of dysregulated metabolic pathways: alterations in alanine occur earliest; followed by reduced TCA cycle intermediates and reduced pyruvate; followed by elevations in glycolytic intermediates and amino acids. Neuron-specific deletion of GPT2 in mice is sufficient to cause motor abnormalities and death pre-weaning, a phenotype identical to the germline Gpt2-null mouse. Alanine biosynthesis is profoundly impeded in Gpt2-null neurons. Exogenous alanine is necessary for Gpt2-null neuronal survival in vitro but is not needed for Gpt2-null astrocytes. Dietary alanine supplementation in Gpt2-null mice enhances animal survival and improves the metabolic profile of Gpt2-null brain but does not alone appear to correct motor function. In surviving Gpt2-null animals, we observe smaller upper and lower motor neurons in vivo. We also observe selective death of lower motor neurons in vivo with worsening motor behavior with age. In conclusion, these studies of the pathophysiology of GPT2 Deficiency have identified metabolic mechanisms that are required for neuronal growth and that potentially underlie selective neuronal vulnerabilities in motor neurons.


Figures

Figure 1
Figure 1
GPT2 activity is required in neurons in vivo for motor function and animal survival. (A) Schematic depicting disruption of the Gpt2 gene at the mouse genomic locus, leading to the germline-null and conditional alleles. The targeted allele consists of flippase recognition sites (FRT) flanking a cassette containing a strong splicing acceptor site (Engrailed 2-SA), β-galactosidase gene, neomycin resistance gene and polyadenylation site between exon 3 and exon 4. After flippase-mediated recombination, the floxed Gpt2-allele is converted to a conditional construct with two loxP sites flanking exon 4 (the floxed allele). Prior to Cre recombinase-mediated excision by a tissue-specific promoter, the floxed allele produces a normal GPT2 protein. The excised allele is detected with primers Exc-F & Exc-R (see Materials and Methods). (B) Validation of the conditional allele in vivo. Cre recombinase driven by the rat Synapsin-I promoter excises exon 4 only in neuronal cells. In PCR genotyping, the floxed allele appears at 1479 bp and the excised allele at 687 bp. The excision of exon 4 is absent in non-neuronal tissues such as liver, kidney and muscle. (C) Similar timelines of postnatal death in germline Gpt2-null and Synapsin-I-Cre conditional mutant (SynI-cKO) animals. Survival curves of wild-type (blue), germline Gpt2-null (red) and SynI-cKO (black) mice. Wild-type n = 29 mice, Gpt2-null n = 56, SynI-cKO n = 34. Log-rank (Mantel-Cox) test was used to determine differences between the curves. P < 0.0001 (wild-type versus Gpt2-null), P < 0.0001 (wild-type versus SynI-cKO), P = 0.5777 (Gpt2-null versus SynI-cKO). (D) Reduction in weight gain in germline Gpt2-null and SynI-cKO animals compared to wild-type. Weight curves of Gpt2-null (red) and SynI-cKO (black) animals expressed as a percentage of their wild-type littermates (n = 7–11). *0.01 < P < 0.05, **0.001 < P < 0.01, ***P < 0.001. (E) Reduced performance on wire hang test by Gpt2-null (red) and SynI-cKO (black) animals. Average and maximum hanging times are expressed as a percentage of their wild-type littermates. ***P < 0.001. (F) Gpt2-null and SynI-cKO mice demonstrate hind-limb clasping reflex. When suspended by the tail, the wild-type mice extend their hind-limbs but the Gpt2-null and SynI-cKO mice bend their hind-limbs toward the body midline and clasp their hind paws. (G) Gpt2-null and SynI-cKO mice stand in a wide stance with hind paws spread further apart. Representative images of wide hind-limb gait in Gpt2-null and SynI-cKO mice and quantification of the absolute paw angle with respect to the midline, expressed as a percentage of their wild-type littermates; Gpt2-null: 136.9 ± 6.8% P = 0.0017, SynI-cKO: 124.7 ± 7.5% P = 0.011. Data were collected and analyzed with DigiGait software.
Figure 2
Figure 2
Metabolomics in Gpt2-null hippocampus across postnatal development reveals the trajectories of defective metabolic pathways. (A) GPT2 and the relevant metabolic pathways. The metabolic pathway map was modified from KEGG (Kyoto Encyclopedia of Genes and Genomes) (https://www.kegg.jp/) (48). GPT2 links amino acid metabolism (orange pathways and nodes) to the TCA cycle metabolism and glycolysis (dark purple pathways and nodes). The metabolic network illustrates the interconnection of pathways that GPT2 has an immediate influence on as well as more remote connections such as, nucleotide metabolism, pentose phosphate pathway and the urea cycle. (B) In the mitochondrion, the primary reaction of GPT2 involves a reversible transfer of an amino group from glutamate to pyruvate yielding alanine and α-ketoglutarate. The cytosolic paralog, GPT1, catalyzes the same transaminase reaction. (C) Fold changes of the metabolites in the GPT2 reaction in Gpt2-null hippocampus across postnatal development. The peak intensities obtained from targeted tandem liquid chromatography–mass spectrometry (LC–MS/MS) were normalized to the sample median. At each time point, Gpt2-null (P0: n = 7, P7: n = 6, P14: n = 7, P18: n = 9) was compared to the average of the wild-type (P0: n = 7, P7: n = 7, P14: n = 7, P18: n = 6). One sample t-test was run for each metabolite (*0.01 < P < 0.05, **0.001 < P < 0.01, ***P < 0.001). (D) 2-D Score Plots of PCA in the Gpt2-null hippocampus. The peak intensities obtained from LC–MS/MS were normalized to the sample median and auto-scaled (mean-centered and divided by the standard deviation of each group). Analyses were performed in MetaboAnalyst 4.0 (https://www.metaboanalyst.ca). (E) Volcano plots of significantly changed metabolites in Gpt2-null hippocampus across postnatal development. The fold changes are expressed as a percentage of the wild-type average. Note the greater −log(P) value on the y-axis, the stronger the raw P-value is. The dashed line is positioned at 100% of wild-type, so that any metabolite (green dots) left of the line had a reduced level and any metabolite (blue dots) right of the line had an increased level in Gpt2-null hippocampus. Dark blue metabolites are the GPT2 primary reaction metabolites (alanine, α-ketoglutarate, pyruvate, glutamate), magenta metabolites are TCA cycle intermediates, pale pink metabolites are proteinogenic amino acids and orange metabolites are glycolysis intermediates. The entire metabolomics data sets along with false discovery rates for each metabolite can be found in Supplementary Material, Tables S1–S4.
Figure 3
Figure 3
GPT2 is enriched in neurons and sustains alanine biosynthesis and the TCA cycle in neurons in vitro. (A) Western blotting of GPT2 and GPT1 in subcellular fractions of the mouse brain at P18. GPT2 (58 kDa) was present only in the total homogenate and mitochondrial fractions. GPT1 (55 kDa) was present in the homogenate and other intermediate fractions containing cytosol but not in the mitochondrial fraction. MTCO1: Mitochondrially encoded cytochrome c oxidase subunit 1. (B) GPT enzyme activity assay in the cytosolic and mitochondrial fractions extracted from wild-type and Gpt2-null mouse brain. Wild-type cytosol: 8.15 ± 0.68 mU/mg; Gpt2-null cytosol: 6.57 ± 0.77 mU/mg; wild-type mitochondria: 6.53 ± 1.21 mU/mg; Gpt2-null: 0.95 ± 0.58 mU/mg. **P = 0.0038. (C) GPT2 is enriched in neuronal cultures as compared to GPT1, which is more abundant in astrocytes. Representative images of western blotting of GPT2 and GPT1 in wild-type and Gpt2-null cortical neuronal and astrocyte-enriched cultures. Quantification of the ratio of GPT2 to GPT1 band intensity (right). ***P = 0.009. (D) GPT enzyme activity assay in Gpt2-null cortical neuronal and astrocyte-enriched cultures expressed as percentage of their wild-type littermate cultures. ***P = 0.0006. (E) Primary cortical neurons (top) and astrocyte-enriched cultures (bottom) from wild-type mice demonstrate localization of GPT2 to mitochondria. Confocal microscopy images of GPT2 (green), MitoTracker Red CMXRos (magenta) and MAP2 or GFAP (blue). Scale bar: 10 μm. Regions boxed in white in the images on the left (GPT2) were magnified and are depicted in images on the right to demonstrate co-localization of GPT2 and MitoTracker Red. (F) Metabolic pathways that convert [U-13C]-glucose and [α-15N]-glutamine into alanine. GLS: Glutaminase. The filled circles refer to heavy isotope 13-carbon atoms. The heavy nitrogen isotope is highlighted blue. Molecules with heavy isotopes are designated as ‘m + #’ and the number refers to the number of heavy isotope atoms. (G) GPT2 is required for alanine synthesis from glucose or glutamine in both primary neurons and astrocytes. Fractional enrichment in alanine from [α-15N]-glutamine (left) or [U-13C]-glucose (right) in wild-type and Gpt2-null cortical neuronal cultures (top) at DIV15 and astrocytes (bottom). The culture medium was replaced with Tyrode medium at DIV14 and samples were collected at DIV15. ***P < 0.0001. (H) Prominent decreases in alanine release from Gpt2-null neurons and astrocytes. Medium samples were collected at same time as the cell pellets in G. Neuronal culture: **P = 0.0057; astrocyte culture: **P = 0.0031. (I) Metabolic pathways that convert [U-13C]-glutamine into alanine and the TCA cycle intermediates. (J) GPT2 sustains TCA cycle intermediates in cortical neuronal cultures. Fractional enrichment in succinate or malate from [U-13C]-glutamine in cortical neuronal cultures as processed in G. Mixed model analysis was done to assess statistical significance with genotype as fixed factor and litters used for culture as random factor. *P = 0.0139 **P = 0.0044.
Figure 4
Figure 4
Exogenous alanine is required in Gpt2-null neurons for survival in vitro. (A) Gpt2-null culture deprived of alanine undergoes apoptosis. Representative images of Annexin V Orange Reagent staining in IncuCyte (left). Scale bar: 100 μm. The orange confluence per Cell Body Cluster Area values for Gpt2-null cultures were expressed as a percentage of their wild-type littermate cultures (right). The curves were fit by non-linear regression (one-phase exponential association) and best-fit values were compared (***P < 0.0001). n = 5 cultures. (B) Gpt2-null neurons fail to arborize without exogenous alanine. Graphs based on IncuCyte S3 NeuroTrack continuous analysis of neurite length as detected by phase confluence. The curves were fit by non-linear regression (one-phase exponential association) and best-fit values were compared (P < 0.0001). n = 5–7 cultures. (C) Neuronal cell count is decreased and Cas3+ cell count is increased in Gpt2-null cultures deprived of alanine. Images from Opera Phenix High Content Screening Confocal Microscopy (left) and quantification of NeuN+ cell counts (top) and Cas3+/NeuN+ ratio (bottom). Scale bar: 100 μm. The cells were fixed at DIV14 and the quantification represents the time point DIV14 only. *P < 0.05, **P < 0.005, ***P < 0.0005. (D) Gpt2-null astrocytes do not need exogenous alanine to survive in vitro. IncuCyte S3 phase contrast images from a wild-type astrocyte-enriched culture grown with alanine, at DIV1 (left) and DIV14 (right). Orange lines delineate the cell perimeter. Scale bar: 100 μm. Quantification of phase confluence over time (bottom). Refer to Materials and Methods for composition of Astrocyte Plating Medium (APM). Other media are similar to APM except they have dialyzed fetal bovine serum and 200 mm glutamine (instead of GlutaMAX) with or without 0.02 mm alanine. (E) Opera Phenix High Content Screening Confocal Microscopy (20× water objective) images of GFAP (magenta) and Caspase3 (Cas3, green) in wild-type and Gpt2-null astrocyte-enriched cultures and quantification of GFAP+ cell count (right, top), Cas3+/GFAP+ cell count ratio (right, bottom). Scale bar: 100 μm. GFAP+ cell count for no alanine condition, wild-type: 2750 ± 398.6 versus Gpt2-null: 2362 ± 161.4, P = 0.3936. Cas3+/GFAP+ cell count ratio for no alanine condition, wild-type: 0.0167 ± 0.0047 versus Gpt2-null: 0.0158 ± 0.003, P = 0.8855.
Figure 5
Figure 5
High-alanine diet improves survival and metabolomic profile in the hippocampus of Gpt2-null mice but does not alleviate body weight or motor deficits. (A) Serum alanine levels are normalized by the high-alanine (HA) diet in Gpt2-null mice at P18. Serum alanine concentrations of wild-type and Gpt2-null mice fed either RA or HA diet measured at P18. ***P (wild-type (RA) versus Gpt2-null (RA) < 0.0001); P (wild-type (HA) versus Gpt2-null (HA) = 0.07). (B) Alanine levels are normalized by the HA diet in Gpt2-null hippocampus. Z-scores of alanine levels are shown in the box-and-whisker plot. The peak intensities obtained from targeted tandem liquid chromatography–mass spectrometry (LC–MS/MS) were normalized to the sample median as in Figure 2. ***P < 0.001. (C) Gpt2-null mice on HA diet can survive up to P120. Survival curves of germline Gpt2-null mice and their wild-type littermates given RA diet (1.19% w/w) or HA diet (5% w/w). Log-rank (Mantel-Cox) test was used to determine significant differences between the curves, P (Gpt2-null (RA) versus Gpt2-null (HA)) < 0.0001, P (wild-type (HA) versus Gpt2-null (HA)) < 0.0001. (D) Gpt2-null mice that survive on HA diet do not gain body weight in a manner similar to wild-type mice. Representative images of wild-type (left) and Gpt2-null (right) mice at P90 fed HA diet. Weight curves of wild-type and Gpt2-null mice fed HA diet at ages from P12 to P90. The curves were fit to the Gompertz equation; P (wild-type male (HA) versus Gpt2-null male (HA)) < 0.0001, P (wild-type female (HA) versus Gpt2-null female (HA)) < 0.0001. n = 5–13 mice. (E) Adult Gpt2-null mice that survive on HA diet display worsening motor dysfunction. Pictures of wild-type (HA) (top) and Gpt2-null (HA) (bottom) mice at ages P18 (left) and P90 (right). Note the wide hind-limb gait (horizontal arrow) in the Gpt2-null (HA) mouse at P18 and the crawling behavior at P90 (vertical arrow). Also see Supplementary Material, Videos S11–S18.
Figure 6
Figure 6
Surviving adult Gpt2-null mice fed high-alanine diet exhibit worsening hypoplasia in the central nervous system and selective death of lower motor neurons in the spinal cord. (A) Images of the gross anatomy of the central nervous system of P18 wild-type and Gpt2-null mice fed RA diet. Top and bottom dashed lines denote cervical and lumbar enlargement, respectively. Quantification of thickness is shown below the images. Scale bar: 0.5 cm. (B) Images of cervical spinal cord sections from wild-type (RA) and Gpt2-null (RA) mice at P18 stained for neurons (top, NeuN, green) and motor neurons (bottom, ChAT, red). Quantification of dorsal horn NeuN+ soma count, ChAT+ soma count and ChAT+ soma size is shown below the images. (C) Images of lumbar spinal cord sections from wild-type (RA) and Gpt2-null (RA) mice at P18 stained for neurons (top, NeuN, green) and motor neurons (bottom, ChAT, red). Quantification of dorsal horn NeuN+ soma count, ChAT+ soma count and ChAT+ soma size is shown below the images. (D) Images of the gross anatomy of the central nervous system of P90 wild-type and Gpt2-null mice fed HA diet. Cervical and lumbar enlargements were identified as in A. Quantification of thickness is shown below the images. Scale bar: 0.5 cm. (E) Images of cervical spinal cord sections from wild-type (HA) and Gpt2-null (HA) mice at P90 stained for neurons (top, NeuN, green) and motor neurons (bottom, ChAT, red). Quantification of dorsal horn NeuN+ soma count, ChAT+ soma count and ChAT+ soma size is shown below the images. (F) Images of lumbar spinal cord sections from wild-type (HA) and Gpt2-null (HA) mice at P90 stained for neurons (top, NeuN, green) and motor neurons (bottom, ChAT, red). Quantification of dorsal horn NeuN+ soma count, ChAT+ soma count and ChAT+ soma size is shown below the images. (G) Images of GFAP staining in cervical (left) and lumbar (right) spinal cord sections from wild-type (HA) and Gpt2-null (HA) mice at P90. Quantification is shown to the right of corresponding images and is represented as percent total area of the dorsal horn or ventral horn covered by GFAP staining. For B, C, E and F, dorsal horn NeuN+ soma were counted in a 100 × 100 μm2 window. ChAT staining belongs to the same section as NeuN but images of the ventral horn were cropped and magnified to better visualize motor neurons. Soma size was measured by the surface area of the cell in the maximum intensity projection image. Scale bar: 100 μm. For all figures: *0.01 < P < 0.05; **0.001 < P < 0.01; ***P < 0.001.

References

    1. Dekaban, A.S. (1978) Changes in brain weights during the span of human life: relation of brain weights to body heights and body weights. Ann. Neurol., 4, 345–356. - PubMed
    1. Holland, D., Chang, L., Ernst, T.M., Curran, M., Buchthal, S.D., Alicata, D., Skranes, J., Johansen, H., Hernandez, A., Yamakawa, R.et al. (2014) Structural growth trajectories and rates of change in the first 3 months of infant brain development. JAMA Neurol., 71, 1266–1274. - PMC - PubMed
    1. Iwasaki, N., Hamano, K., Okada, Y., Horigome, Y., Nakayama, J., Takeya, T., Takita, H. and Nose, T. (1997) Volumetric quantification of brain development using MRI. Neuroradiology, 39, 841–846. - PubMed
    1. van Dyck, L.I. and Morrow, E.M. (2017) Genetic control of postnatal human brain growth. Curr. Opin. Neurol., 30, 114–124. - PMC - PubMed
    1. Ashwell, K.W.S. (2009) Development of the spinal cord. The Spinal Cord, 8–16.