. 2021 Nov;41(6):1183-1197.
doi: 10.1111/opo.12881. Epub 2021 Sep 14.

Exploration of dynamic text presentations in bilateral central vision loss

Affiliations

Exploration of dynamic text presentations in bilateral central vision loss

Brittany Bowman et al. Ophthalmic Physiol Opt. 2021 Nov.

Abstract

Purpose: Dynamic text presentation methods may improve reading ability in patients with central vision loss (CVL) by eliminating the need for accurate eye movements. We compared rapid serial visual presentation (RSVP) and horizontal scrolling text presentation (scrolling) on reading rate and reading acuity in CVL observers and normally-sighted controls with simulated CVL (simCVL).

Methods: CVL observers' (n = 11) central scotomas and preferred retinal loci (PRL) for each eye were determined with MAIA microperimetry and fixation analysis. SimCVL controls (n = 16) used 4° inferior eccentric viewing, enforced with an Eyelink eye-tracker. Observers read aloud 4-word phrases randomly drawn from the MNREAD sentences. Six font sizes (0.50-1.30 logMAR) were tested with the better near acuity eye and both eyes of CVL observers. Three font sizes (0.50-1.00 logMAR) were tested binocularly in simCVL controls. Text presentation duration of each word for RSVP or drift speed for scrolling was varied to determine reading rate, defined as 50% of words read correctly. In a subset of CVL observers (n = 7), relationships between PRL eccentricity, reading threshold and rate were explored.

Results: SimCVL controls demonstrated significantly faster reading rates for RSVP than scrolling text (p < 0.0001), and there was a significant main effect of font size (p < 0.0001). CVL patients demonstrated no significant differences in binocular reading rate between font sizes (p = 0.12) and text presentation (p = 0.25). Similar results were seen under monocular conditions. Reading acuity for RSVP and scrolling worsened with increasing PRL eccentricity (μ = 4.5°, p = 0.07). RSVP reading rate decreased significantly with increasing eccentricity (p = 0.02).

Conclusions: Consistent with previous work, reading acuity worsened with increasing PRL eccentricity. RSVP and scrolling text presentations significantly affected reading rate in simCVL, but not in CVL observers, suggesting that simCVL results may not generalise to pathological CVL.

Keywords: central scotoma; gaze contingent scotoma; low vision; macular degeneration; reading; simulated scotoma.


Conflict of interest statement

CONFLICT OF INTEREST

The authors report no conflicts of interest and have no proprietary interest in any of the materials mentioned in this article.

Figures

FIGURE 1
FIGURE 1
Illustration of RSVP and scrolling procedures for simCVL and CVL observers. (a) A single trial of RSVP for simCVL observers began with a green fixation dot on an empty screen. The first word of a trial of RSVP appeared 4° inferior to the fixation dot and the word was centred in the screen. The first word disappeared and the second word appeared centred in the same location. The trial ended after the last word of the four-word sequence appeared on the screen. (b) A single trial of scrolling for simCVL observers began with a green fixation dot on an empty screen. The first letter of the first word was centred in the middle of the screen and the four-word sequence scrolled from right to left. The trial of scrolling text presentation ended when the last letter of the last word reached the centre of the screen. (c) A single trial of RSVP for CVL observers began and ended with a sequence of X’s surrounded by a bounding box. The succeeding steps were identical to that of simCVL RSVP procedure (Figure 1a). (d) A single trial of scrolling for CVL observers began and ended with a sequence of X’s surrounded by a bounding box and the succeeding steps were identical to that of the simCVL scrolling procedure (Figure 1b)
FIGURE 2
FIGURE 2
Illustration of canonical reading curve with reading speed (words per minute, WPM) as a function of text size. The reading curve is defined by three parameters: asymptotic duration corresponding to the maximum reading speed (MRS), an exponential decay constant and reading acuity (smallest text size that can be resolved). Critical print size (CPS, smallest text size achieved at 95% MRS) was estimated from the reading function
FIGURE 3
FIGURE 3
Illustration of reading performance from one representative CVL observer for each task with maximum reading speed (MRS, dashed blue line). Individual duration thresholds at each font size represented as red filled squares. Patient #2 had degenerative myopia with binocular maculopathy. (a) Duration threshold estimates for RSVP task under binocular viewing. Reading speeds remained relatively constant across font sizes. Duration threshold estimates for (b) RSVP task under better eye viewing, and scrolling text under (c) binocular and (d) better eye viewing in each case; reading speed decreases at largest font sizes instead of reaching the horizontal asymptote
FIGURE 4
FIGURE 4
Illustration of reading curves from one representative CVL observer for each task with reading estimates for maximum reading speed (MRS, dashed blue line), critical print size (CPS, solid blue square) and reading acuity (RA, solid blue diamond. Individual duration thresholds at each font size represented as red filled squares. Patient #3 had degenerative myopia with binocular maculopathy. (a) Exponential decay reading function for RSVP task under binocular viewing. The shape of the reading function reflects a shallow rise at smaller font sizes and horizontal asymptote duration at larger font sizes. (b) Exponential decay reading function for RSVP task under better eye viewing. Reading shape reflects a steeper rise at smaller font sizes compared to binocular viewing, but still a horizontal asymptote duration at larger font sizes. (c) Duration threshold data for RSVP task under binocular viewing. Data could not be fitted with an exponential decay function and does not exhibit the canonical reading shape. There was no change in reading speed across font sizes. (d) Exponential decay reading function for scrolling task under better eye viewing. Reading shape reflects the canonical shape with a steep rise at smaller font sizes and horizontal asymptote at larger font sizes
FIGURE 5
FIGURE 5
As Figure 4 for Patient #1 with binocular non-exudative AMD
FIGURE 6
FIGURE 6
Illustration of area under the log reading curve (AULC). To determine the AULC, a line was fitted between each sequential font size and terminated at the smallest and largest font size tested
FIGURE 7
FIGURE 7
Reading speed as a function of font size and text presentation for SimCVL observers. Box plots show the duration threshold required for reading aloud a four-word phrase presented at 4° eccentricity in the inferior visual field. Text was presented at three font sizes (0.50, 0.80 or 1.00 logMAR in ascending order, respectively) and in RSVP (blue) or scrolling (orange) presentation, as indicated on the abscissa. Horizontal bars show the median, x shows the mean, the box shows the interquartile range, error bars indicate the 95% confidence intervals, the circles show individual data for individual subjects and any data points outside the error bars are outliers. Significant differences are indicated by the brackets, *p < 0.001. For reference, 120 wpm = 2.08 log(wpm) and 480 wpm = 2.68 log(wpm)
FIGURE 8
FIGURE 8
Binocular reading speed as a function of font size and text presentation for CVL observers. Box plots show the duration threshold required for reading aloud a four-word phrase. Text was presented at four font sizes (1.00 logMAR, 1.10 logMAR, 1.20 logMAR, 1.30 logMAR in descending order) and in RSVP (blue) or scrolling (orange) presentation, as indicated on the abscissa. Horizontal bars show the median, x shows the mean, the box shows the interquartile range, error bars show 95% confidence intervals and the circles show individual data for individual subjects. There were no significant differences between any of the conditions
FIGURE 9
FIGURE 9
Monocular reading speed as a function of font size and text presentation for CVL observers. Box plots show the duration threshold required for reading aloud a four-word phrase. Text was presented at four font sizes (1.00 logMAR, 1.10 logMAR, 1.20 logMAR, 1.30 logMAR in descending order) and in RSVP (blue) or scrolling (orange) presentation, as indicated on the abscissa. Horizontal bars show the median, x shows the mean, the box shows the interquartile range, error bars show 95% confidence intervals and the circles show individual data for individual subjects. There were no significant differences between any of the conditions
FIGURE 10
FIGURE 10
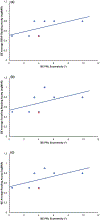
Correlation between CVL better eye (BE) average reading acuities and PRL eccentricities. The red triangle in each plot represents the simCVL average reading acuity at 4° eccentricity. (a) Shows the correlation between the better eye RSVP reading acuity in logMAR and the better eye PRL eccentricity in degrees. (b) Shows the correlation between the better eye scrolling reading acuity in logMAR and the better eye PRL eccentricity in degrees. (c) Shows the correlation between the better eye average acuity for RSVP and scrolling and the better eye PRL eccentricity in degrees
FIGURE 11
FIGURE 11
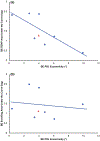
Correlation between CVL better eye area under the log reading curves (AULC) and better eye PRL eccentricity. The red triangle in each plot represents the average simCVL area under the curve at 4° eccentricity. (a) Correlation between the BE RSVP AULC in log units on the y axis and BE PRL eccentricity in degrees on the x axis. (b) Correlation between the BE scrolling AULC in log units on the y axis and BE PRL eccentricity in degrees on the x axis
FIGURE 12
FIGURE 12
Illustration of reading curves from one representative SimCVL normally-sighted observer for each task with reading estimates for maximum reading speed (MRS, dashed blue line), critical print size (CPS, solid blue square) and reading acuity (RA, solid blue diamond). Individual duration thresholds at each font size are represented as red filled squares. (a) Exponential decay reading function for RSVP task under binocular viewing. Reading shape reflects a steep rise at the smaller font size and horizontal asymptote duration at larger font sizes. (b) Exponential decay reading function for scrolling task under binocular viewing. The shape of the reading function reflects a sharp rise at the smaller font size and horizontal asymptote duration at larger font size

References

    1. Friedman DS, O’Colmain BJ, Munoz B, et al. Prevalence of age-related macular degeneration in the United States. Arch Ophthalmol 2004;122:564–572. - PubMed
    1. Fletcher DC, Schuchard RA. Preferred retinal loci relationship to macular scotomas in a low-vision population. Ophthalmology 1997;104:632–638. - PubMed
    1. Shima N, Markowitz SN, Reyes SV. Concept of a functional retinal locus in age-related macular degeneration. Can J Ophthalmol 2010;45:62–66. - PubMed
    1. Bernard JB, Chung STL. Visual acuity is not the best at the preferred retinal locus in people with macular disease. Optom Vis Sci 2018;95:829–836. - PMC - PubMed
    1. Lei H, Schuchard RA. Using two preferred retinal loci for different lighting conditions in observers with central scotomas. Invest Ophthalmol Vis Sci 1997;38:1812–1818. - PubMed

Publication types