

Sarcopenia as a prognostic predictor of liver cirrhosis: a multicentre study in China
- PMID: 34520115
- PMCID: PMC8718091
- DOI: 10.1002/jcsm.12797
Sarcopenia as a prognostic predictor of liver cirrhosis: a multicentre study in China
Abstract
Background: Diagnostic criteria for sarcopenia have not been established in Chinese. This study established criteria based on the L3-skeletal muscle index (L3-SMI) and assessed its value for outcomes predicting in cirrhotic Chinese patients.
Methods: Totally 911 subjects who underwent a CT scan at two centres were enrolled in Cohort 1 (394 male and 417 female subjects, aged 20-80 years). The data of those subjects younger than 60 years (365 male and 296 female subjects) were used to determine the reference intervals of the L3-SMI and its influencing factors. Cohort 2 consisted of 480 patients (286 male and 184 female patients) from three centres, and their data were used to investigate the prevalence of sarcopenia and evaluate the value of L3-SMI for predicting the prognosis and complications of cirrhosis.
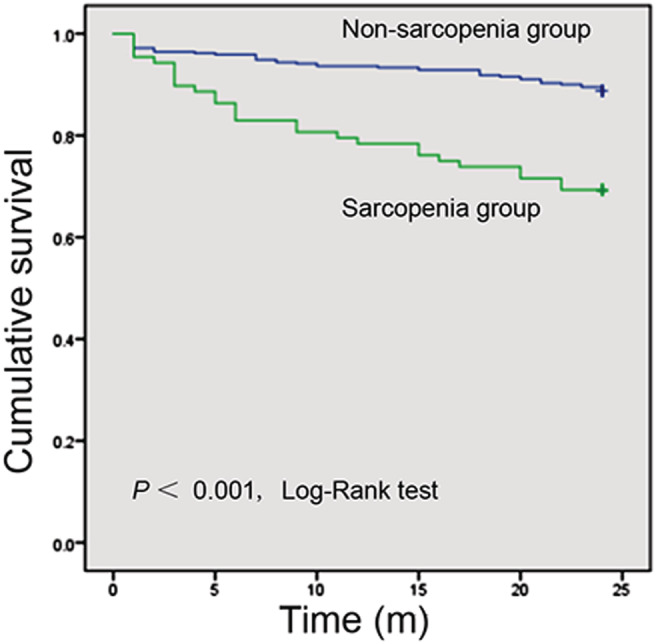
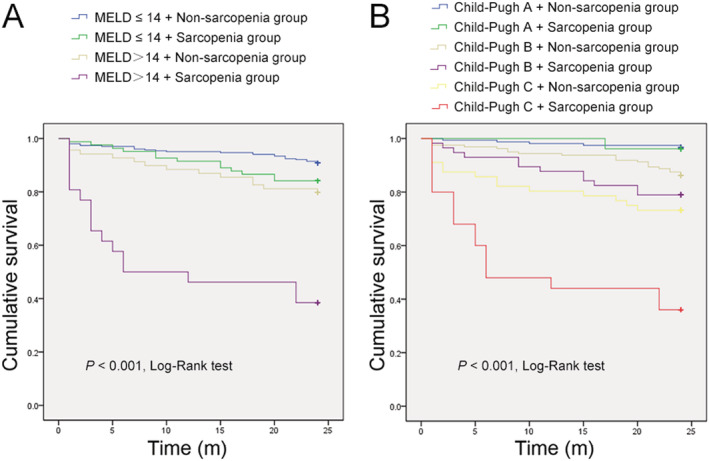
Results: Age and sex had the greatest effects on the L3-SMI (P < 0.001). The L3-SMI scores were clearly higher in male patients than in female patients (52.94 ± 8.41 vs. 38.91 ± 5.65 cm2 /m2 , P < 0.001) and sharply declined in subjects aged ≥ 60 years. Based on the mean -1.28 × SD among adults aged < 60 years, the L3-SMI cut-off value for sarcopenia was 44.77 cm2 /m2 in male patients and 32.50 cm2 /m2 in female patients. Using these values, 22.5% of the cirrhotic patients (28.7% of male patients and 11.9% of female patients) were diagnosed with sarcopenia. Compared with non-sarcopenia individuals, sarcopenia patients had lower body mass index (21.28 ± 3.01 vs. 24.09 ± 3.39 kg/m2 , P < 0.001) and serum albumin levels (31.54 ± 5.93 vs. 32.93 ± 5.95 g/L, P = 0.032), longer prothrombin times (16.39 ± 3.05 vs. 15.71 ± 3.20 s, P = 0.049), higher total bilirubin concentrations (41.33 ± 57.38 vs. 32.52 ± 31.48 μmol/L, P = 0.039), worse liver function (Child-Pugh score, 8.05 ± 2.11 vs. 7.32 ± 2.05, P = 0.001), higher prevalence of cirrhosis-related complications (81.82% vs. 62.24%, P < 0.001) and mortality (30.68% vs. 11.22%, P < 0.001). Overall survival was significantly lower in the sarcopenia group [risk ratio (RR) = 2.643, 95% confidence interval (CI) 1.646-4.244, P < 0.001], accompanied with an increased cumulative incidence of ascites (RR = 1.827, 95% CI 1.259-2.651, P = 0.002), spontaneous bacterial peritonitis (RR = 3.331, 95% CI 1.404-7.903, P = 0.006), hepatic encephalopathy (RR = 1.962, 95% CI 1.070-3.600, P = 0.029), and upper gastrointestinal varices (RR = 2.138, 95% CI 1.319-3.466, P = 0.002). Subgroup analysis showed sarcopenia shortened the survival of the patients with Model For End-Stage Liver Disease score > 14 (RR = 4.310, 95% CI 2.091-8.882, P < 0.001) or Child-Pugh C (RR = 3.081, 95% CI 1.516-6.260, P = 0.002).
Conclusions: Sarcopenia is a common comorbidity of cirrhosis and can be used to predict cirrhosis-related complications and the prognosis.
Keywords: Cirrhosis-related complications; Diagnostic criteria; L3 skeletal muscle index; Liver function; Malnutrition; Nutritional assessment; Nutritional screening; Prognosis prediction; Sarcopenia; Survival.
© 2021 The Authors. Journal of Cachexia, Sarcopenia and Muscle published by John Wiley & Sons Ltd on behalf of Society on Sarcopenia, Cachexia and Wasting Disorders.
Conflict of interest statement
The authors have no conflict of interest regarding this study.
Figures
Comment in
-
Sarcopenia as a prognostic indicator of liver cirrhosis.J Cachexia Sarcopenia Muscle. 2022 Feb;13(1):8-10. doi: 10.1002/jcsm.12869. Epub 2021 Nov 23. J Cachexia Sarcopenia Muscle. 2022. PMID: 34812591 Free PMC article. No abstract available.
References
-
- Tsochatzis EA, Bosch J, Burroughs AK. Liver cirrhosis. Lancet 2014;383:1749–1761. - PubMed
-
- Li M, Wang ZQ, Zhang L, Zheng H, Liu DW, Zhou MG. Burden of cirrhosis and other chronic liver diseases caused by specific etiologies in China, 1990‐2016: findings from the Global Burden of Disease Study 2016. Biomed Environ Sci 2020;33:1–10. - PubMed
-
- Zhang L, Fan ZF, Liu DW, Zhou MG, Wang ZQ, Li M. Trend analysis on the disease burden related to cirrhosis and other chronic liver diseases caused by hepatitis B, in China, from 1990 to 2016. Zhonghua Liu Xing Bing Xue Za Zhi 2020;41:173–177. - PubMed
-
- Lautz HU, Selberg O, Körber J, Bürger M, Müller MJ. Protein‐calorie malnutrition in liver cirrhosis. Clin Investig 1992;70:478–486. - PubMed
-
- Tandon P, Ney M, Irwin I, Ma MM, Gramlich L, Bain VG, et al. Severe muscle depletion in patients on the liver transplant wait list: its prevalence and independent prognostic value. Liver Transpl 2012;18:1209–1216. - PubMed
Publication types
MeSH terms
LinkOut - more resources
Full Text Sources
Medical
