

Predicting clinical outcomes in COVID-19 using radiomics on chest radiographs
- PMID: 34520246
- PMCID: PMC9328073
- DOI: 10.1259/bjr.20210221
Predicting clinical outcomes in COVID-19 using radiomics on chest radiographs
Abstract
Objectives: For optimal utilization of healthcare resources, there is a critical need for early identification of COVID-19 patients at risk of poor prognosis as defined by the need for intensive unit care and mechanical ventilation. We tested the feasibility of chest X-ray (CXR)-based radiomics metrics to develop machine-learning algorithms for predicting patients with poor outcomes.
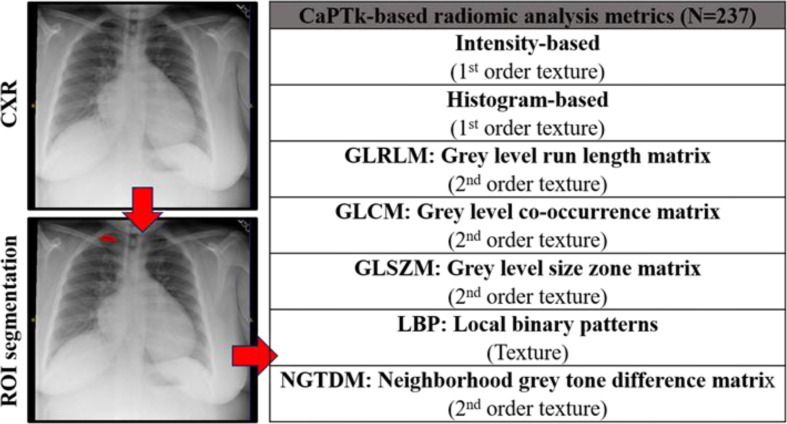
Methods: In this Institutional Review Board (IRB) approved, Health Insurance Portability and Accountability Act (HIPAA) compliant, retrospective study, we evaluated CXRs performed around the time of admission from 167 COVID-19 patients. Of the 167 patients, 68 (40.72%) required intensive care during their stay, 45 (26.95%) required intubation, and 25 (14.97%) died. Lung opacities were manually segmented using ITK-SNAP (open-source software). CaPTk (open-source software) was used to perform 2D radiomics analysis.
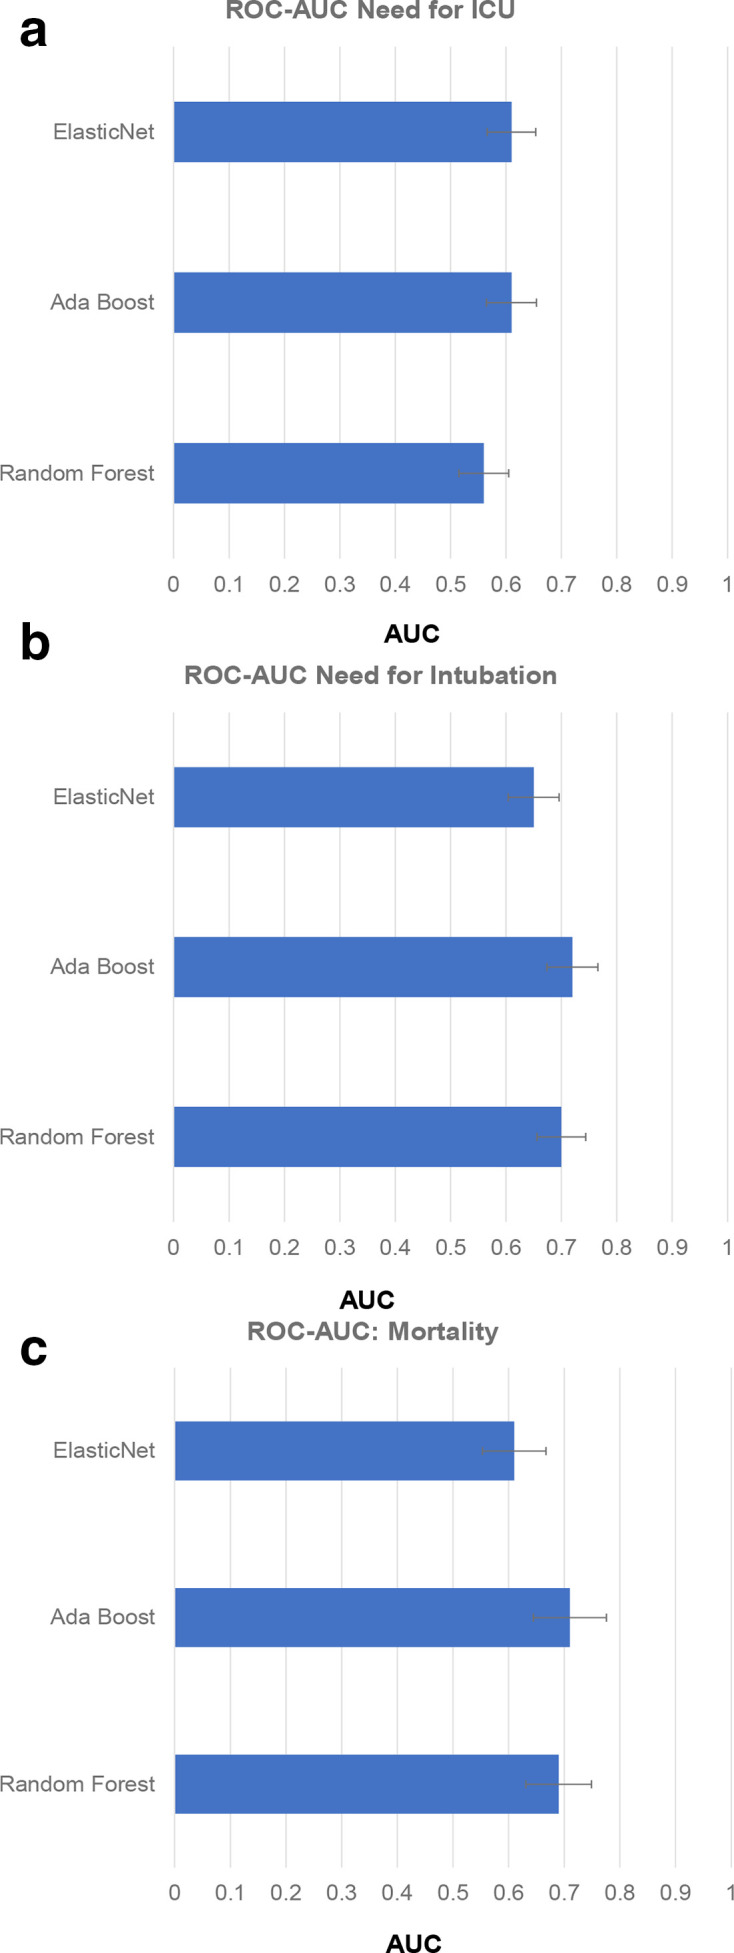
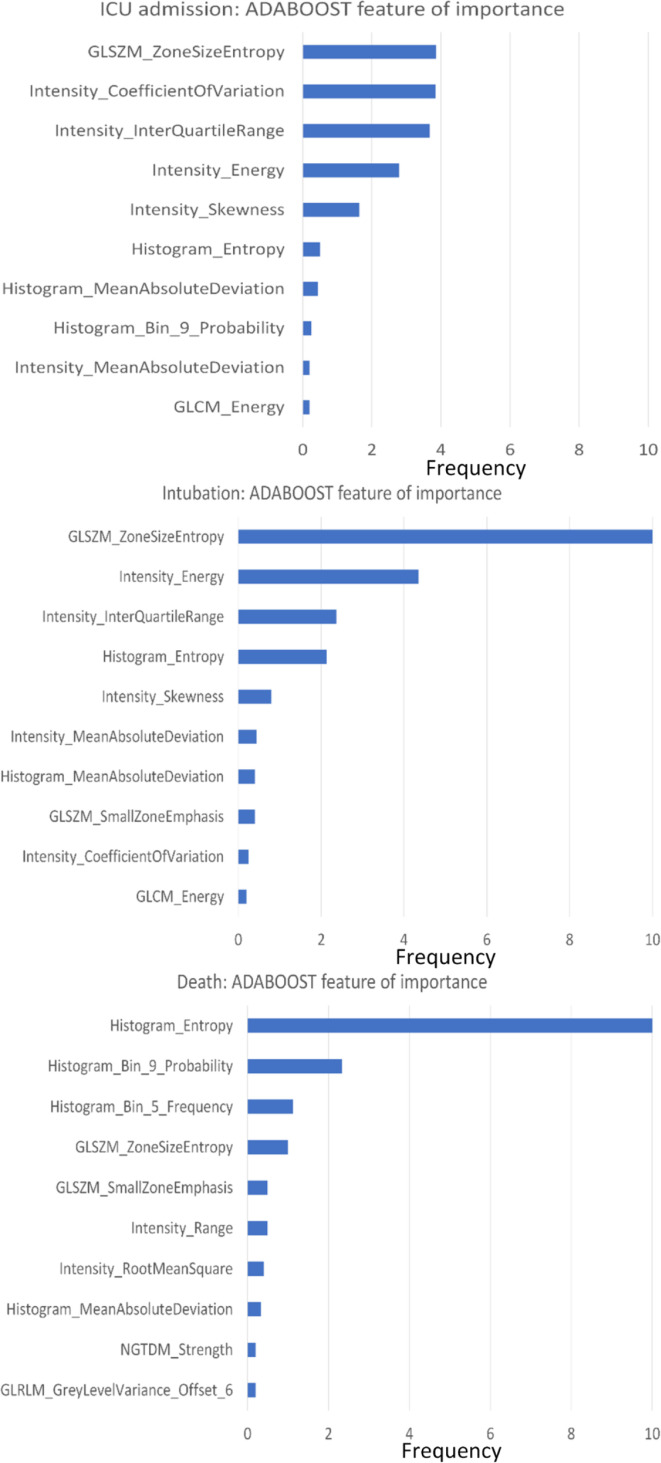
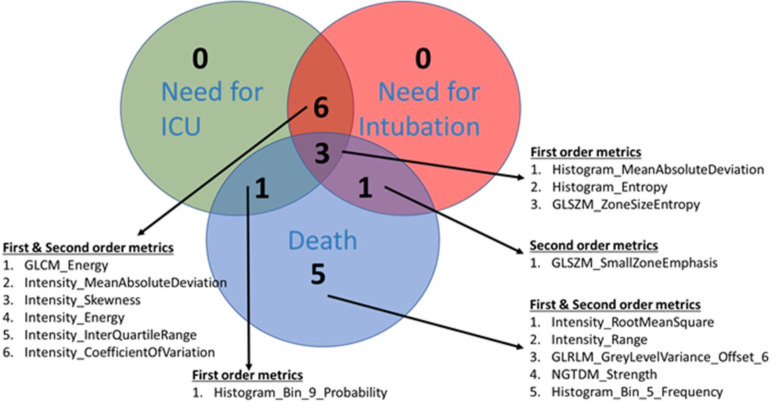
Results: Of all the algorithms considered, the AdaBoost classifier performed the best with AUC = 0.72 to predict the need for intubation, AUC = 0.71 to predict death, and AUC = 0.61 to predict the need for admission to the intensive care unit (ICU). AdaBoost had similar performance with ElasticNet in predicting the need for admission to ICU. Analysis of the key radiomic metrics that drive model prediction and performance showed the importance of first-order texture metrics compared to other radiomics panel metrics. Using a Venn-diagram analysis, two first-order texture metrics and one second-order texture metric that consistently played an important role in driving model performance in all three outcome predictions were identified.
Conclusions: Considering the quantitative nature and reliability of radiomic metrics, they can be used prospectively as prognostic markers to individualize treatment plans for COVID-19 patients and also assist with healthcare resource management.
Advances in knowledge: We report on the performance of CXR-based imaging metrics extracted from RT-PCR positive COVID-19 patients at admission to develop machine-learning algorithms for predicting the need for ICU, the need for intubation, and mortality, respectively.
Figures
Similar articles
-
Radiomics Analysis of Computed Tomography helps predict poor prognostic outcome in COVID-19.Theranostics. 2020 Jun 5;10(16):7231-7244. doi: 10.7150/thno.46428. eCollection 2020. Theranostics. 2020. PMID: 32641989 Free PMC article.
-
Initial chest radiographs and artificial intelligence (AI) predict clinical outcomes in COVID-19 patients: analysis of 697 Italian patients.Eur Radiol. 2021 Mar;31(3):1770-1779. doi: 10.1007/s00330-020-07269-8. Epub 2020 Sep 18. Eur Radiol. 2021. PMID: 32945968 Free PMC article.
-
Initial chest radiograph scores inform COVID-19 status, intensive care unit admission and need for mechanical ventilation.Clin Radiol. 2021 Jun;76(6):473.e1-473.e7. doi: 10.1016/j.crad.2021.02.005. Epub 2021 Feb 18. Clin Radiol. 2021. PMID: 33706997 Free PMC article.
-
Machine learning algorithms to predict outcomes in children and adolescents with COVID-19: A systematic review.Artif Intell Med. 2024 Apr;150:102824. doi: 10.1016/j.artmed.2024.102824. Epub 2024 Feb 24. Artif Intell Med. 2024. PMID: 38553164
-
COVID Mortality Prediction with Machine Learning Methods: A Systematic Review and Critical Appraisal.J Pers Med. 2021 Sep 7;11(9):893. doi: 10.3390/jpm11090893. J Pers Med. 2021. PMID: 34575670 Free PMC article. Review.
Cited by
-
Use of machine learning to assess the prognostic utility of radiomic features for in-hospital COVID-19 mortality.Sci Rep. 2023 May 5;13(1):7318. doi: 10.1038/s41598-023-34559-0. Sci Rep. 2023. PMID: 37147440 Free PMC article.
-
Development and Validation of a Deep Learning Classifier Using Chest Radiographs to Predict Extubation Success in Patients Undergoing Invasive Mechanical Ventilation.Bioengineering (Basel). 2024 Jun 19;11(6):626. doi: 10.3390/bioengineering11060626. Bioengineering (Basel). 2024. PMID: 38927862 Free PMC article.
-
Radiomics analysis in medical imaging research.J Med Radiat Sci. 2023 Mar;70(1):3-7. doi: 10.1002/jmrs.662. Epub 2023 Feb 10. J Med Radiat Sci. 2023. PMID: 36762402 Free PMC article.
-
Prognostic models in COVID-19 infection that predict severity: a systematic review.Eur J Epidemiol. 2023 Apr;38(4):355-372. doi: 10.1007/s10654-023-00973-x. Epub 2023 Feb 25. Eur J Epidemiol. 2023. PMID: 36840867 Free PMC article.
-
Assessing the prognostic utility of clinical and radiomic features for COVID-19 patients admitted to ICU: challenges and lessons learned.Harv Data Sci Rev. 2024 Winter;6(1):10.1162/99608f92.9d86a749. doi: 10.1162/99608f92.9d86a749. Epub 2024 Jan 31. Harv Data Sci Rev. 2024. PMID: 38974963 Free PMC article.
References
-
- CDC . COVID-19 Cases, Deaths, and Trends in the US | CDC COVID Data Tracker. In: Centers for Disease Control and Prevention; 2020. https://covid.cdc.gov/covid-data-tracker.
-
- Coronavirus COVID-19 (SARS-CoV-2) | Johns Hopkins ABX Guide. 2021. Available from: https://www.hopkinsguides.com/hopkins/view/Johns_Hopkins_ABX_Guide/54074... [11 Jan 2021].
MeSH terms
LinkOut - more resources
Full Text Sources
Medical
