. 2021 Sep 14;13(17):21202-21215.
doi: 10.18632/aging.203421. Epub 2021 Sep 14.

UPF1 impacts on mTOR signaling pathway and autophagy in endometrioid endometrial carcinoma

Affiliations

UPF1 impacts on mTOR signaling pathway and autophagy in endometrioid endometrial carcinoma

Minfen Zhang et al. Aging (Albany NY). .

Abstract

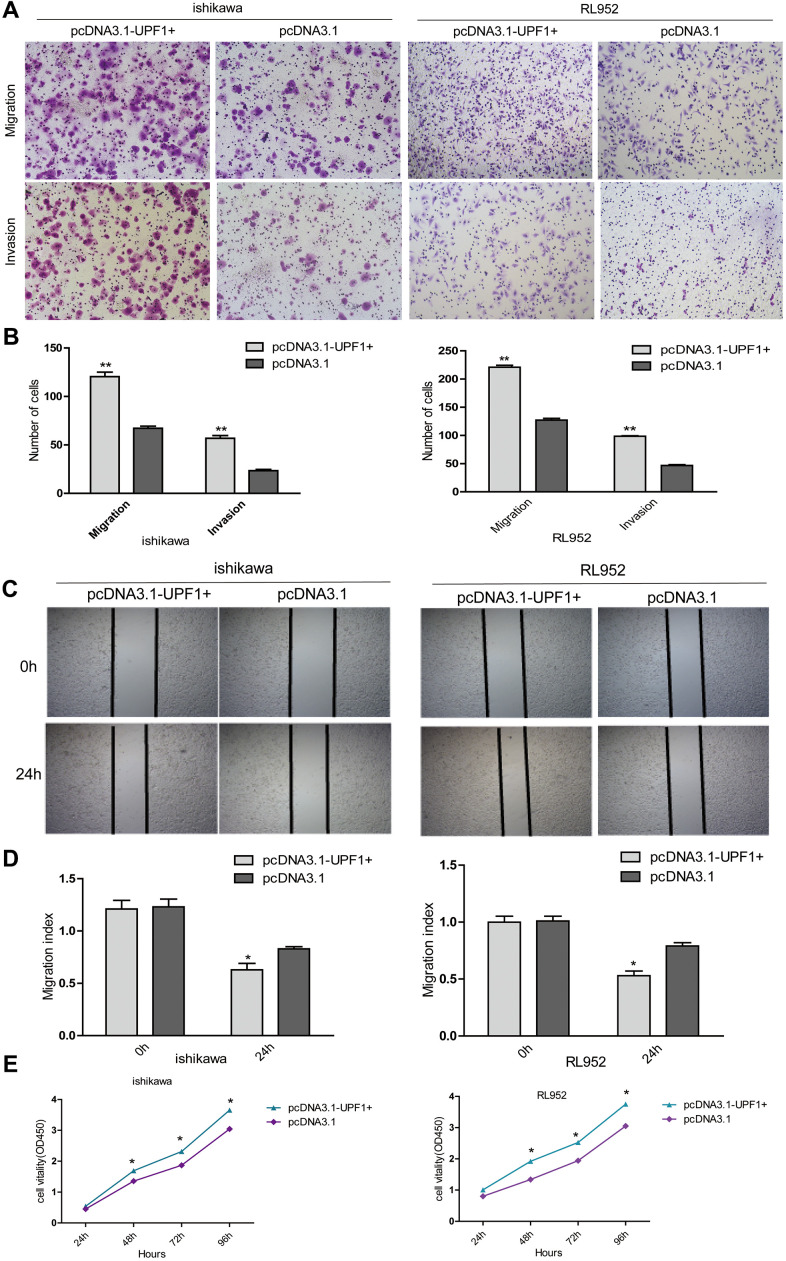
Most EEC cases are associated with activities of the mTOR pathway, which regulates protein synthesis, cell growth and autophagy. While Up-Frameshift 1(UPF1) is a key protein factor in the nonsense-mediated mRNA degradation pathway (NMD), its role in carcinogenesis of EEC remains unclear. In this study, we first evaluated the expression level of UPF1 in EEC tissues and cell lines. Then, we investigated the effect of UPF1 on cellular function and mTOR signaling pathway; these effects were further validated in vivo. Finally, its effect on autophagy was evaluated by western blot and GFP-mRFP-LC3 staining. UPF1 expression in the EEC tissue samples was significantly higher than that of matched normal tissue samples. Overexpression of UPF1 promoted migration and invasion of EEC cells. Conversely, depletion of UPF1 suppressed migration and invasion of EEC cells. In addition, overexpression of UPF1 increased the in vivo growth of our EEC xenograft tumors. Finally, UPF1 increased the activity of the mTOR/P70S6K/4EBP1 signaling pathway and inhibited autophagy in EEC cells. These findings suggest that UPF1 functions as an oncogene to promote EEC carcinogenesis. Our findings propose UPF1 as a new potential therapeutic target for EEC.

Keywords: UPF1; autophagy; endometrioid endometrial carcinoma; mTOR.


Conflict of interest statement

CONFLICTS OF INTEREST: The authors declare that they have no conflicts of interest.

Figures

Figure 1
Figure 1
High expression of UPF1 in EEC: (A, B) 28 (66.7%) of 42 EEC patients had high expression of UPF1. In 5 of 42 cases (11.9%), the expression level was lower than normal tissues. Of the 42 cases, 9 had no significant difference with normal tissues. (C) Overall analysis the high expression of UPF1 in EEC is of great significance. (D) Immunohistochemical results showed that the positive rate of 17 (80.95%) of the 21 patients (T) was higher than that of the normal control group (N). The positive rate of 4 cases (T) (19.05%) was lower than that of the normal control group (N)(NIKON, 200X). (E) Scoring of immunohistochemistry. Data was represented as the mean +/- SEM.*P<0.05, **P<0.01, ***P<0.001.
Figure 2
Figure 2
Expression of UPF1 in EEC cells. (A, B) UPF1 expressed level in four EEC cell lines by qRT-PCR and western blot. (CF) UPF1 was upregulated or downregulated in Ishikawa and RL952 cells when we overexpressed UPF1(pcDNA3.1-UPF1+ and pcDNA3.1 group) or silenced UPF1(siUPF1 and NC group). siUPF1 has three fragments, we had selected the best effect in silence the expression of UPF1(siUPF1-1) to do the latter experiment.
Figure 3
Figure 3
The effect of UPF1 on cell migration, invasion and proliferation in Ishikawa and RL952 EEC cells. (A, B) Migration and invasion assay in Ishikawa and RL952 cells that were transfected with the pcDNA3.1-UPF1+ and pcDNA3.1. Cells were evaluated at 12h after transfection(NIKON,100X). The results are shown as the mean±SEM from two independent experiments(**P<0.01). (C, D) Wound healing assay showing cell migration in Ishikawa and RL952 cells(*p<0.05). (E) CCK8 assay showing cell proliferation in Ishikawa and RL952 that were transfected with pcDNA3.1-UPF1+, pcDNA3.1 (*p<0.05). Data was represented as the mean +/- SEM. *P<0.05, **P<0.01, ***P<0.001.
Figure 4
Figure 4
The effect of UPF1 on cell migration, invasion and proliferation in Ishikawa and RL952 EEC cells. (A, B) Migration and invasion assay in Ishikawa and RL952 cells that were transfected with siUPF1 and NC. Cells were evaluated at 24h after transfection(NIKON,100X). The results are shown as the mean±SEM from two independent experiments(**P<0.01). (C, D) Wound healing assay showing cell migration in Ishikawa and RL952 cells(*p<0.05). (E) CCK8 assay showing cell proliferation in Ishikawa and RL952 that were transfected with siUPF1 and NC(*p<0.05). Data was represented as the mean +/- SEM.*P<0.05, **P<0.01, ***P<0.001.
Figure 5
Figure 5
mTOR signaling pathway and autophagy related proteins detection. (A) Bioinformatics prediction (http://www.string-db.org):mTOR and UPF1 maybe co-expression and interaction. However, mTOR and ULK1 show that both of its relationship have verified. (B, C) Transfected with pcDNA3.1-UPF1+ and pcDNA3.1 or siUPF1 and NC in Ishikawa showed that UPF1 could affect mTOR and downstream’s proteins. (D, E) Overexpressed UPF1 or downregulated UPF1 could inhibit or promote autophagy. LC3I/II and p62 showed autophagy weakened or increased. (FI) The immunofluorescence assays were performed in EEC cells that were transfected with mRFP-GFP-LC3 lentiviral in two different groups. The numbers of GFP and mRFP dots were determined by fluorescent puncta in three high-power fields. The statistical significance between different groups. Data was represented as the mean +/- SEM.*P<0.05, **P<0.01, ***P<0.001.
Figure 6
Figure 6
UPF1 influenced tumor growth, mTOR signal pathway and autophagy in vivo. (A, G) Photographs showing tumors that Lentivirus transfected with UPF1 stable expressed Ishikawa cell line (LV-UPF1+) and the control (LV-CON238), and that Lentivirus transfected with interfered UPF1 expressed Ishikawa cell line(LV-UPF1-RNAi), the control (LV-CON077) and wild Type group (WT). (B, H) qRT-PCR detected the relative expression of UPF1 in stable cell line. (C, I) The means tumor weights in nude mice were significant compared with the control group (**P<0.01). (D, J) H&E-stained slides (NIKON,400X) and IHC showed expression of UPF1 in tumors. (E, F, K, L) The mTOR related proteins’ and autophagy related proteins’ expression in tumors.

References

    1. Pavlidou A, Vlahos NF. Molecular alterations of PI3K/Akt/mTOR pathway: a therapeutic target in endometrial cancer. ScientificWorldJournal. 2014; 2014:709736. 10.1155/2014/709736 - DOI - PMC - PubMed
    1. Morice P, Leary A, Creutzberg C, Abu-Rustum N, Darai E. Endometrial cancer. Lancet. 2016; 387:1094–108. 10.1016/S0140-6736(15)00130-0 - DOI - PubMed
    1. Grabinski N, Ewald F, Hofmann BT, Staufer K, Schumacher U, Nashan B, Jücker M. Combined targeting of AKT and mTOR synergistically inhibits proliferation of hepatocellular carcinoma cells. Mol Cancer. 2012; 11:85. 10.1186/1476-4598-11-85 - DOI - PMC - PubMed
    1. Bellacosa A, Kumar CC, Di Cristofano A, Testa JR. Activation of AKT kinases in cancer: implications for therapeutic targeting. Adv Cancer Res. 2005; 94:29–86. 10.1016/S0065-230X(05)94002-5 - DOI - PubMed
    1. Manning BD, Cantley LC. AKT/PKB signaling: navigating downstream. Cell. 2007; 129:1261–74. 10.1016/j.cell.2007.06.009 - DOI - PMC - PubMed

Publication types

MeSH terms