. 2021 Oct 15;131(20):e145296.
doi: 10.1172/JCI145296.

Breast cancer-derived GM-CSF regulates arginase 1 in myeloid cells to promote an immunosuppressive microenvironment

Affiliations

Breast cancer-derived GM-CSF regulates arginase 1 in myeloid cells to promote an immunosuppressive microenvironment

Xinming Su et al. J Clin Invest. .

Abstract

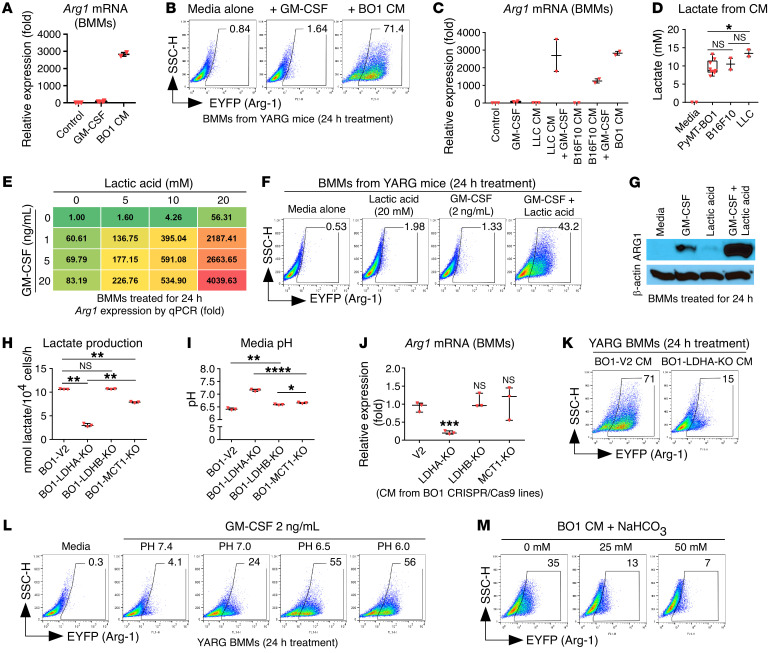
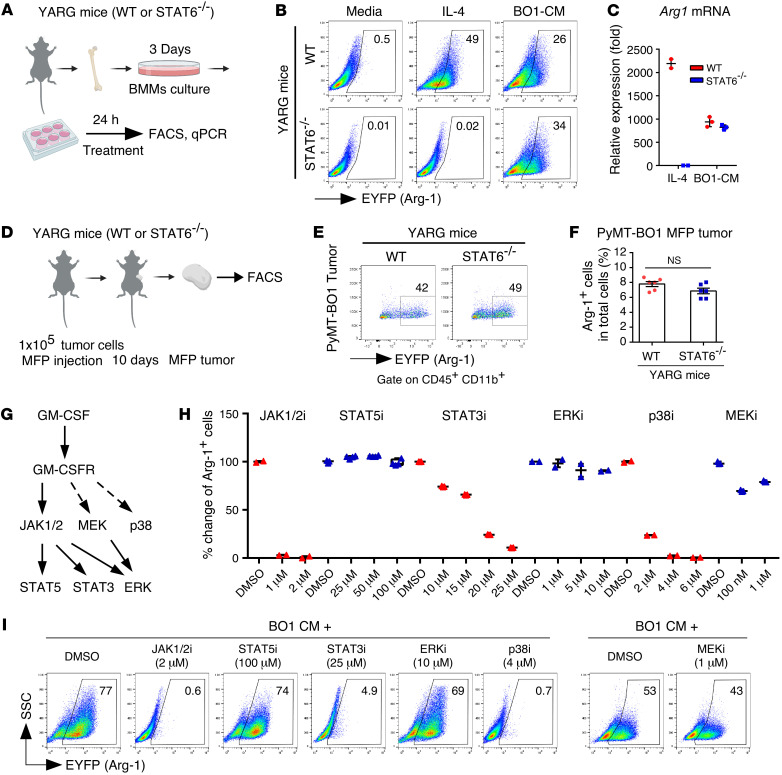
Tumor-infiltrating myeloid cells contribute to the development of the immunosuppressive tumor microenvironment. Myeloid cell expression of arginase 1 (ARG1) promotes a protumor phenotype by inhibiting T cell function and depleting extracellular l-arginine, but the mechanism underlying this expression, especially in breast cancer, is poorly understood. In breast cancer clinical samples and in our mouse models, we identified tumor-derived GM-CSF as the primary regulator of myeloid cell ARG1 expression and local immune suppression through a gene-KO screen of breast tumor cell-produced factors. The induction of myeloid cell ARG1 required GM-CSF and a low pH environment. GM-CSF signaling through STAT3 and p38 MAPK and acid signaling through cAMP were required to activate myeloid cell ARG1 expression in a STAT6-independent manner. Importantly, breast tumor cell-derived GM-CSF promoted tumor progression by inhibiting host antitumor immunity, driving a significant accumulation of ARG1-expressing myeloid cells compared with lung and melanoma tumors with minimal GM-CSF expression. Blockade of tumoral GM-CSF enhanced the efficacy of tumor-specific adoptive T cell therapy and immune checkpoint blockade. Taken together, we show that breast tumor cell-derived GM-CSF contributes to the development of the immunosuppressive breast cancer microenvironment by regulating myeloid cell ARG1 expression and can be targeted to enhance breast cancer immunotherapy.

Keywords: Breast cancer; Cancer immunotherapy; Immunology; Macrophages; Oncology.


Conflict of interest statement

Conflict of interest: The authors have declared that no conflict of interest exists.

Figures

Figure 1
Figure 1. Immunosuppressive ARG1-expressing myeloid cells accumulate in the breast TME.
(A) PyMT-BO1 breast tumor cells (1 × 10⁵) were injected into the MFP tissue of C57BL/6J female mice, and tumor growth was measured by digital calipers. (B) Single-cell suspensions from whole-tumor tissue were analyzed by FACS on days 6, 10, and 15 of tumor growth. The TIM and T cell populations are shown. TAM markers are CD45+, CD11b+, Ly6C, Ly6G, and F4/80+. M1 TAMs are MHC-II+, and M2 TAMs are CD206+. (C) Weights of PyMT-BO1 orthotopic tumors from YARG mice. (D) Percentage of ARG1-expressing myeloid cells in CD45+CD11b+ TIMs. (E) Percentage of TIM subpopulations in total CD45+CD11b+ myeloid cells from day-10 tumors. The ARG1 cells (white) and ARG1+ cells (blue) are labeled for each subpopulation. (F) ARG1-expressing myeloid cells in CCR2hi and CCR2loCD45+CD11b+ myeloid cells. FSC-W, forward scatter width. (G) ARG1-expressing CD45+CD11b+ myeloid cells in PyMT-BO1 breast cancer MFP tumor tissue, B16F10 melanoma, and LLC lung cancer subcutaneous tumor tissue. (H) Immunofluorescence staining of paraffin-embedded BO1 MFP tissue. Scale bars: 1 mm (whole-tumor tissue); 25 μm (enlarged images).
Figure 2
Figure 2. ARG1-expressing myeloid cells accumulate in human breast cancer tissue.
Lung cancer (n = 10), melanoma (n = 10), and breast cancer (n = 60) tissue microarrays (TMAs) were used for immunofluorescence staining. (A) CD68+ myeloid cell number per mm2 tissue area, and (B) percentage of ARG1+ cells in total CD68+ cells from lung cancer, melanoma, and breast cancer tissues. (C) CD68+ myeloid cell number per mm2 tissue area, and (D) percentage of ARG1+ cells in total CD68+ cells from breast cancer (BC) subtypes. (E) ARG1+CD68+ myeloid cell number per mm2 tissue area from breast cancer based on cancer stage. (F) Representative immunofluorescence images of stained paraffin-embedded human cancer tissue. Scale bars: 500 μm (whole-tissue images); 100 μm (enlarged images). Data are shown as the mean ± SEM. *P < 0.05, **P < 0.01, ***P < 0.001, and ****P < 0.0001, by 2-tailed, unpaired Student’s t test with Welch’s correction.
Figure 3
Figure 3. Tumor cell–produced GM-CSF is necessary to induce myeloid cell ARG1 expression.
(A) Arg1 mRNA expression in BMMs treated with LLC, B16F10, PyMT-BO1, and 4T1 tumor cell CM (n = 2–3). (B) CFSE-labeled whole splenic cells stimulated (stim) with plate-banded anti-CD3E antibody and soluble anti-CD28 antibody, cocultured with 1:1 diluted CM from PyMT-BO1 or FACS-sorted ARG1+ or ARG1 BMMs pretreated with PyMT-BO1 CM. T cell proliferation was measured from the quantification of CFSE dilution in gated CD4+ T cells by FACS (n = 3). (C) Microarray analysis of gene expression in breast tumor cells and CD206+ TAMs sorted by FACS from the same tumor tissue. (D) Arg1 mRNA expression in BMMs treated with tumor cell CM from PyMT-BO1 or CRISPR/Cas9-mediated gene-KO PyMT-BO1 tumor cells (n = 2). (E) Western blot of ARG1 in tumor cell CM–treated BMMs. (F) Quantification of GM-CSF levels in tumor cell CM by ELISA (n 2–4). (G and H) Arg1 mRNA expression in BMMs treated with tumor cell CM that included anti-CSF2 (αCSF2) antibody or CSF2 (n = 2). (I) ARG1 expression quantified as EYFP expression by FACS of YARG BMMs treated as indicated. SSC, side scatter. (J) BO1-WT (vector control) or BO1-CSF2–KO breast tumor cells (1 × 10⁵) were injected into MFP tissues of 8-week-old female YARG mice. On day 10, single-cell suspensions from whole-tumor tissue were analyzed by FACS. ARG1 expression in TIMs was quantified as EYFP expression. In E and I, data are representative of 3 independent experiments. Data are shown as the mean ± SEM. *P < 0.05, **P < 0.01, ***P < 0.001, and ****P < 0.0001, by 2-tailed, unpaired Student’s t test with Welch’s correction. iso-Ab, isotype control antibody.
Figure 4
Figure 4. GM-CSF and LA synergistically induce myeloid cell ARG1 expression.
(A) Arg1 mRNA expression in BMMs treated with recombinant GM-CSF or PyMT-BO1 tumor cell CM (n = 2–3). (B) FACS quantification of ARG1+ cells from YARG BMMs treated with recombinant GM-CSF or PyMT-BO1 tumor cell CM. (C) Arg1 mRNA expression in BMMs treated with tumor cell CM plus recombinant GM-CSF (n = 2–3). (D) Quantification of lactate from tumor cell CM. (E) Arg1 mRNA expression in BMMs treated with recombinant GM-CSF and LA. (F) ARG1+ cells quantified by FACS. (G) ARG1 expression in BMMs was detected by Western blotting after GM-CSF and LA treatment. (H) Lactate production from tumor cell CM (n = 3). (I) Tumor cell CM pH measurement (n = 3). (J) Arg1 mRNA expression in BMMs (n = 3). (K) ARG1+ cells quantified by FACS. (L) YARG BMMs were treated with GM-CSF. The media pH was adjusted with hydrochloric acid. (M) BO1 tumor CM were premixed with NaHCO3 at the indicated concentrations before being added to YARG BMMs. In B, F, G, and KM, data are representative of 3 independent experiments. Data are shown as the mean ± SEM. *P < 0.05, **P < 0.01, ***P < 0.001, and ****P < 0.0001, by 2-tailed, unpaired Student’s t test with Welch’s correction. SSC-H, side scatter height.
Figure 5
Figure 5. GM-CSF signaling regulates myeloid cell ARG1 expression through noncanonical pathways.
(A) Experimental scheme. (B) WT or Stat6–/– YARG BMMs were treated with recombinant IL-4 or PyMT-BO1 tumor cell CM for 24 hours, and ARG1+ cells were quantified by FACS. (C) Arg1 mRNA expression in WT and Stat6–/– BMMs treated with IL-4 or PyMT-BO1 tumor cell CM (n = 2–3). (D) Experimental scheme. (E and F) PyMT-BO1 tumor cells (1 × 10⁵) were injected into MFP tissue of WT or Stat6–/– YARG mice. After tumors reached 500 mm3 in size, ARG1+ cells from whole-tumor tissue single-cell suspensions were quantified by FACS (n = 6). (G) Working model of GM-CSF receptor signaling. (H and I) ARG1+ cells quantified by FACS were from YARG BMMs pretreated with DMSO, the JAK1/2 inhibitor (JAK1/2i) ruxolitinib, the STAT3 inhibitor C188-9, the STAT5 inhibitor CAS 285986-31-4, the ERK1/2 inhibitor ulixertinib, the p38 inhibitor SB203580, or the MEK inhibitor trametinib for 1 hour, followed by treatment with BO1 tumor cell CM for 24 hours (n = 2–5). Data are shown as the mean ± SEM. Two-tailed, unpaired Student’s t test with Welch’s correction.
Figure 6
Figure 6. Tumor cell–derived, GM-CSF–induced myeloid cell ARG1 expression requires cAMP signaling.
(A) Working model illustrating that GPCR-associated subunits Gs and Gi regulate cAMP levels. (B) BMMs (5 × 10⁵) from ARG1-YFP mice were seeded in a 6-well plate overnight. BMMs were pretreated with PTX for 2 hours before addition of tumor cell CM. (C and D) Forskolin (Fors) was added to the BMMs at the same time as the indicated treatments. (E and F) Inhibitors were added 1 hour before CM or 2 ng/mL GM-CSF plus 20 mM LA (CSF2/LA) treatment. All BMMs were treated for 24 hours with CM or CSF2/LA before FACS analysis. In BF, data are representative of 3 independent experiments. (G) Working model showing that GM-CSF (CSF2) and cAMP signaling combine to induce myeloid cell ARG1 expression.
Figure 7
Figure 7. Breast tumor–derived GM-CSF promotes tumor growth through the modulation of host immune cells.
(A) 4T1-WT (vector control) or 4T1-CSF2–KO breast tumor cells (1 × 10⁵) were injected into MFP tissue of 8-week-old female BALB/C mice (n = 7–8). (B) BO1-WT (vector control) or BO1-CSF2–KO breast tumor cells (1 × 10⁵) were injected into MFP tissue of 8-week-old female C57BL/6J mice (n = 9–11). (C) BO1-GFP-Luc breast tumor cells (1 × 10⁵) were mixed with Matrigel plus an isotype antibody (control) or anti-CSF2 antibody before injection into MFP tissue of 8-week-old female C57BL/6J mice (n = 9). (DF) The same experiments in AC were performed in NSG mice (n = 4–8). (G) The same experiment in B was performed in Arg1fl/fl LySM-Cre+/– mice (n = 8–10). For all of the above experiments, tumor growth was measured by digital calipers. On day 24, MFP tumors were dissected and weighed. (HJ) Single-cell suspensions from day-10 BO1-WT or BO1-CSF2–KO whole-tumor tissue (C57BL/6J mice) were analyzed by FACS. TIM and T cell populations are shown (n = 7). Gran, granulocytes; Mono, monocytes; MoDC, monocyte-derived DCs; Tex, exhausted T cells. Data are shown as the mean ± SEM. *P < 0.05, **P < 0.01, and ***P < 0.001, by 2-way, repeated-measures ANOVA or 2-tailed, unpaired Student’s t test with Welch’s correction between groups for column data.
Figure 8
Figure 8. Disruption of tumor cell–produced GM-CSF enhances breast cancer immune therapy.
(A) BO1 cells (GFP+) were cocultured with BO1-OVA cells (GFP+ mCherry+) at a 1:1 ratio, and then OT-1 T cells were added for 16 hours and analyzed by FACS. (B) B16F10-OVA cells (1 × 10⁶) were subcutaneously injected into C57BL/6J mice. On day 5, one group of mice was treated with 5 × 10⁶ in vitro–expanded OT-1 T cells via intravenous injection. Tumor size was measured by digital calipers. (C and D) PyMT-BO1-WT-OVA or PyMT-BO1-CSF2–KO-OVA breast tumor cells (1 × 10⁵) were inoculated with PBS and injected into MFP tissue. On day 7, OT-1 T cells (5 × 10⁶) were intravenously injected. (E) PyMT-BO1-WT-OVA or PyMT-BO1-CSF2–KO-OVA breast tumor cells (1 × 10⁵) were intracardially injected into 6-week-old female C57BL/6J mice (n = 5–6). On day 5, OT-1 T cells (5 × 10⁶) were intravenously injected. Representative BLI images on day 12 are shown. (F) PyMT-BO1-OVA breast tumor cells (1 × 10⁵) were intracardially injected into 6-week-old female C57BL/6J mice (n = 5–6). On days 5, 7, and 11, anti-CSF2 antibodies were intravenously injected into mice in the antibody treatment groups. On day 5, OT-1 T cells (5 × 10⁶) were intravenously injected. Representative BLI images on day 12 are shown. (G) PyMT-BO1-V2 breast tumor cells (1 × 10⁵) were injected into MFP tissue of 8-week-old female C57BL/6J mice. On days 6, 8, and 10, anti–PD-1 and anti-CTLA4 antibodies (2.5 mg/kg) were intravenously injected. (H) Primary tumor mastectomies were performed when the tumor size reached 1200 mm3. The primary tumor weight after mastectomy is shown. (I) Four weeks after primary tumor mastectomy, distant metastasis was detected by BLI. The rate of metastatic events and representative BLI images are shown. (JL) The same experiments were performed using PyMT-BO1-CSF2KO breast tumor cells. Data are shown as the mean ± SEM. *P < 0.05, **P < 0.01, ***P < 0.001, and ****P < 0.0001, by 2-way ANOVA.

References

    1. Adams S, et al. Current landscape of immunotherapy in breast cancer: a review. JAMA Oncol. 2019;5(8):1205–1214. doi: 10.1001/jamaoncol.2018.7147. - DOI - PMC - PubMed
    1. DeNardo DG, Ruffell B. Macrophages as regulators of tumour immunity and immunotherapy. Nat Rev Immunol. 2019;19(6):369–382. doi: 10.1038/s41577-019-0127-6. - DOI - PMC - PubMed
    1. Anderson KG, et al. Obstacles posed by the tumor microenvironment to T cell activity: a case for synergistic therapies. Cancer Cell. 2017;31(3):311–325. doi: 10.1016/j.ccell.2017.02.008. - DOI - PMC - PubMed
    1. Corredor G, et al. Spatial architecture and arrangement of tumor-infiltrating lymphocytes for predicting likelihood of recurrence in early-stage non-small cell lung cancer. Clin Cancer Res. 2019;25(5):1526–1534. doi: 10.1158/1078-0432.CCR-18-2013. - DOI - PMC - PubMed
    1. Fu Q, et al. Prognostic value of tumor-infiltrating lymphocytes in melanoma: a systematic review and meta-analysis. Oncoimmunology. 2019;8(7):1593806. - PMC - PubMed

Publication types