

doi: 10.1161/CIRCRESAHA.121.319828.
Epub 2021 Sep 15.
PDE1 Inhibition Modulates Cav1.2 Channel to Stimulate Cardiomyocyte Contraction
Affiliations
- PMID: 34521216
- PMCID: PMC8553000
- DOI: 10.1161/CIRCRESAHA.121.319828
Item in Clipboard
PDE1 Inhibition Modulates Cav1.2 Channel to Stimulate Cardiomyocyte Contraction
Circ Res.
.
Abstract
[Figure: see text].
Keywords: excitation contraction coupling; myocardial contraction; nucleotide; pharmacology; phosphorylation.
Figures
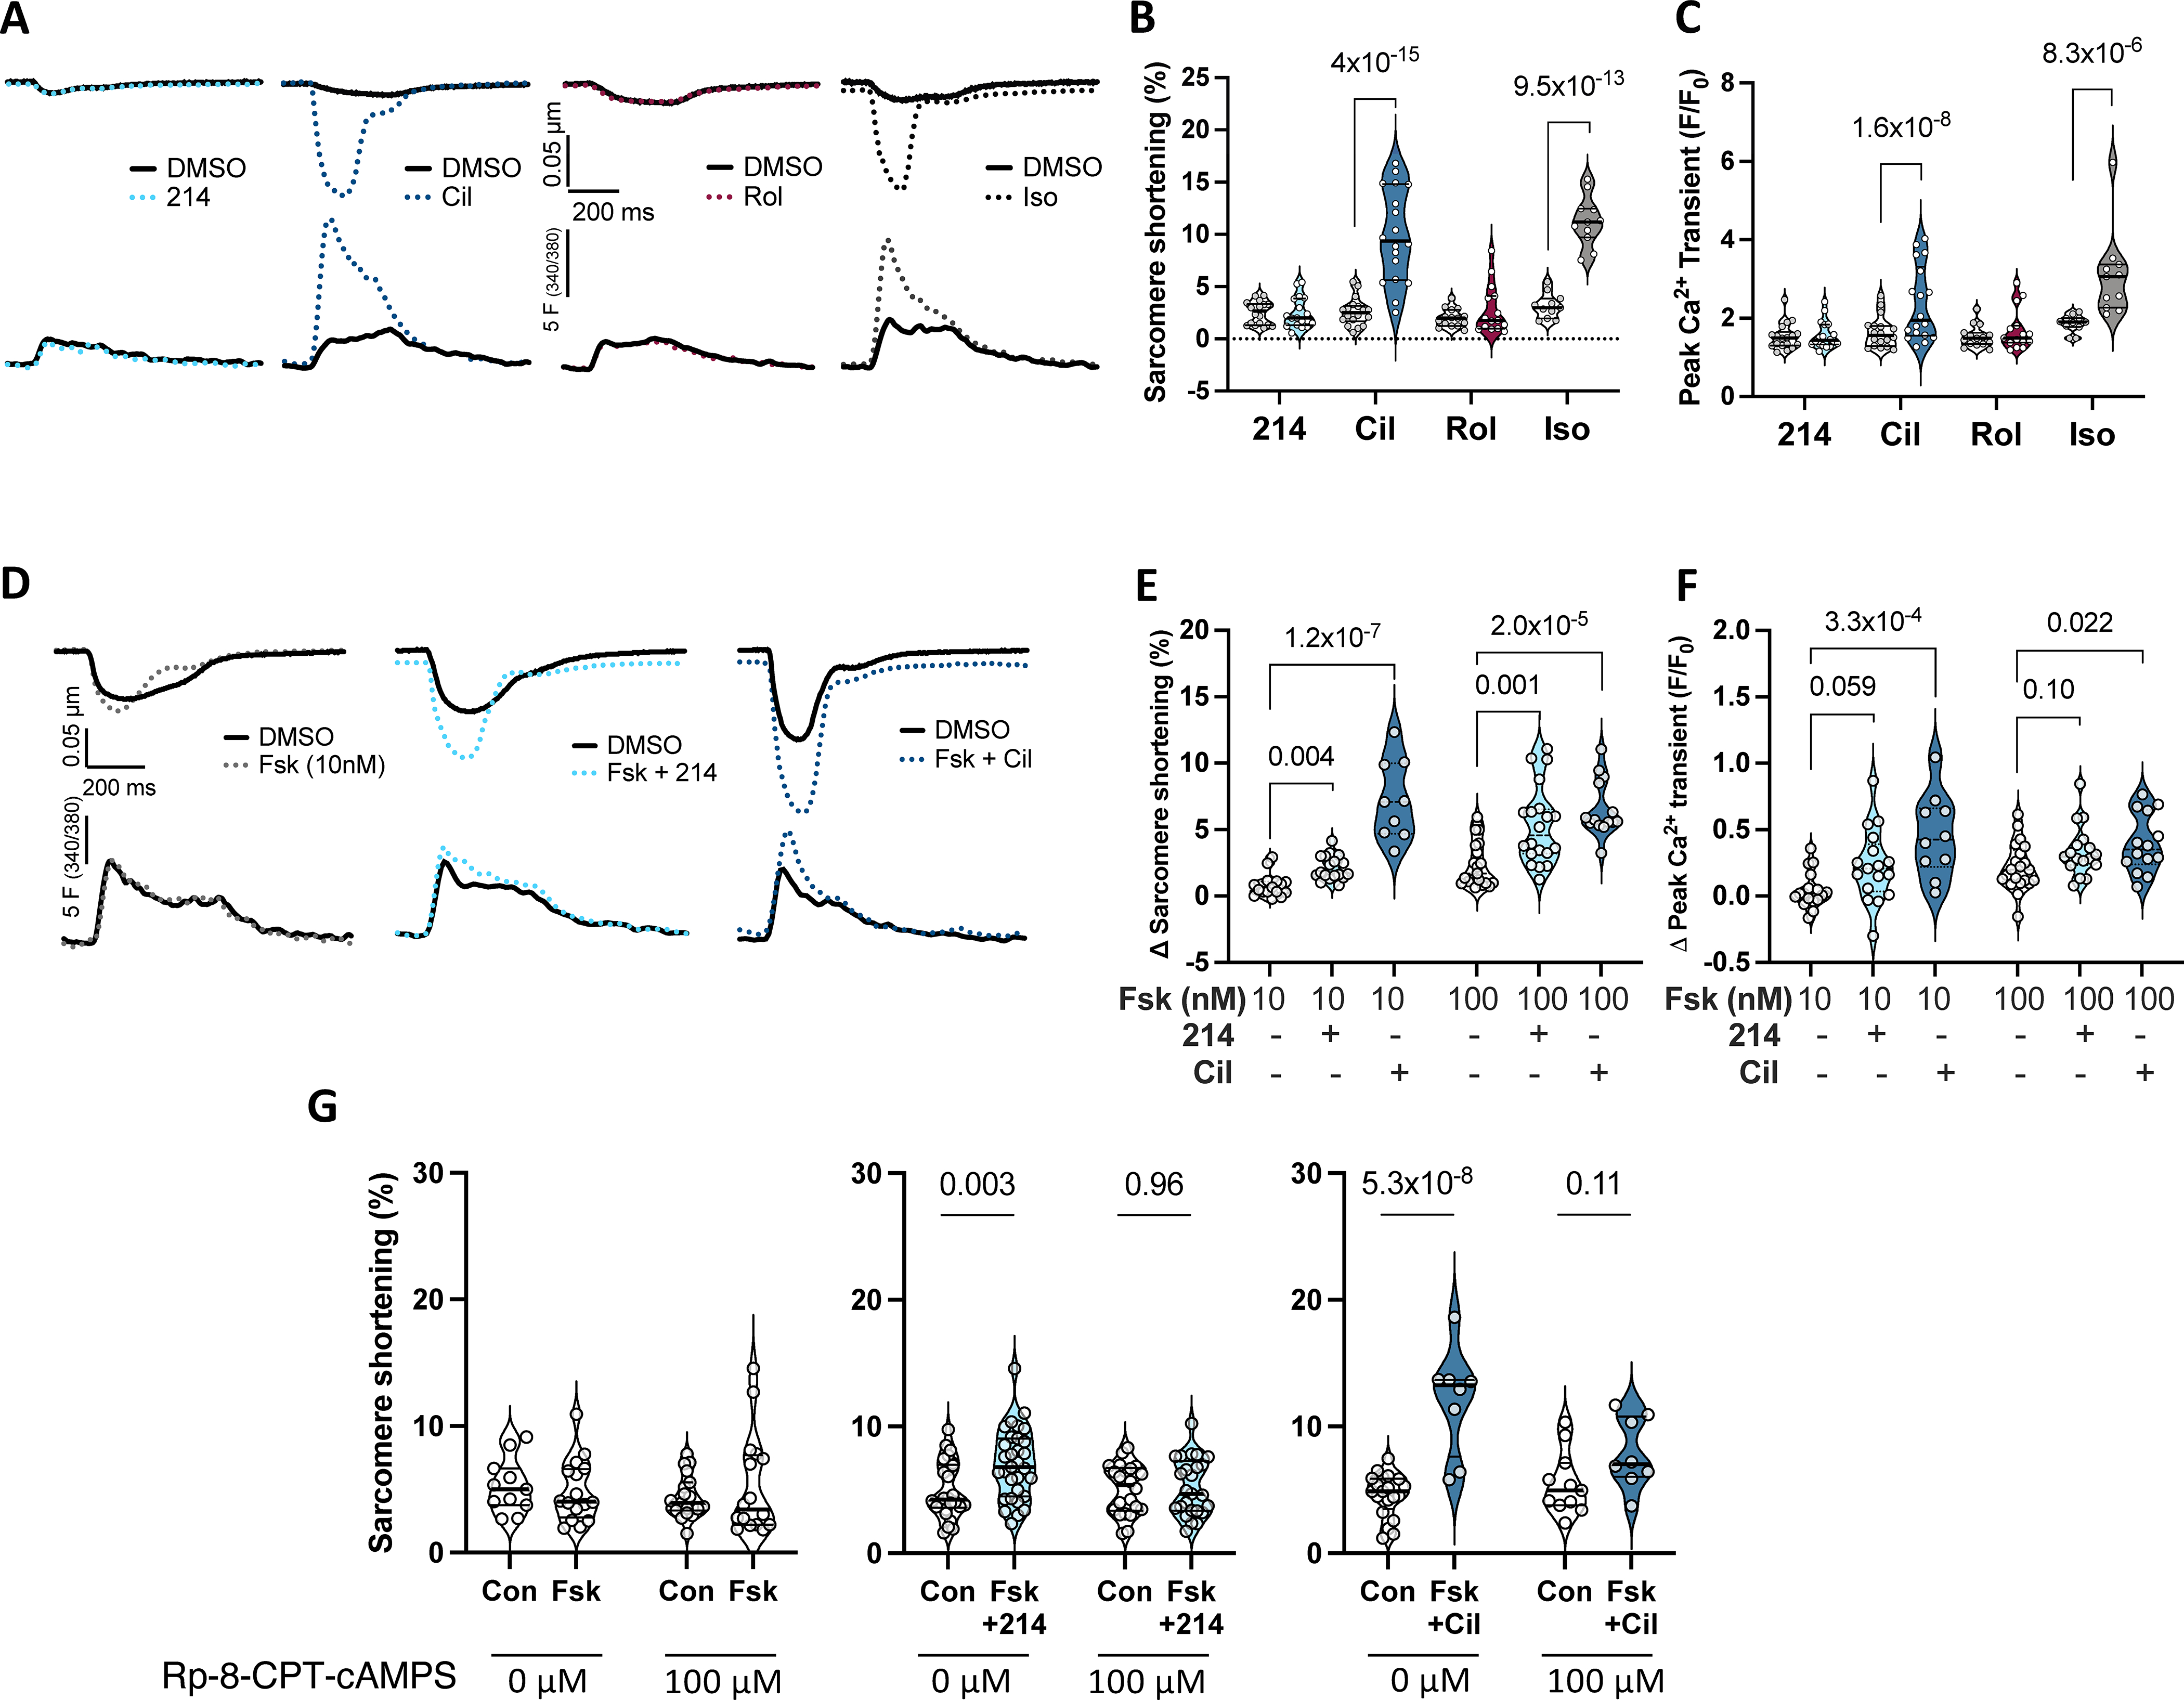
A) Representative sarcomere shortening (upper) and Ca2+ transients (lower) from cardiomyocytes treated with a selective inhibitor to PDE1 (214; 1μM), PDE3 (cilostamide - Cil; 1μM), PDE4 (rolipram - Rol; 10μM), or isoproterenol (Iso; 1nM) each in 0.1% DMSO versus DMSO alone. B, C) Summary data pairing before and after drug (clear and shaded background, respectively); repeated measures 2-way ANOVA and Sidak’s multiple comparison test (MCT) within each drug (P values shown). D) Impact of PDE1 vs PDE3 inhibition in presence of 10nM Fsk versus Fsk alone. E, F) Group data showing change from baseline for this experiment using either 10 or 100 nM Fsk; Kruskal-Wallis test within each Fsk dose; Dunn’s MCT P-values shown. G) Change in sarcomere shortening in absence or presence of PKA inhibitor (Rp-8-CPT-cAMPS, 100μM) in same treatment groups shown in panels D-F. Ordinary 2-way ANOVA with Sidak’s MCT for effect of PDE inhibitor ±PKA inhibitor. Interaction of PDEi and PKA inhibitor effects were P=0.047 and P=0.0035 for Fsk+214 and Fsk+Cil, respectively.
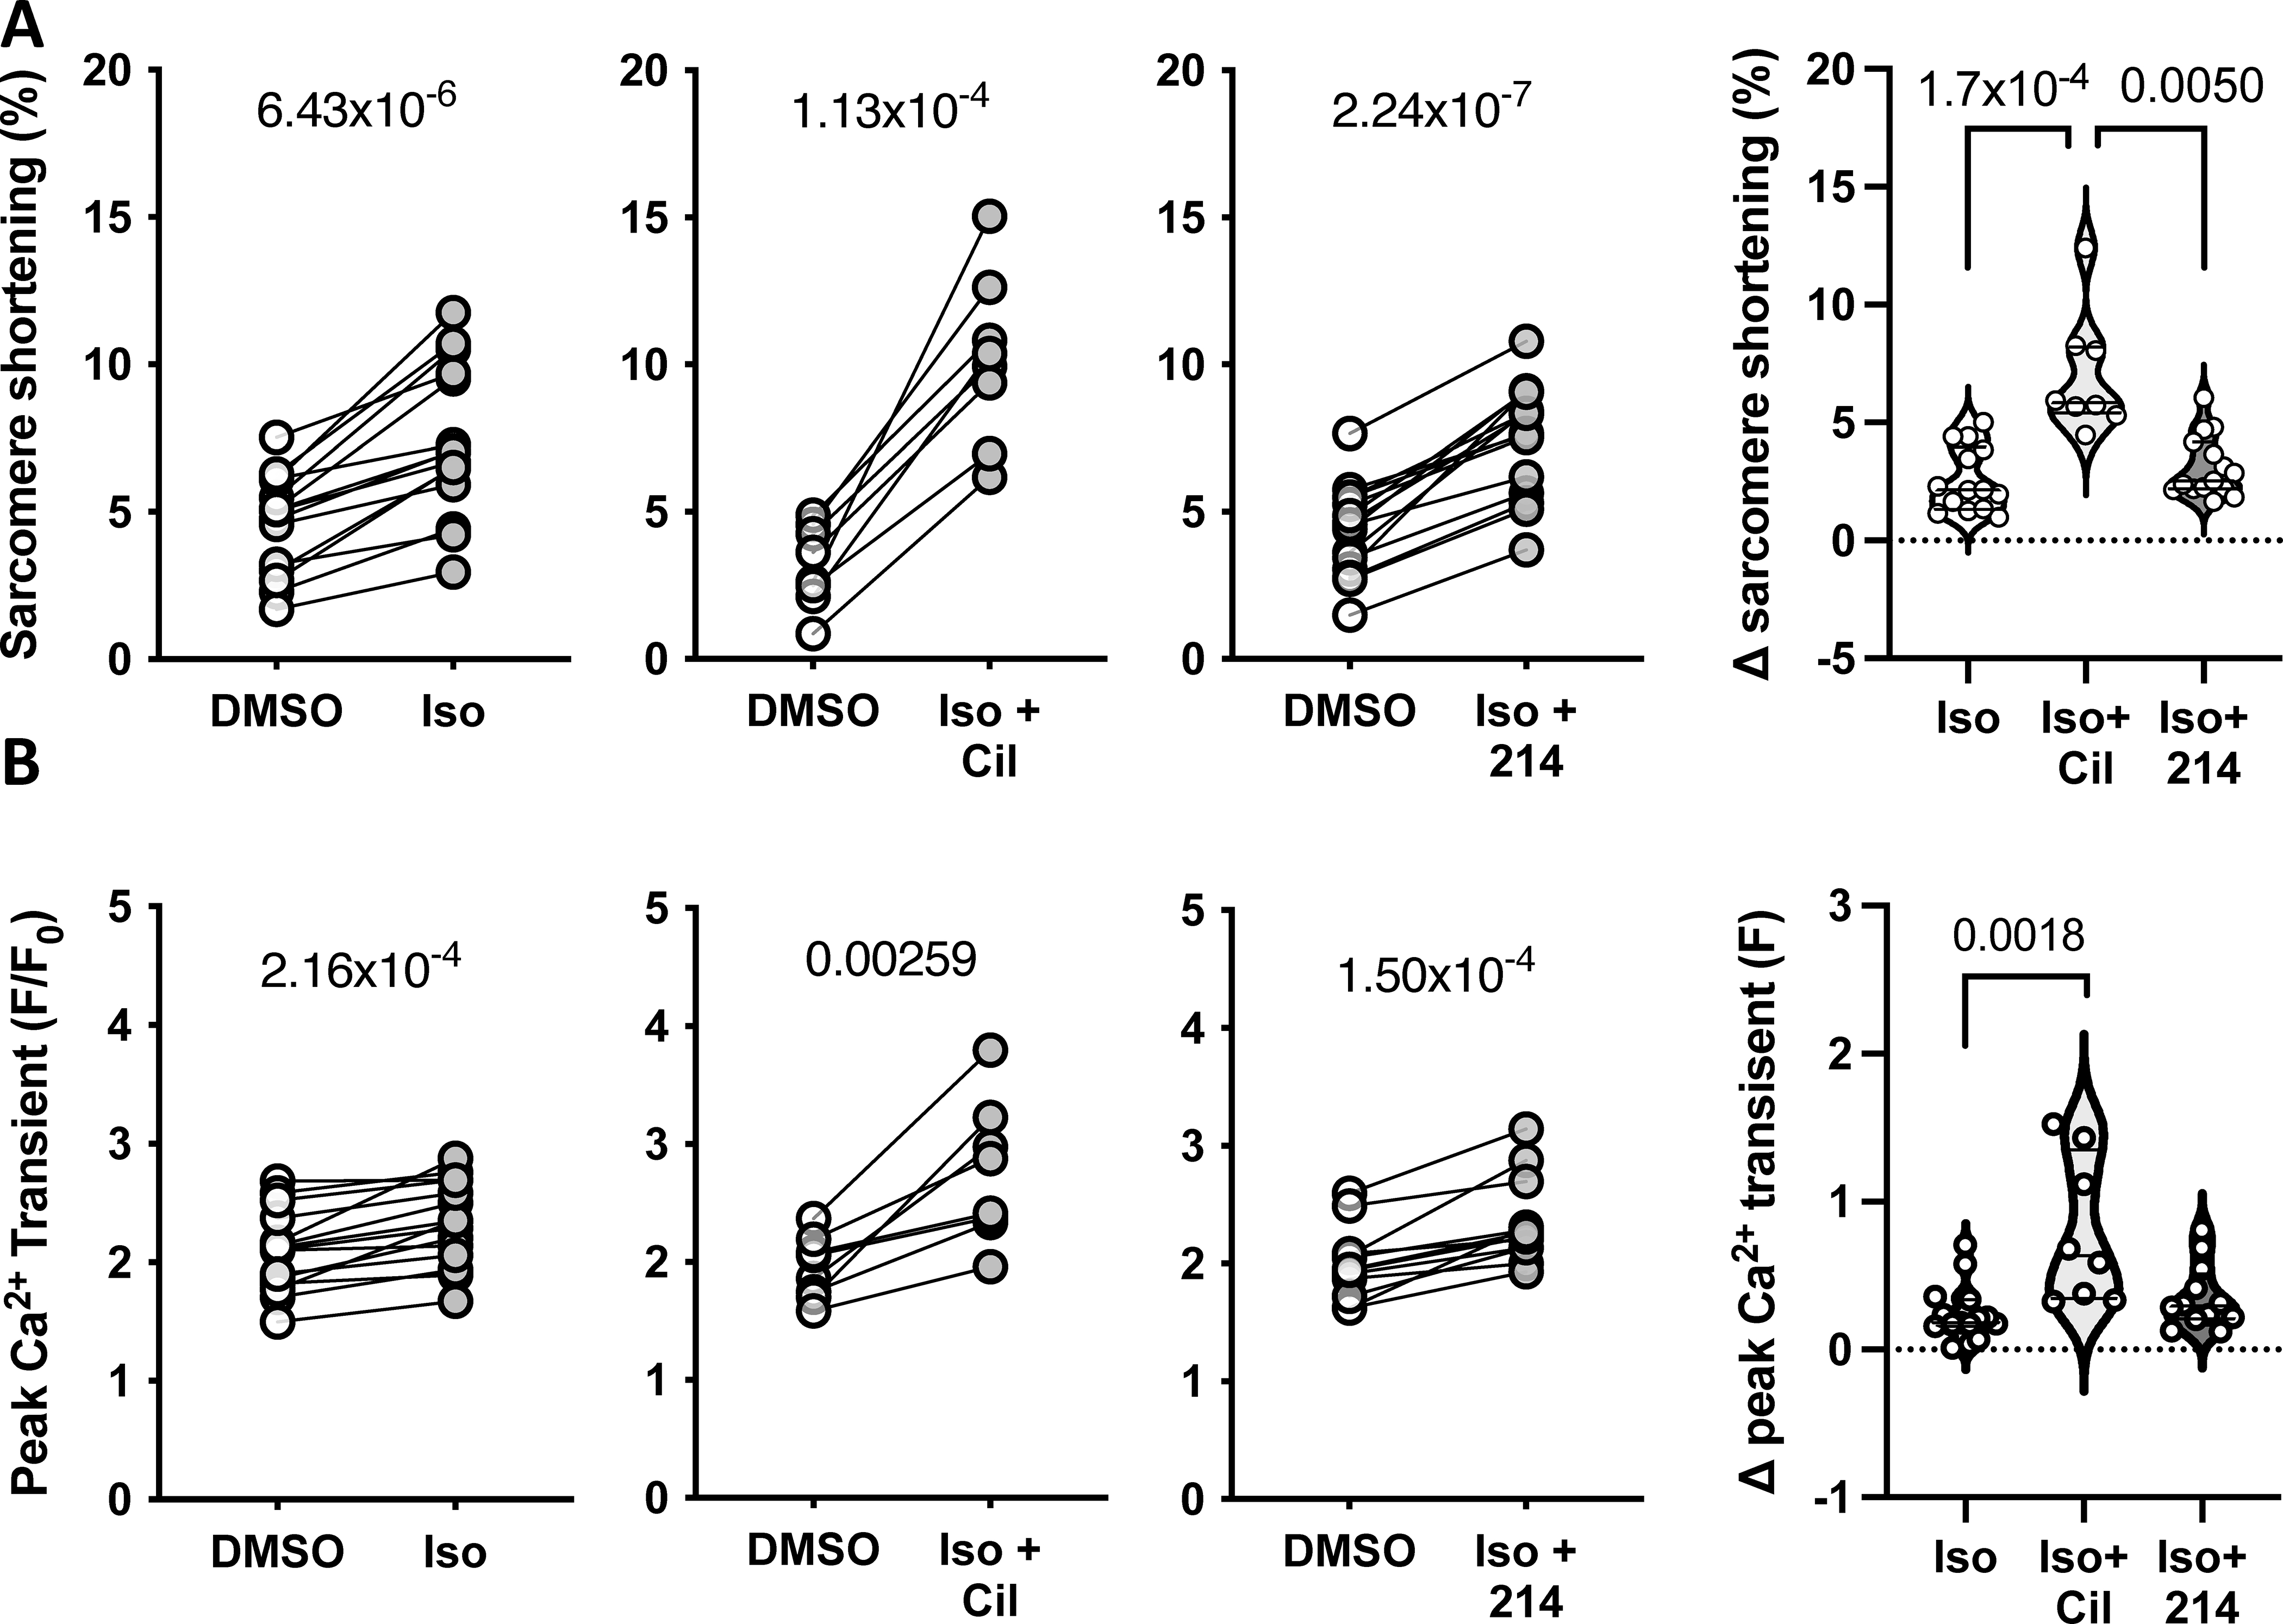
Guinea pig myocytes were treated with sub-maximal isoproterenol (Iso; 0.025nM) alone, or with Cil or 214. Changes in the peak A) sarcomere shortening and B) Ca2+ transients are plotted, with p-values indicating paired Student’s t-test results. The change from baseline is plotted to the right; P values are for a Kruskal-Wallis test with Dunn’s MCT.
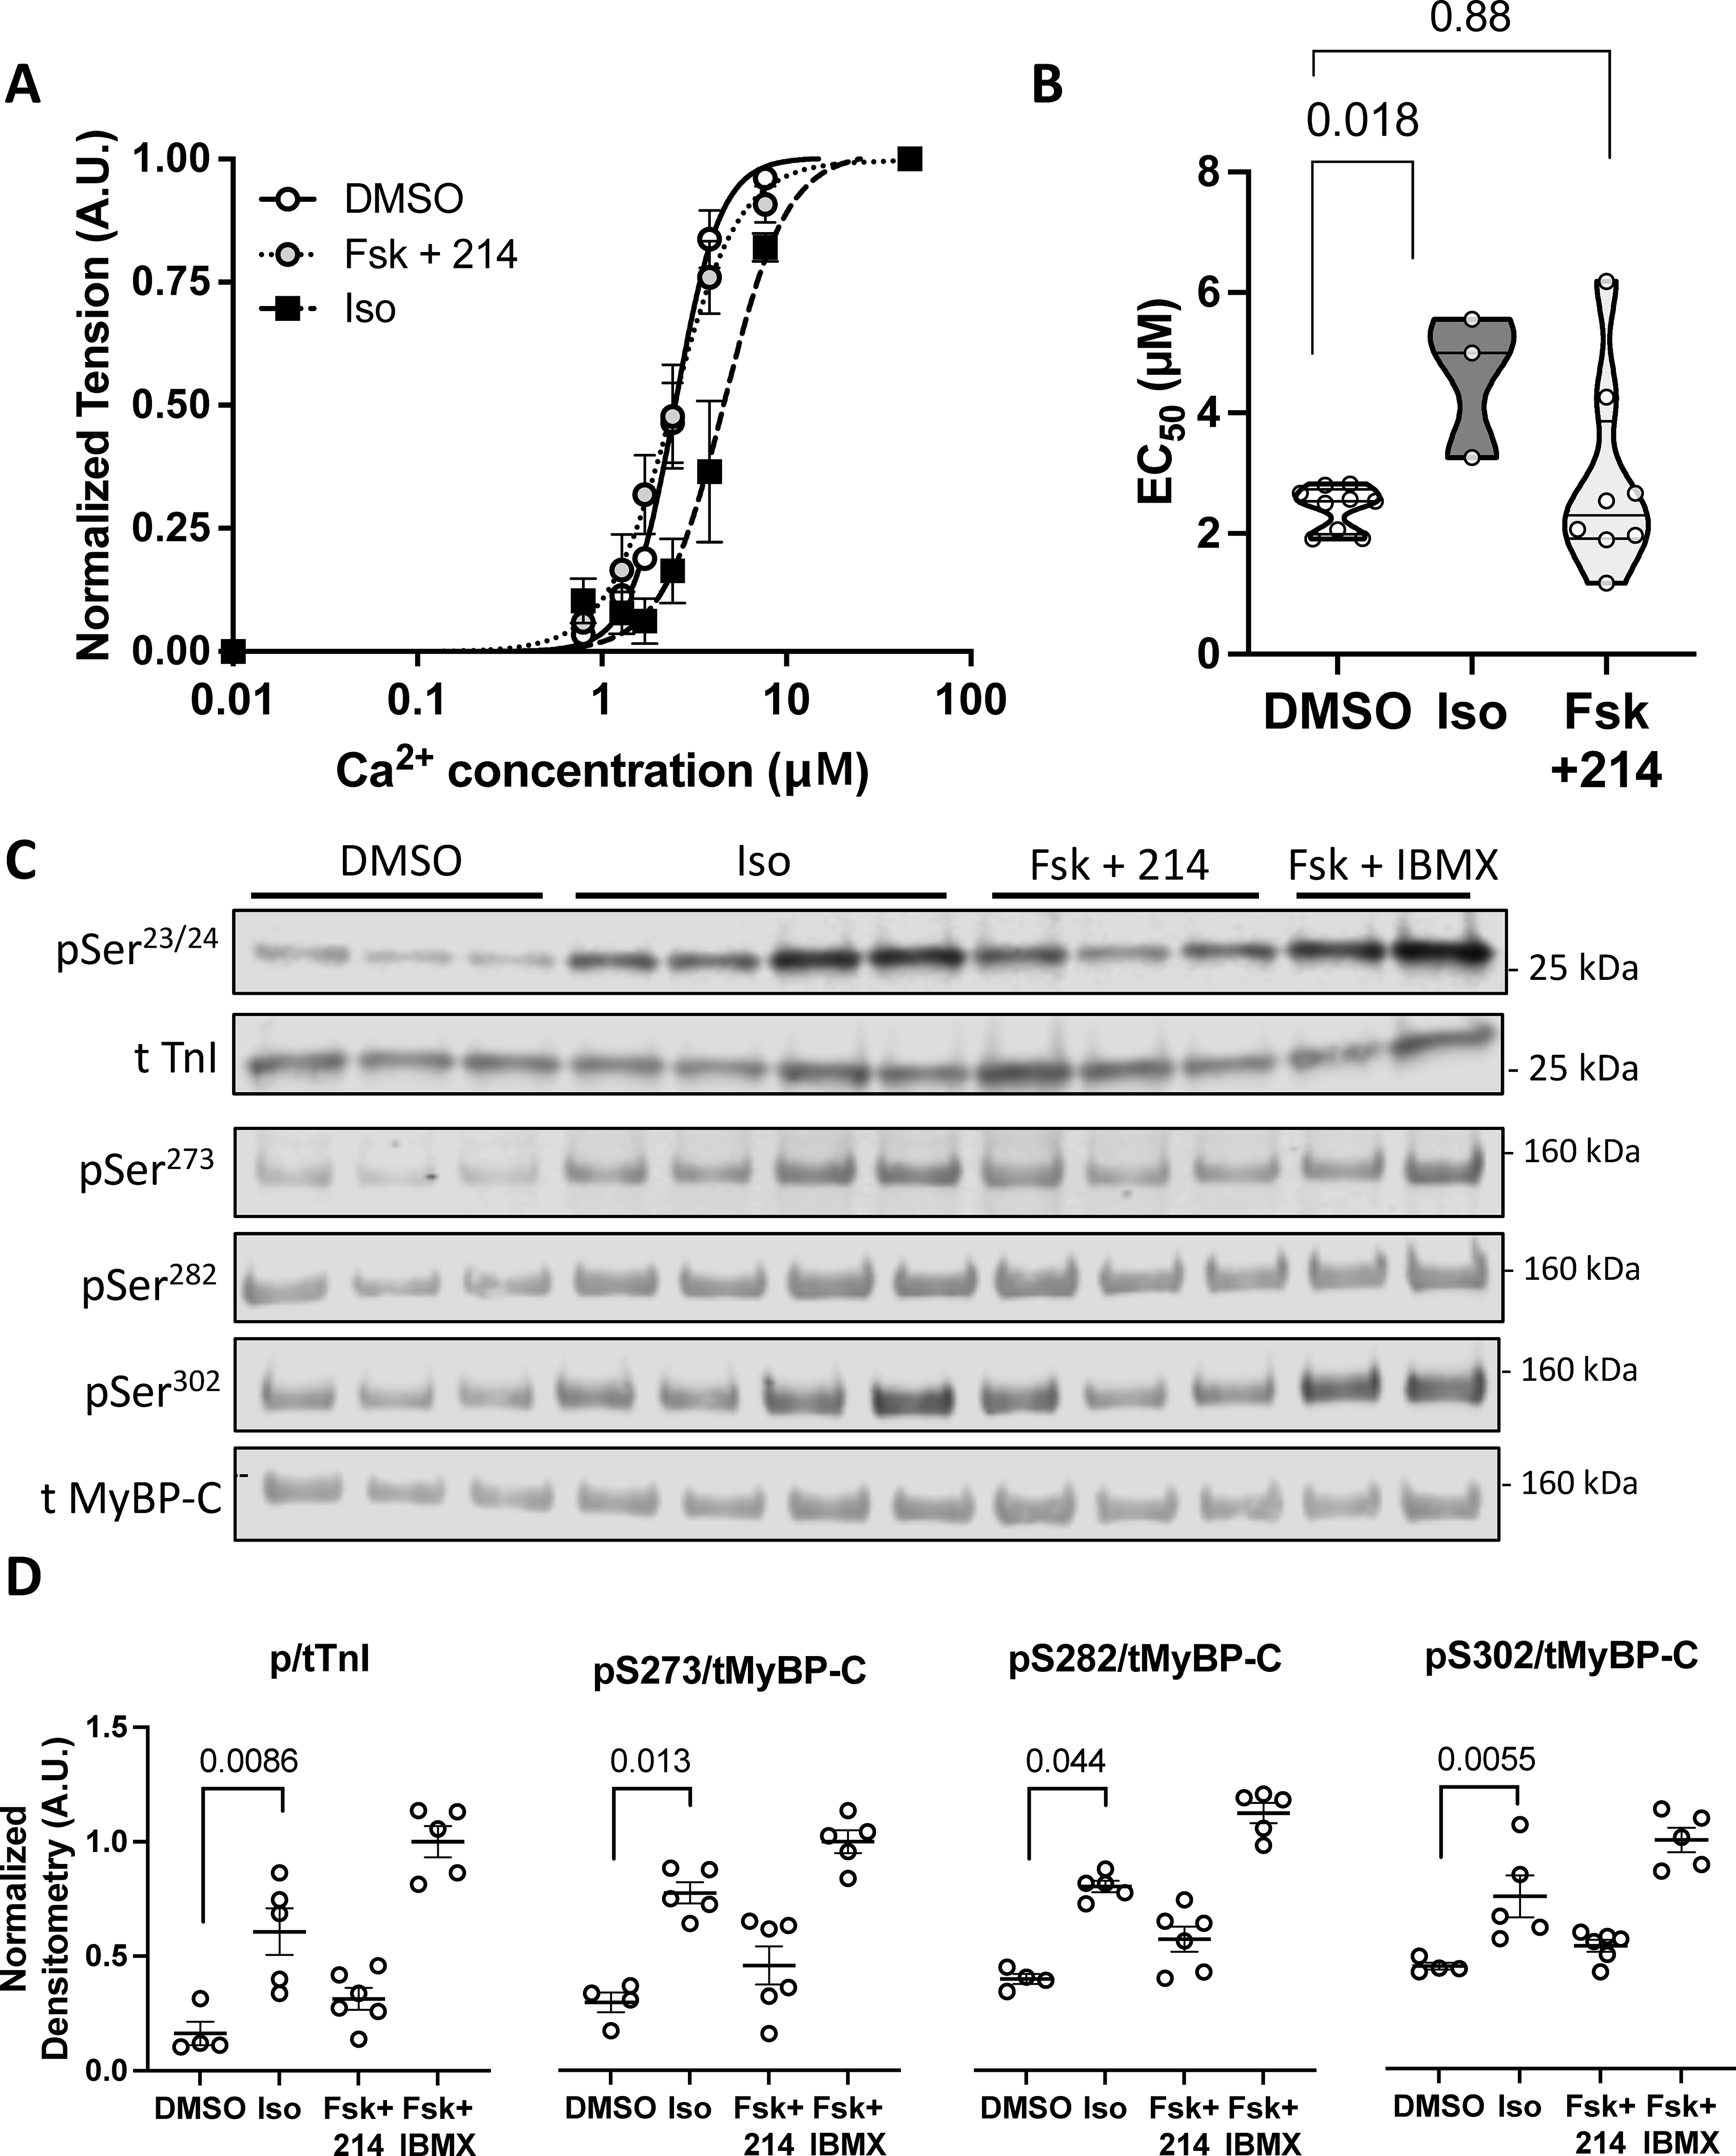
Guinea pig myocytes were treated with DMSO, Iso (50nM), or Fsk (10nM) + 214 (1μM) before being skinned. A) A normalized curve showing the myofilament force-pCa relationship; n=9, 9, 3. B) Summary EC50 (Ca2+ at 50% maximal activation) for each condition. P-values are Mann-Whitney U test with 2-comparison correction. C) Representative western blot of phosphorylated and total troponin I (TnI) at Ser23/24 or myosin binding protein-C (MyBP-C) at Ser273, Ser282 and Ser302 for myocytes treated as indicated. D) The phospho/total densitometry values as indicated were normalized to a maximal response from Fsk (25μM) + IBMX (100μM). Kruskal-Wallis test with Dunn’s MCT among DMSO, Iso and Fsk+214.
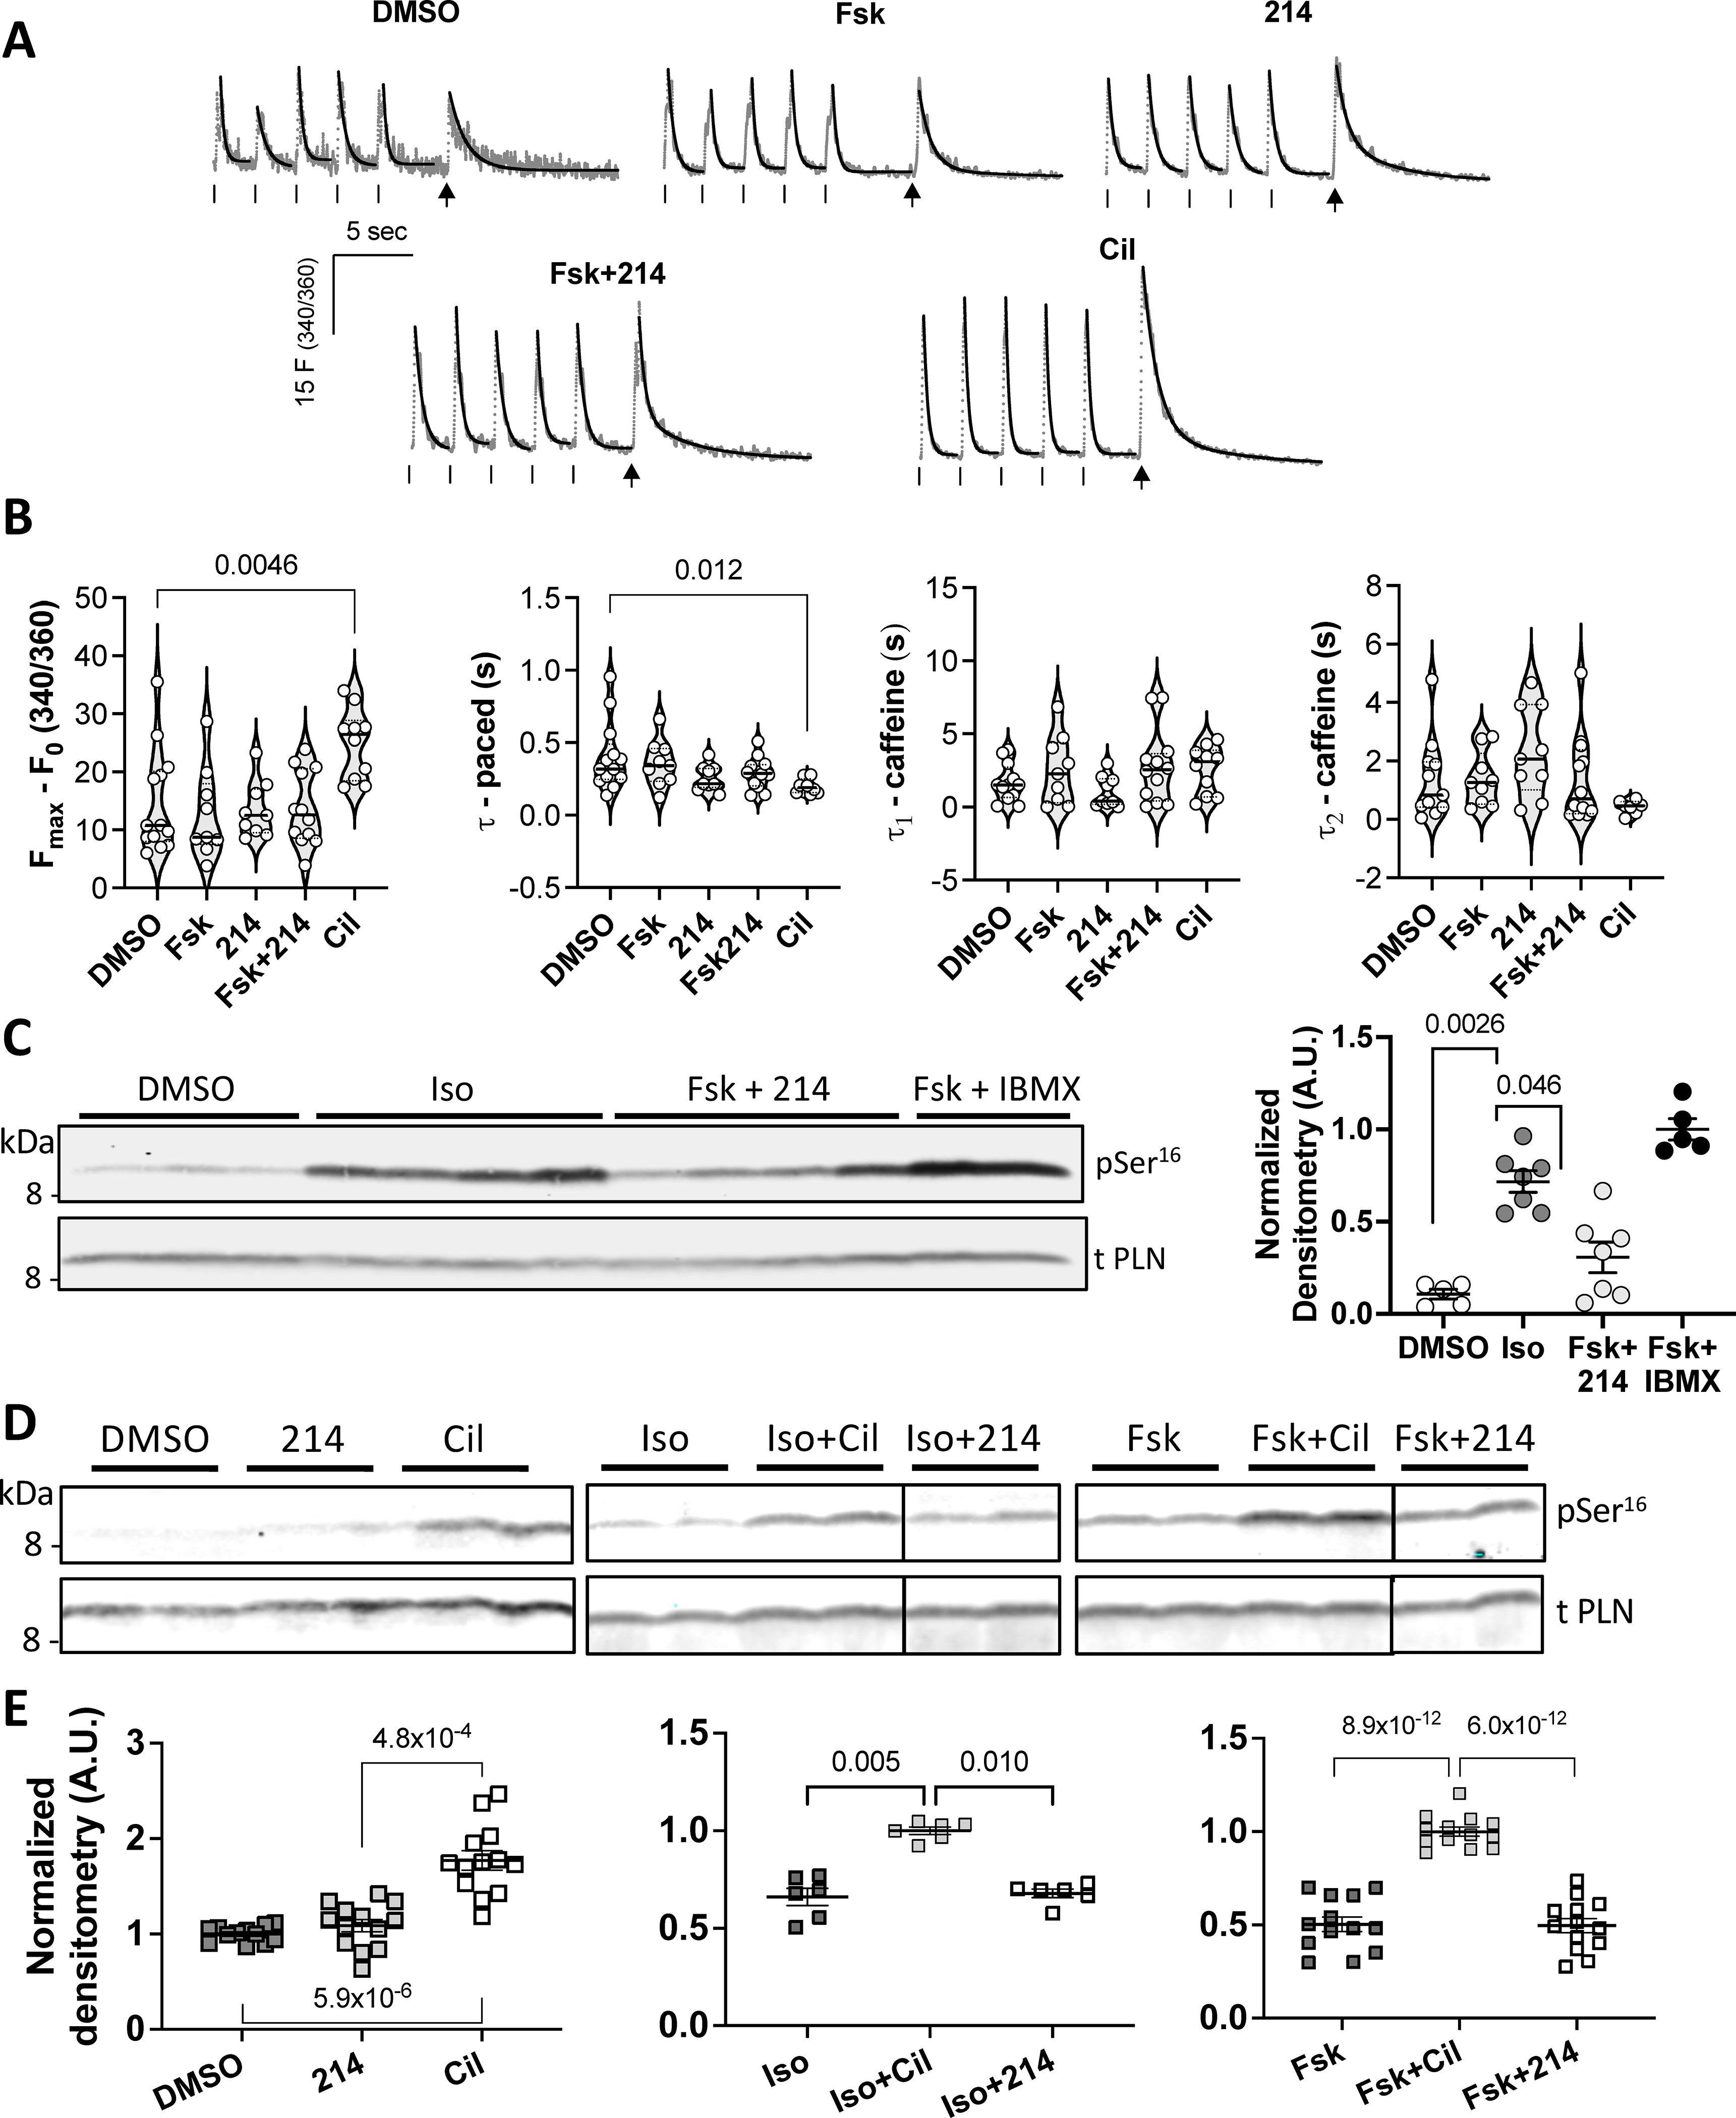
Guinea pig myocytes treated with: DMSO (vehicle), Fsk (10nM), 214 (1μM), Fsk+214 (1μM), or Cil (1μM), were paced. Then pacing was stopped and cells were exposed to a bolus of caffeine (10mM) to assess SR Ca2+ content. A) Representative Ca2+ traces are shown in grey with exponential decay fits overlaid in black. Ticks indicate pacing; arrows indicate caffeine spritz. B) Grouped average changes in the peak Ca2+ transients and tau values for systolic and caffeine transients are plotted; Kruskal-Wallis with Dunn’s MCT vs DMSO. C) Representative western blot of phosphorylated (Ser16) and total PLN for myocytes treated with Iso at near maximal dose (50nM), Fsk (10nM) + 214 (1μM) or Fsk + IBMX, with quantitation to the right (phospho/total PLN densitometry value normalized to that of Fsk+IBMX; Kruskal-Wallis with Dunn’s MCT among DMSO, Iso and Fsk+214). D) Western blots and E) corresponding quantitation showing change in Ser16 phospho/total PLN in response to PDE inhibition at baseline (left; normalized to DMSO) or in combination with: non-saturating dose of Iso (1nM; center; normalized to Iso+Cil) or Fsk (10nM; right; normalized to Fsk+Cil). Kruskal-Wallis with Dunn’s MCT vs normalized group for left and center; ordinary 1-way ANOVA with Bonferroni MCT vs normalized group for the right graph.
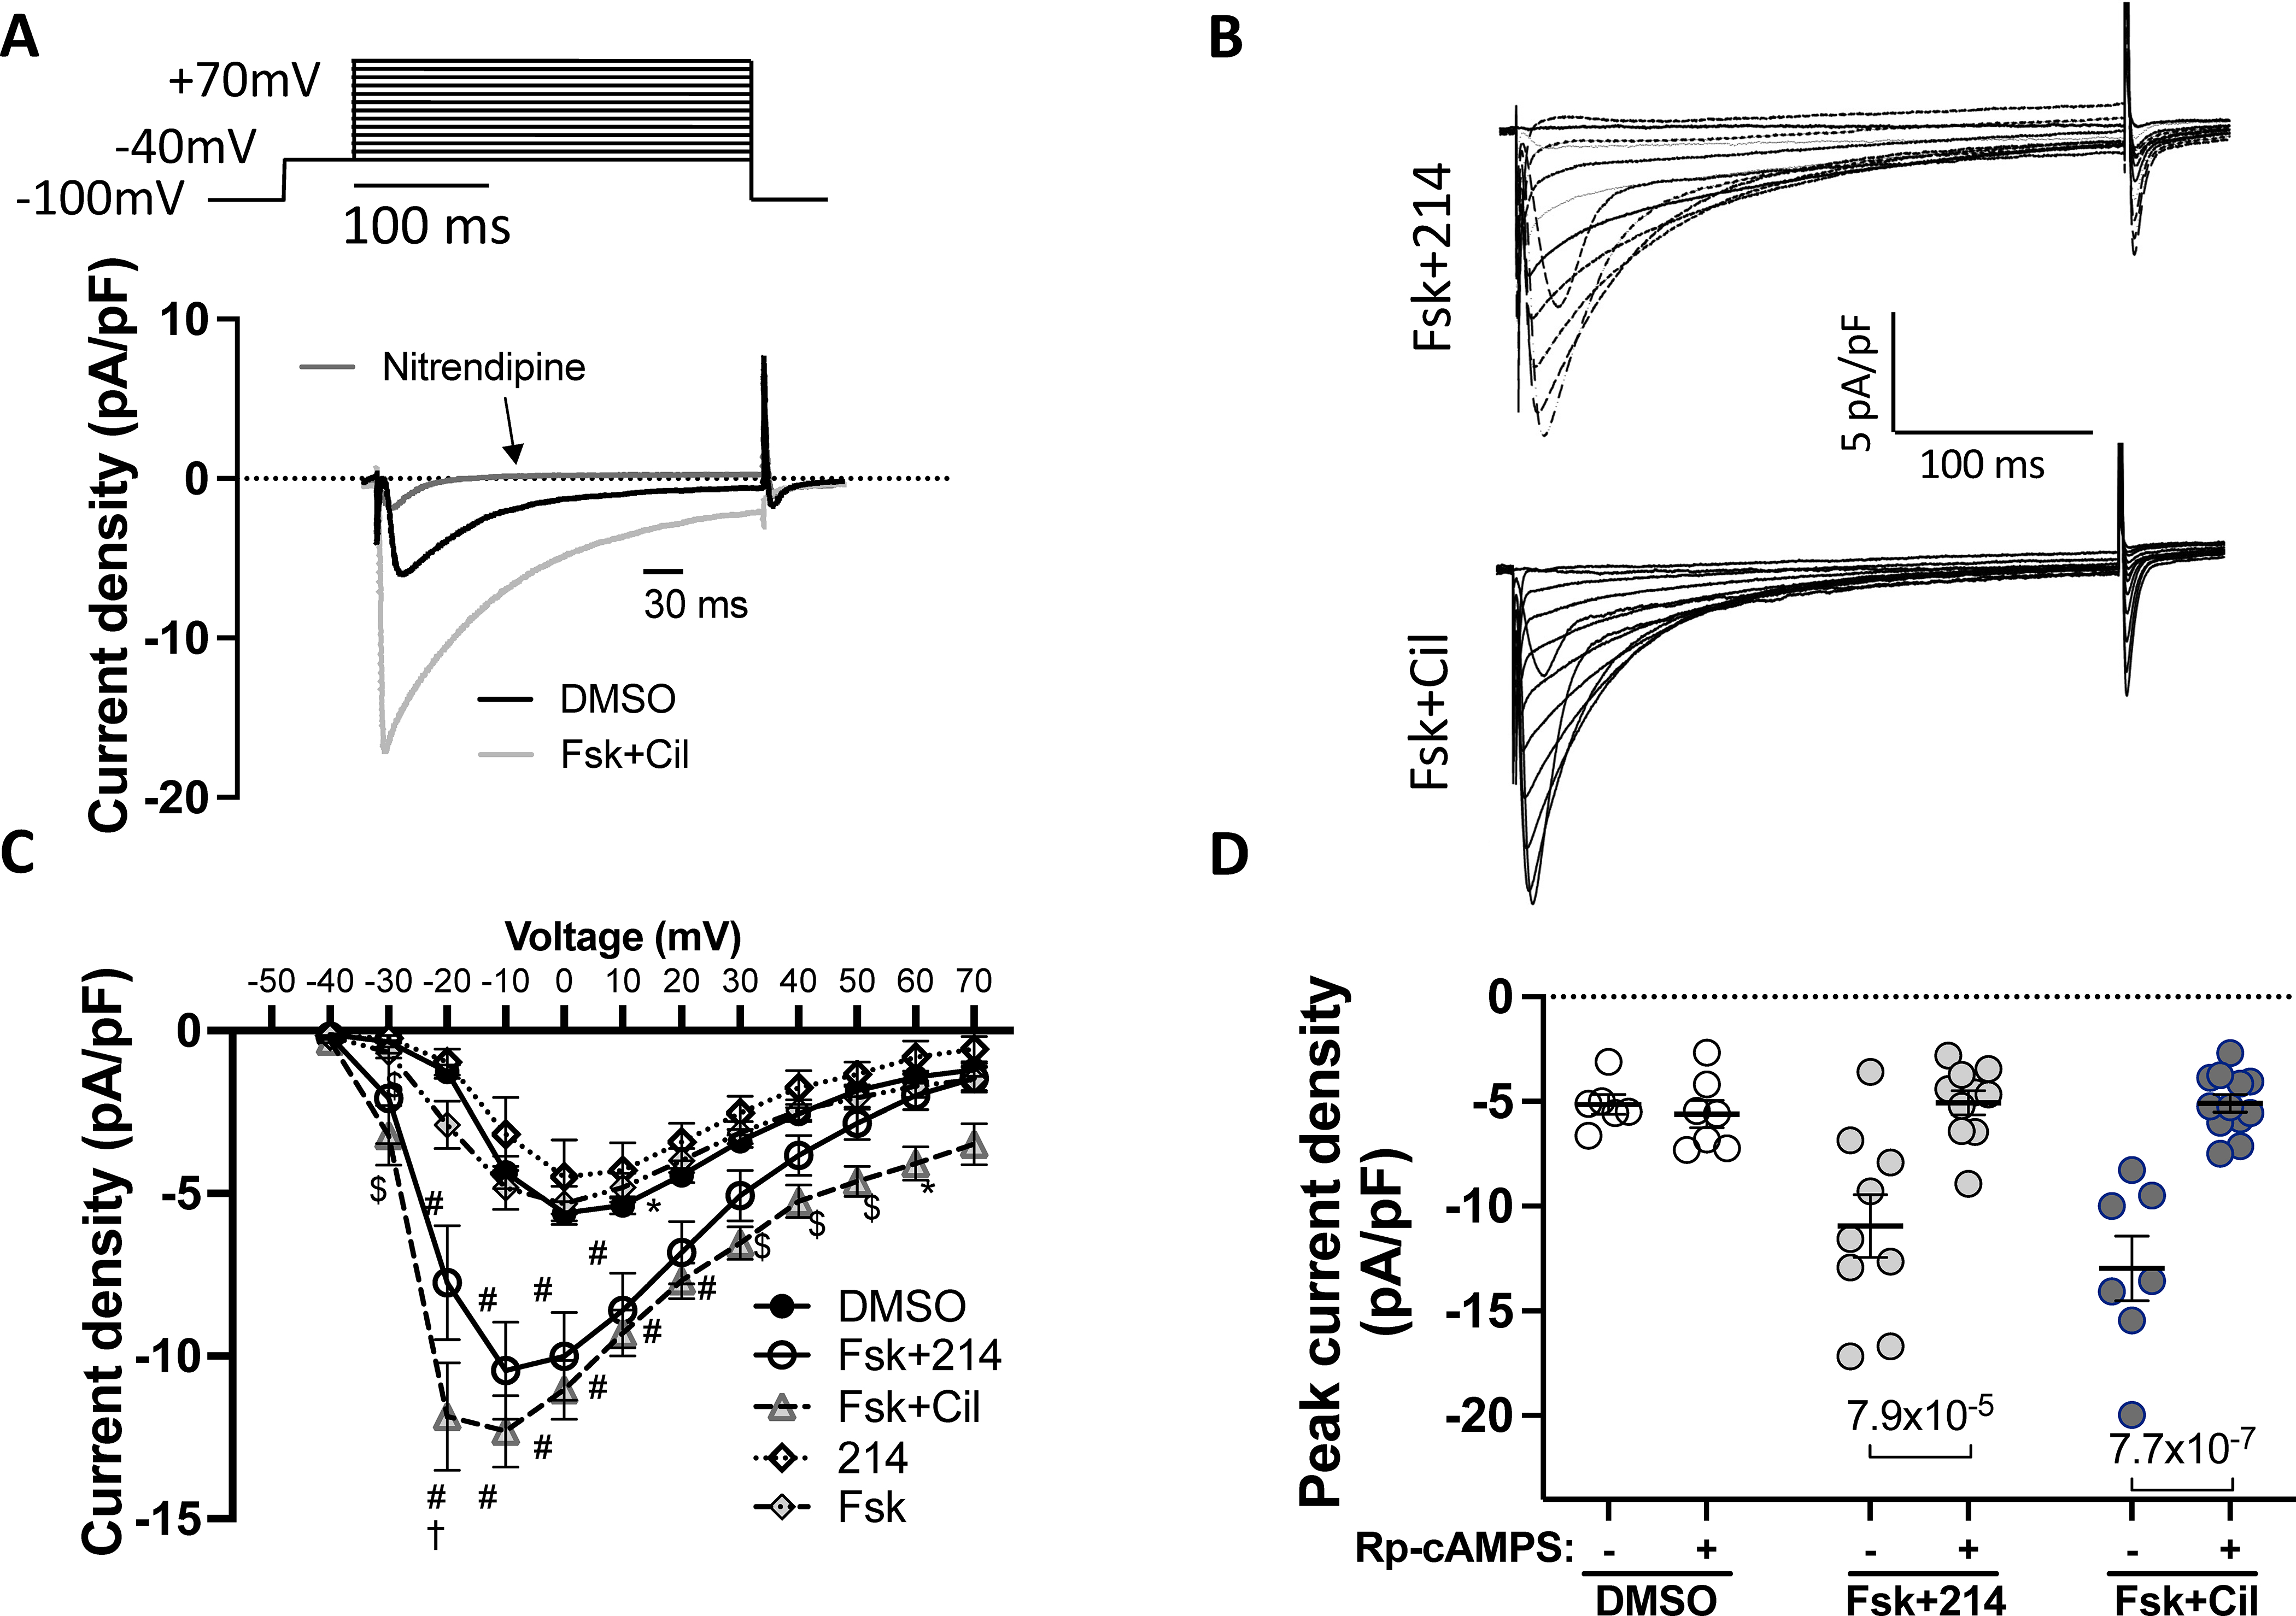
Cells were stimulated with the indicated drugs, and the inward current measured using the whole-cell voltage clamp protocol. Nitrendipine (10μM) was used to confirm Cav1.2 as the primary source of the current. A) The voltage-clamp protocol with representative trace showing change upon Fsk+Cil treatment and sensitivity to nitrendipine. B) Representative current-time traces for Fsk+214 and Fsk+Cil. C) Averaged peak current density versus membrane voltage. *p<0.05, $p<0.001, #p<0.0001 against DMSO; †p<0.0001 against Fsk+214, ordinary 2-way ANOVA with Tukey’s MCT comparing DMSO vs Fsk+214 vs Fsk+Cil; see Online Table I for exact p values. D) The peak current density in cells stimulated with indicated drugs before or 8–10 minutes after dialysis with PKA inhibitor - Rp-cAMPS (100μM); ordinary 2-way ANOVA with Sidak’s MCT.
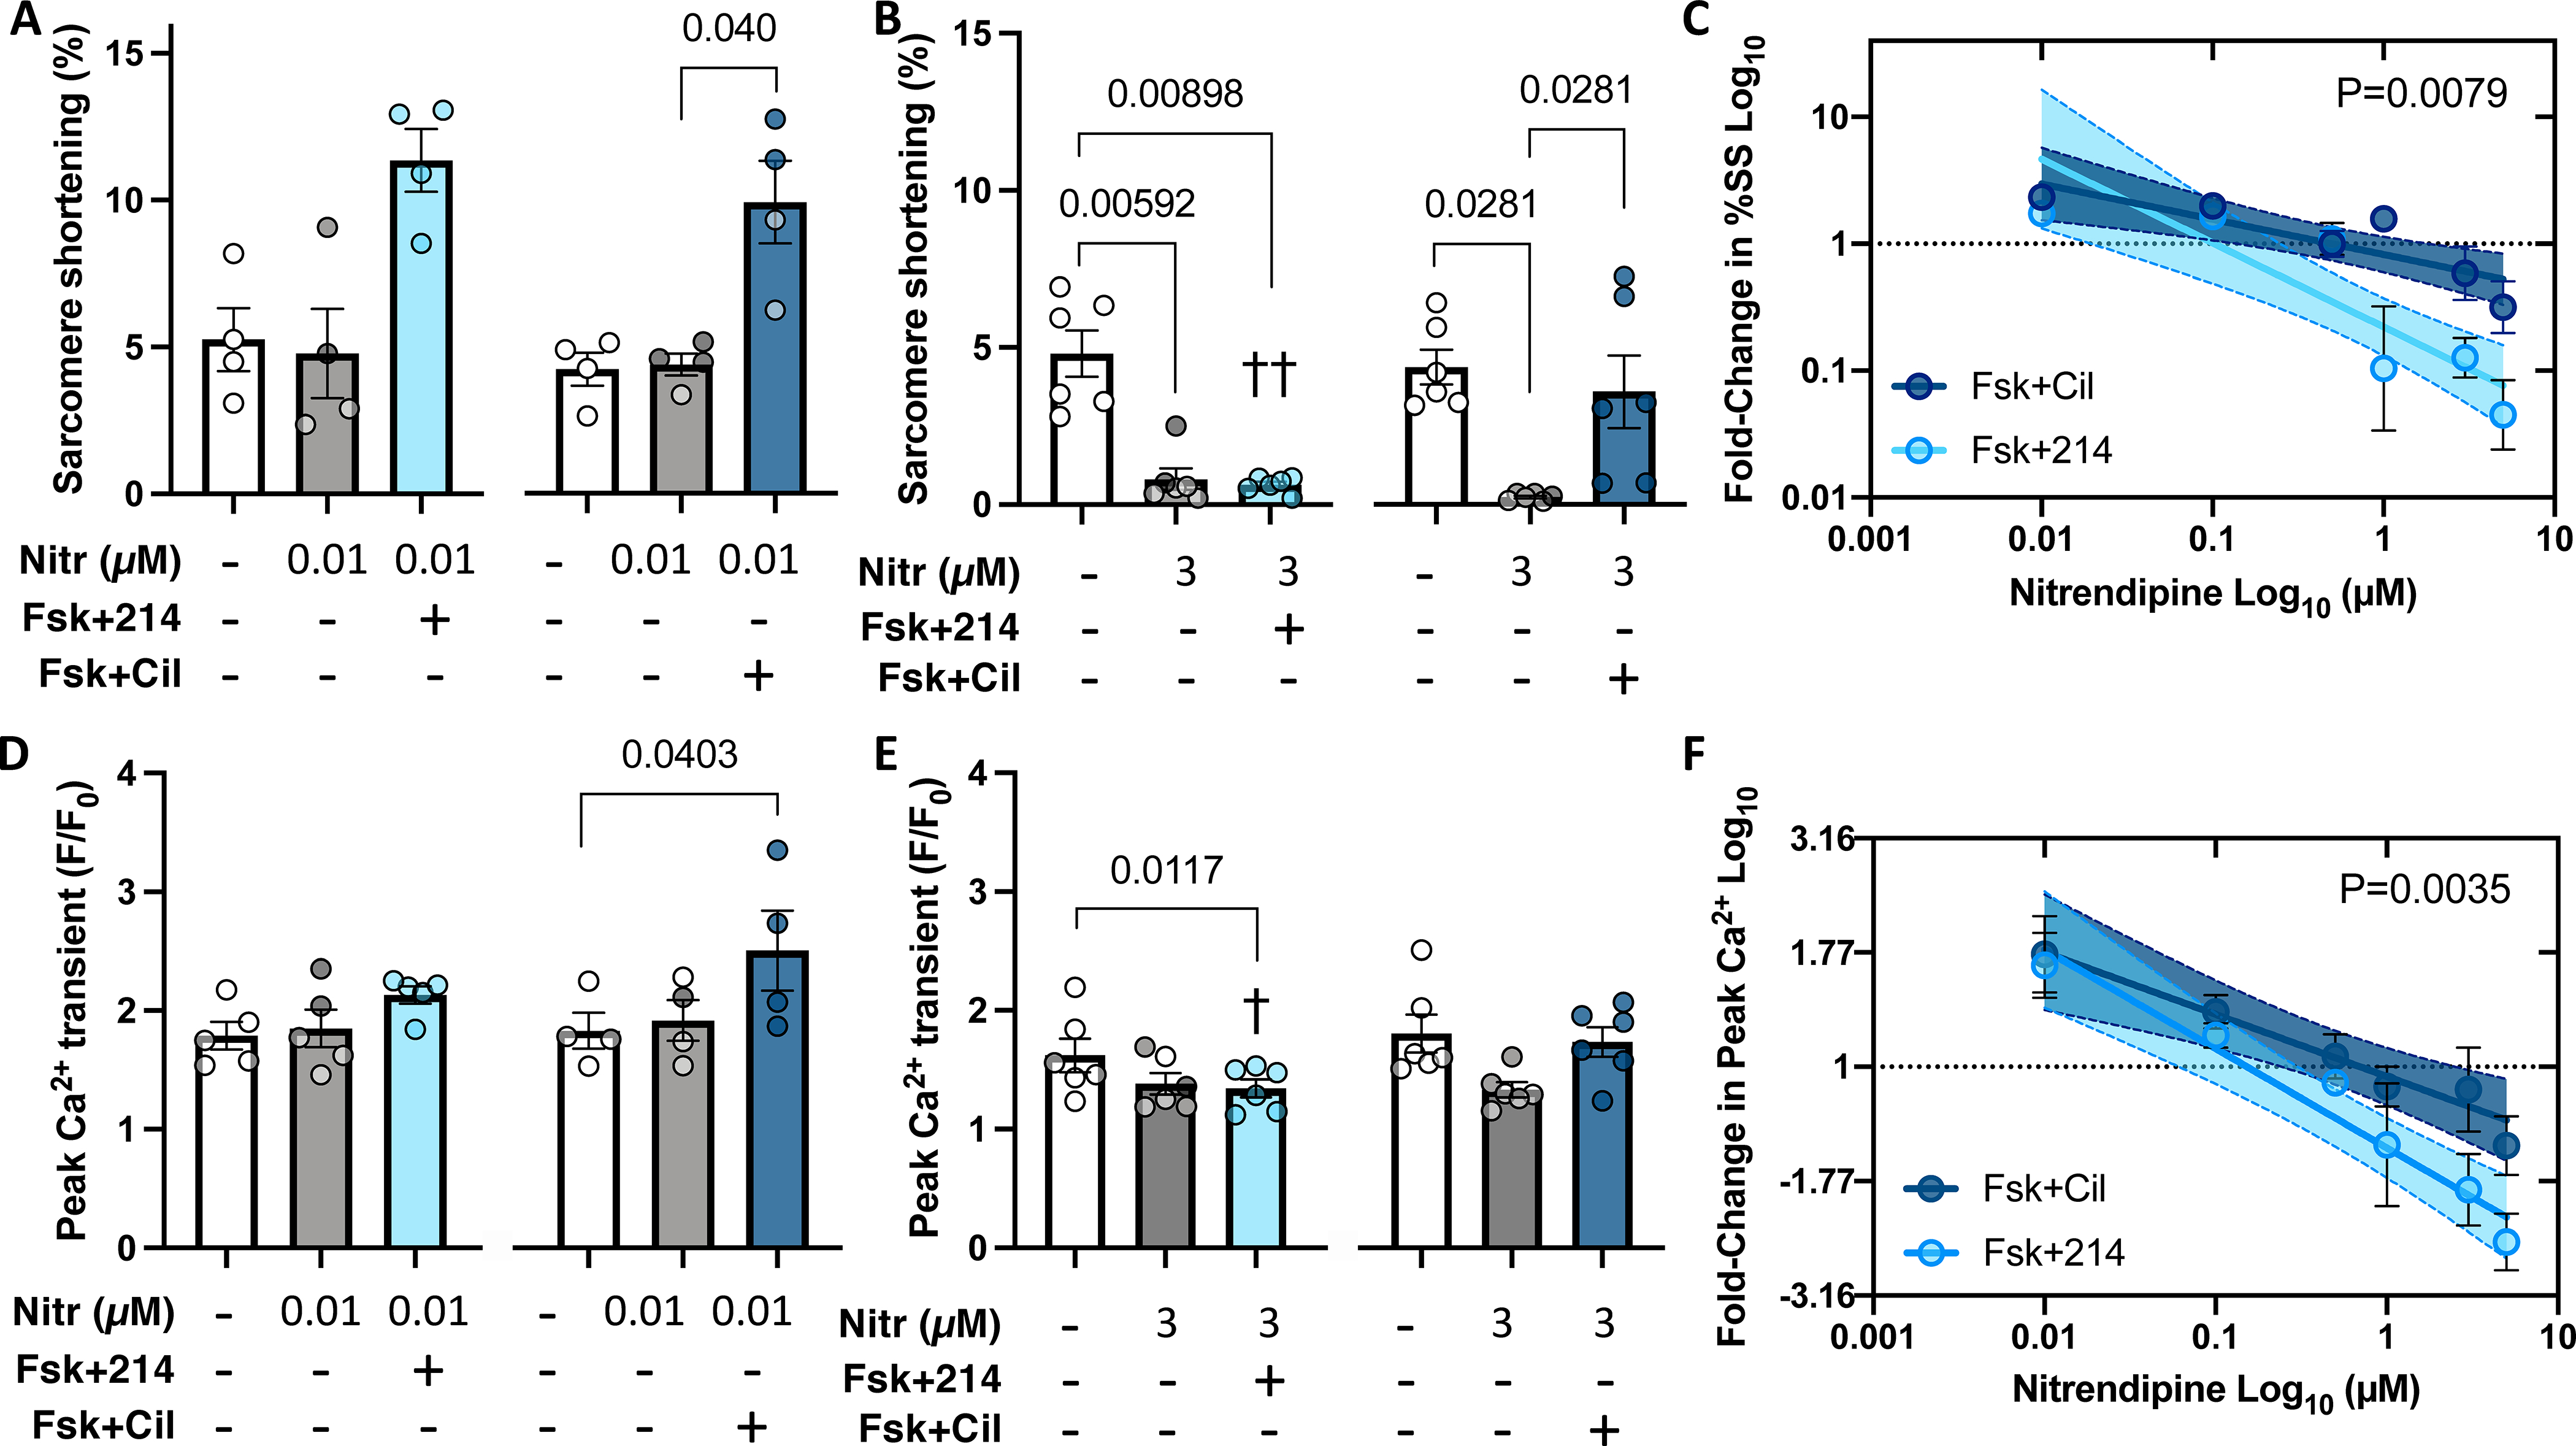
Myocytes were pre-treated with nitrendipine (Nitr) before further stimulation with Fsk+214 or Fsk+Cil. A,B) Sarcomere shortening with Nitr at either 0.01μM or 3 μM. P values in bar graphs from Friedman test with Dunn’s MCT within each 3-condition group between all pairs. C) Fold-change in sarcomere shortening (%SS) from PDE inhibitor versus DMSO alone plot versus Nitr dose on log-log scale. Linear fit and 95% CI values are shown. P-value for difference in slope of two relations by ANCOVA. D, E) Peak Ca2+ transient for same treatments shown in panels A and B, with same statistical test used. ††p=0.0048, †p=0.042 vs respective Nitr+Fsk+Cil group, RM 2-way ANOVA with Holm-Sidak’s post-hoc analysis, comparing Nitr ± Fsk+214 or ± Fsk+Cil. F) Fold change in peak Ca2+ versus Nitr dose for both PDE inhibitors plot and analyzed as in panel C. P value is difference in intercept.
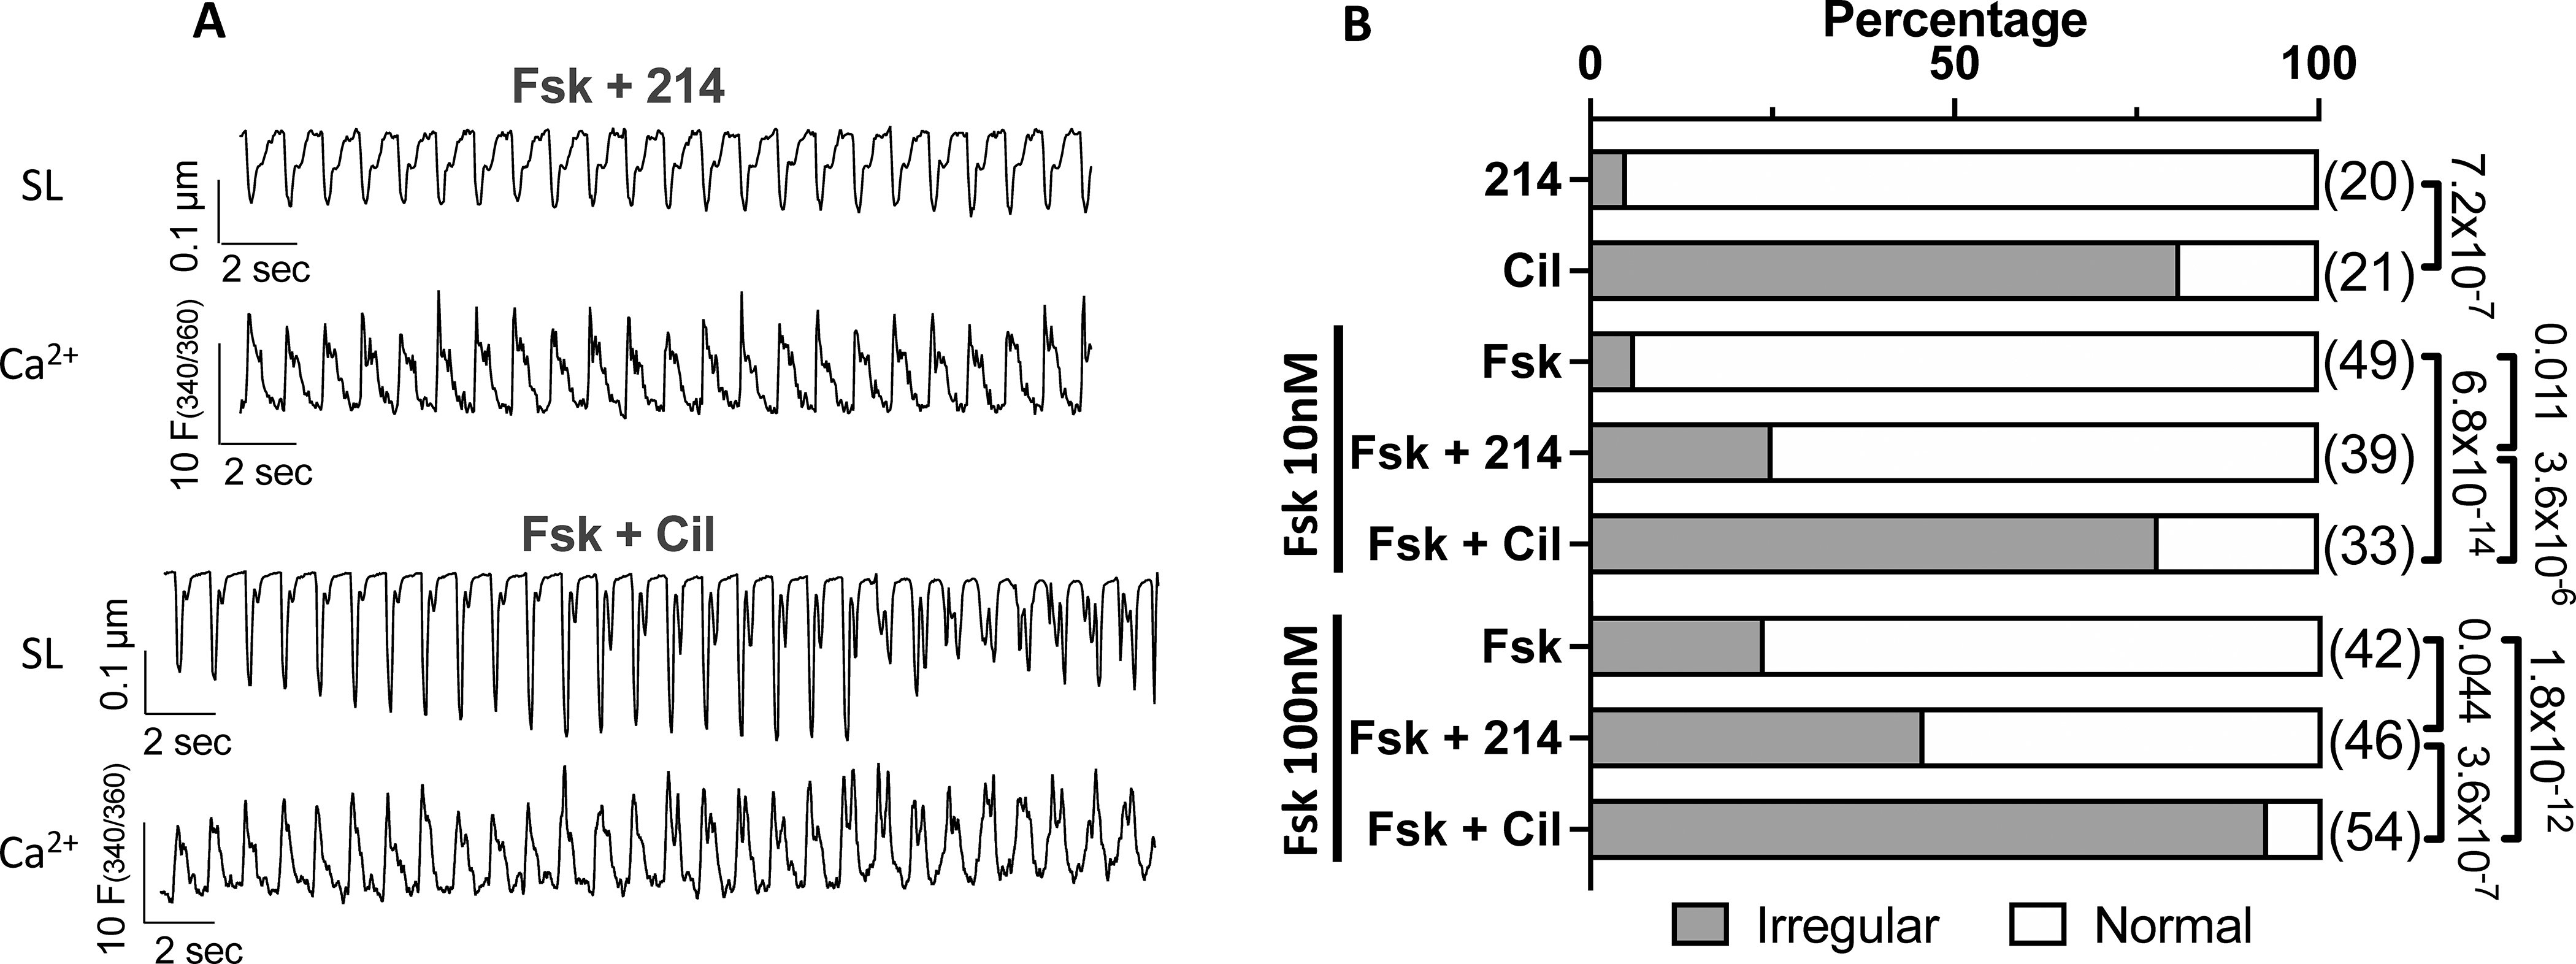
Myocytes treated with 214 or Cil in the presence of Fsk (0, 10, 100 nM) were scored as normal or irregular. A) Representative sarcomere length (SL) and Ca2+ transient tracings for cells responding to 214 or Cil in the presence of Fsk (10nM). B) The percentage of cells in irregular contractions (grey) or normal (white) for indicated conditions; Fisher’s exact test, with n numbers indicated in parenthesis.
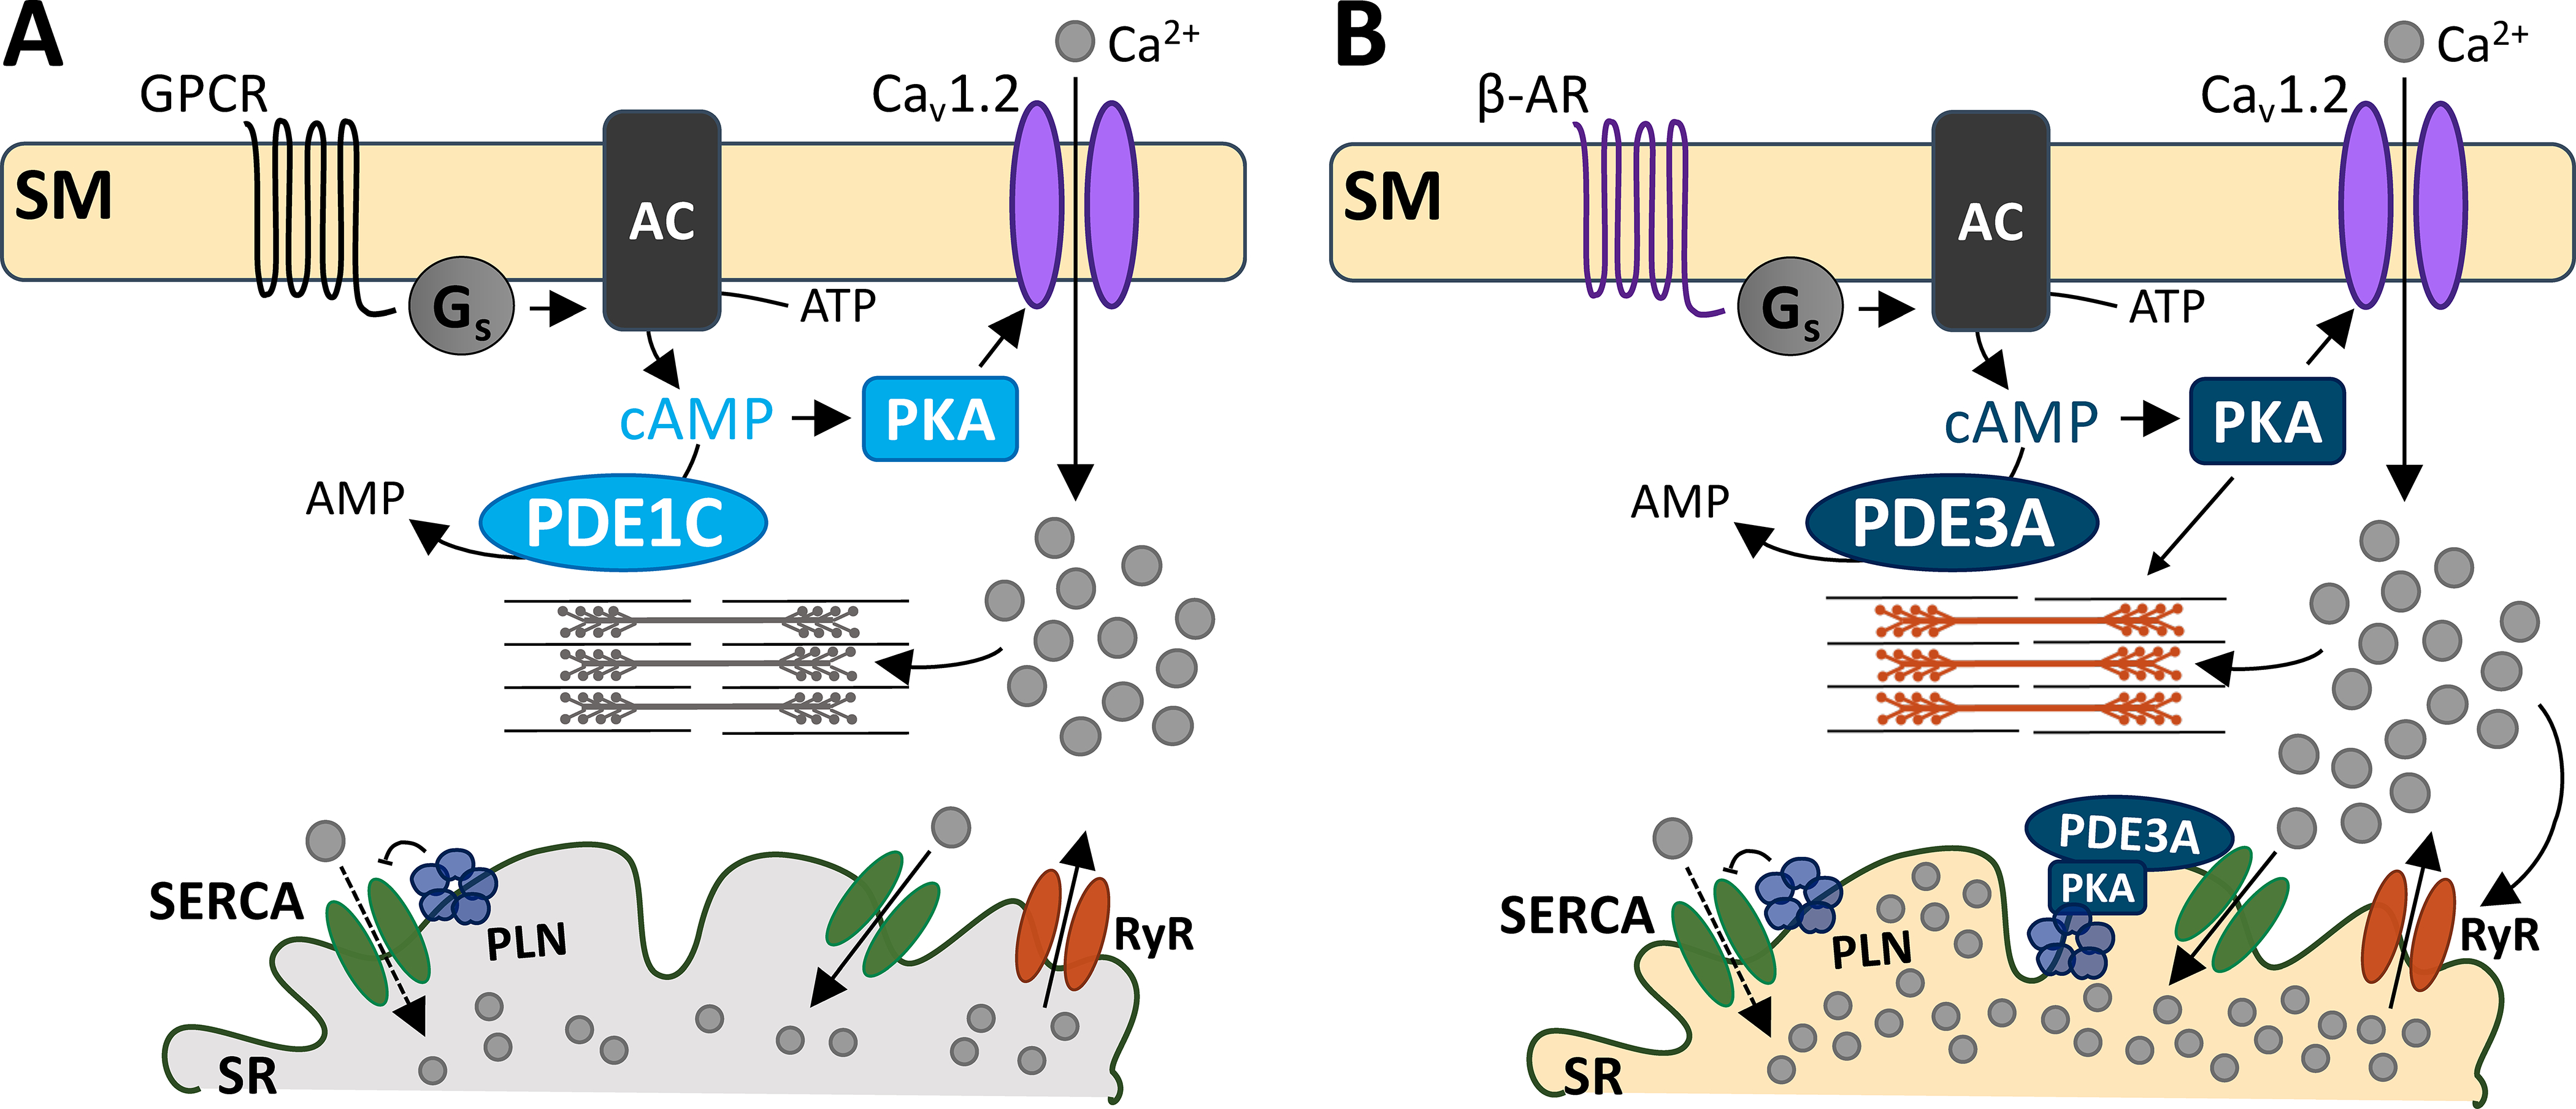
While both PDEs 1 and 3 hydrolyze cAMP, they do so in distinct microdomains. A) G-protein coupled receptor signals to Gs protein to increase cAMP production. PKA activation subsequently increases Cav1.2 activity, allowing Ca2+ entry and cell shortening. PDE1C is at this domain, hydrolyzing sarcolemmal cAMP. B) PDE3A hydrolyzes both the sarcolemmal and a different pool of cAMP at the SR. At the sarcolemma, PDE3A- hydrolyzes cAMP that is produced by β-AR stimulation. PKA-mediated Cav1.2 activity leads to increased SR Ca2+ reuptake, because of PDE3A’s functions at the SR. At the SR, PDE3A controls cAMP/PKA signaling. PKA phosphorylation of PLN releases its inhibition of SERCA-mediated Ca2+ reuptake. This augments Ca2+-induced Ca2+ release to augment cell shortening. Abbreviations: sarcolemmal membrane (SM), G-protein coupled receptor (GPCR), β-adrenergic receptor (β-AR), stimulatory G protein (Gs), adenylyl cyclase (AC), phosphodiesterase 1C (PDE1C), phosphodiesterase 3A (PDE3A), protein kinase A (PKA), sarcoplasmic reticulum (SR), SR Ca2+ ATPase (SERCA), phospholamban (PLN), ryanodine receptor (RyR).
References
-
- Teerlink JR, Diaz R, Felker GM, McMurray JJV, Metra M, Solomon SD, Adams KF, Anand I, Arias-Mendoza A, Biering-Sørensen T, Böhm M, Bonderman D, Cleland JGF, Corbalan R, Crespo-Leiro MG, Dahlström U, Echeverria LE, Fang JC, Filippatos G, Fonseca C, Goncalvesova E, Goudev AR, Howlett JG, Lanfear DE, Li J, Lund M, Macdonald P, Mareev V, Momomura SI, O’Meara E, Parkhomenko A, Ponikowski P, Ramires FJA, Serpytis P, Sliwa K, Spinar J, Suter TM, Tomcsanyi J, Vandekerckhove H, Vinereanu D, Voors AA, Yilmaz MB, Zannad F, Sharpsten L, Legg JC, Varin C, Honarpour N, Abbasi SA, Malik FI, Kurtz CE. Cardiac myosin activation with omecamtiv mecarbil in systolic heart failure. N Engl J Med. 2021;384:105–116 - PubMed
-
- Movsesian MA, Bristow MR. Alterations in camp-mediated signaling and their role in the pathophysiology of dilated cardiomyopathy. Curr.Top.Dev.Biol 2005;68:25–48 - PubMed
-
- Felker GM, Benza RL, Chandler AB, Leimberger JD, Cuffe MS, Califf RM, Gheorghiade M, O’Connor CM, Investigators O-C. Heart failure etiology and response to milrinone in decompensated heart failure: Results from the optime-chf study. J Am Coll Cardiol. 2003;41:997–1003 - PubMed
Publication types
MeSH terms
Substances
Grants and funding
LinkOut - more resources
Full Text Sources
