

Published Erratum
doi: 10.1186/s12864-021-07868-9.
Correction to: Post-diapause transcriptomic restarts: insight from a high-latitude copepod
Affiliations
- PMID: 34521338
- PMCID: PMC8439028
- DOI: 10.1186/s12864-021-07868-9
Item in Clipboard
Published Erratum
Correction to: Post-diapause transcriptomic restarts: insight from a high-latitude copepod
BMC Genomics.
.
No abstract available
Figures

Tricarboxylic acid cycle (TCA) and oxidative phosphorylation. a Schematic representation for tricarboxylic acid cycle (TCA) adapted from Wikimedia Commons (https://commons.wikimedia.org/wiki/File:Cycle_de_krebs.png ). For each step of the TCA cycle intermediate products, enzymes (bold) and coenzymes (FAD and NAD+) are indicated. For each enzyme, heatmaps show relative expression (z-score) in females from T0 to T14d. b KEGG pathway diagram (map 00190) including gene expression results for the five genes among the DEGs in N. flemingeri. The upper part of the figure shows the five respiratory chain complexes with the corresponding E.C. numbers for each enzyme. In the bottom part, heatmaps show relative expression (z-score) of each enzyme associated with the respiratory chain complex in females from T0 to T14d. All enzymes shown were identified as DEGs. Copyright permission to use and adapt the KEGG map 00190 has been granted from KEGG database [18]

RNA metabolism and chromatin silencing. Heatmap of the differentially expressed genes (n = 198) annotated with GO terms associated with chromatin silencing and RNA metabolism (see Fig. 6). Genes (rows) were ordered based on modules (left) for which they were enriched (see Fig. 5). For each gene, relative expression is shown as the average z-score for each timepoint as indicated by the color scale. Timepoints are indicated at the top of the heatmap. Labels on the right indicate processes that were highly represented in each module
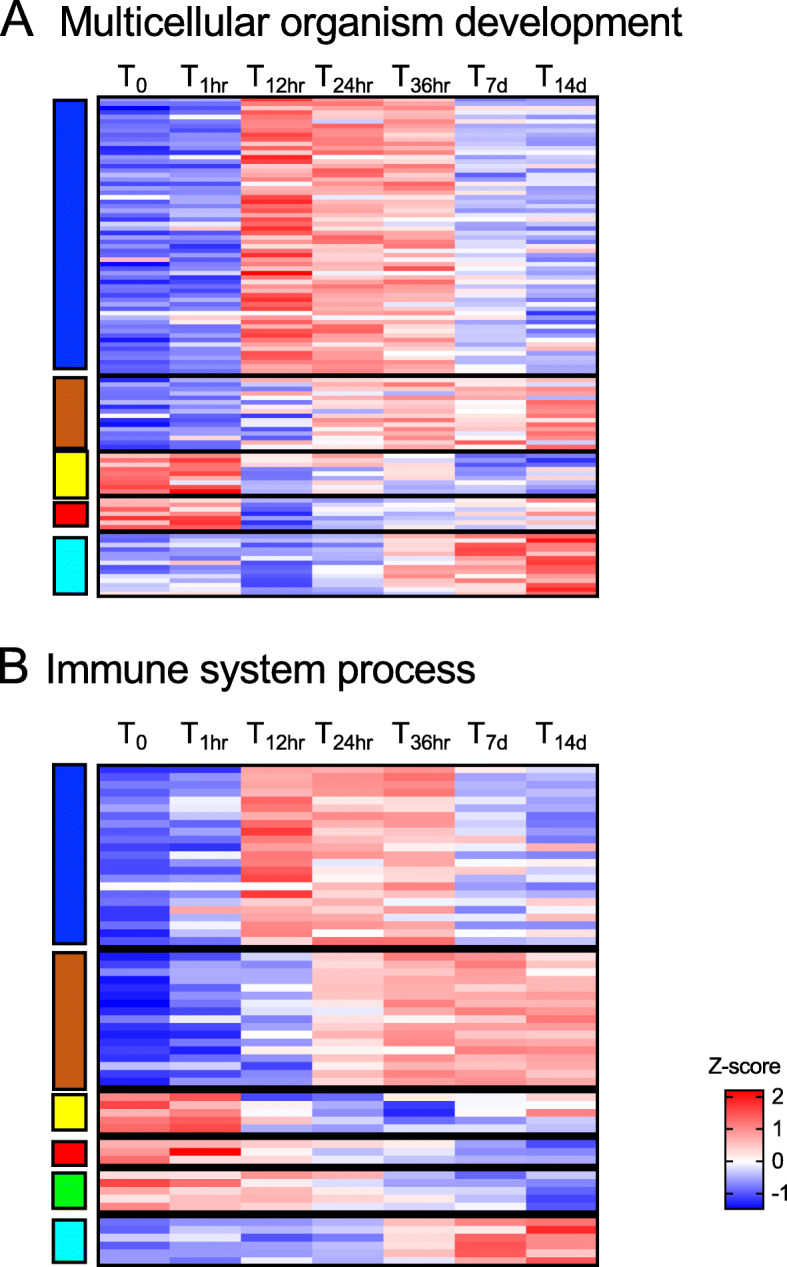
Multicellular organism development and immune system process. Heatmap of the differentially expressed genes annotated with GO terms associated with: a multicellular organism development (n = 108) and b immune system process (n = 61) (see Fig. 6). Genes (rows) were ordered based on modules (left) for which they were enriched (see Fig. 5). For each gene, relative expression is shown as the average z-score for each timepoint as indicated by the color scale. Timepoints are indicated at the top of the heatmap
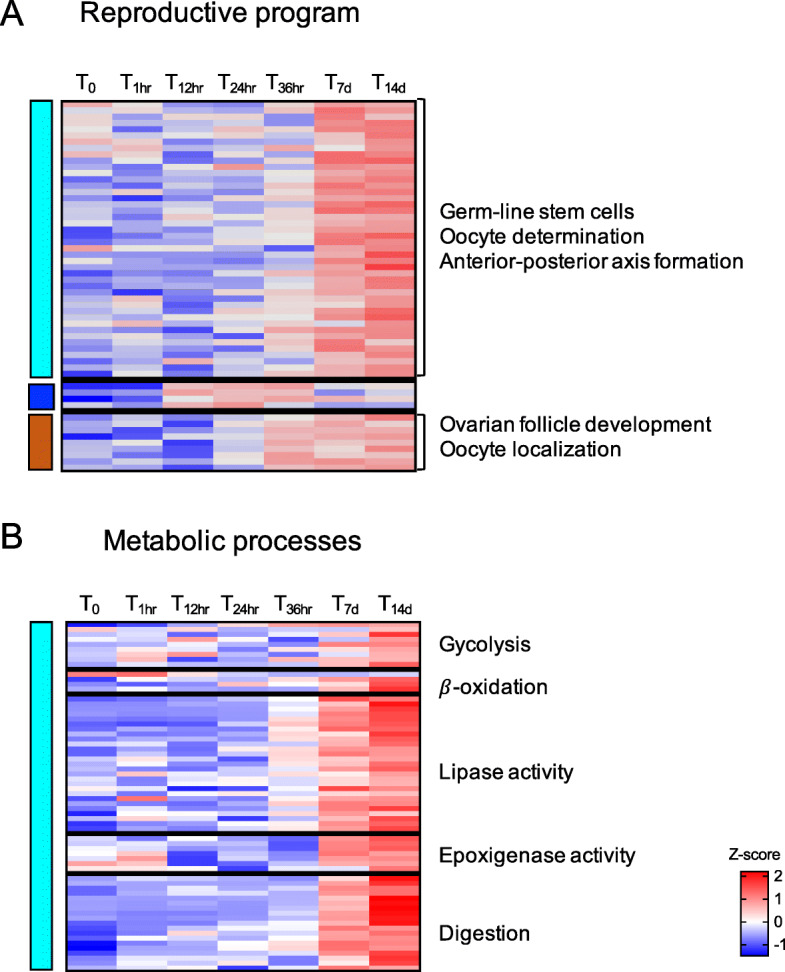
Reproductive program and metabolic processess. Heatmap of the differentially expressed genes annotated with GO terms associated with a oogenesis (n = 54) and b metabolic processes: glycolysis (n = 9), β-oxidation (n = 4), lipase activity (n = 27), epoxigenase activity (n = 9) and digestion (n = 19) (see Fig. 6). Genes (rows) were ordered based on modules (left) for which they were enriched (see Fig. 5). For each gene, relative expression is shown as the average z-score for each timepoint as indicated by the color scale. Timepoints are indicated at the top of the heatmap. Labels on the right indicate processes that were highly represented in each module
Erratum for
-
Post-diapause transcriptomic restarts: insight from a high-latitude copepod.BMC Genomics. 2021 Jun 3;22(1):409. doi: 10.1186/s12864-021-07557-7. BMC Genomics. 2021. PMID: 34082716 Free PMC article.
References
-
- Desgraupes B. clusterCrit: Clustering Indices. R package version 1.2. 6. 2015.
Publication types
LinkOut - more resources
Full Text Sources
