. 2021 Sep 14;22(1):267.
doi: 10.1186/s13059-021-02473-1.

Pandora: nucleotide-resolution bacterial pan-genomics with reference graphs

Affiliations

Pandora: nucleotide-resolution bacterial pan-genomics with reference graphs

Rachel M Colquhoun et al. Genome Biol. .

Abstract

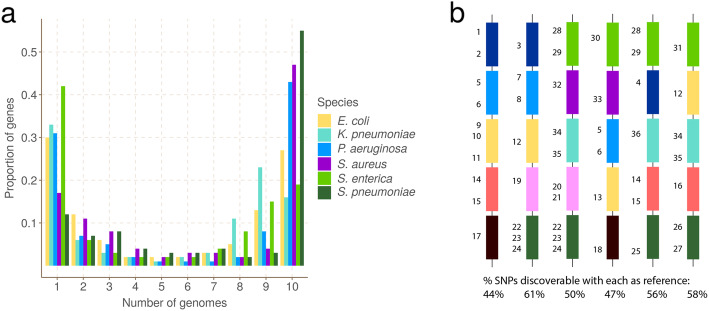
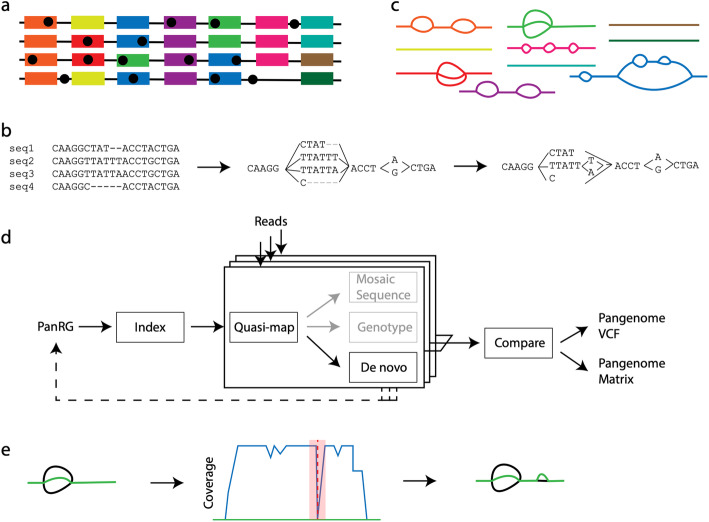
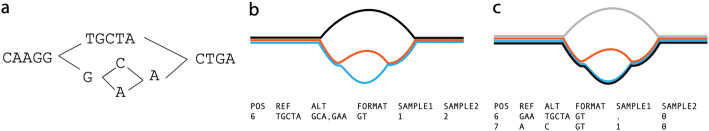
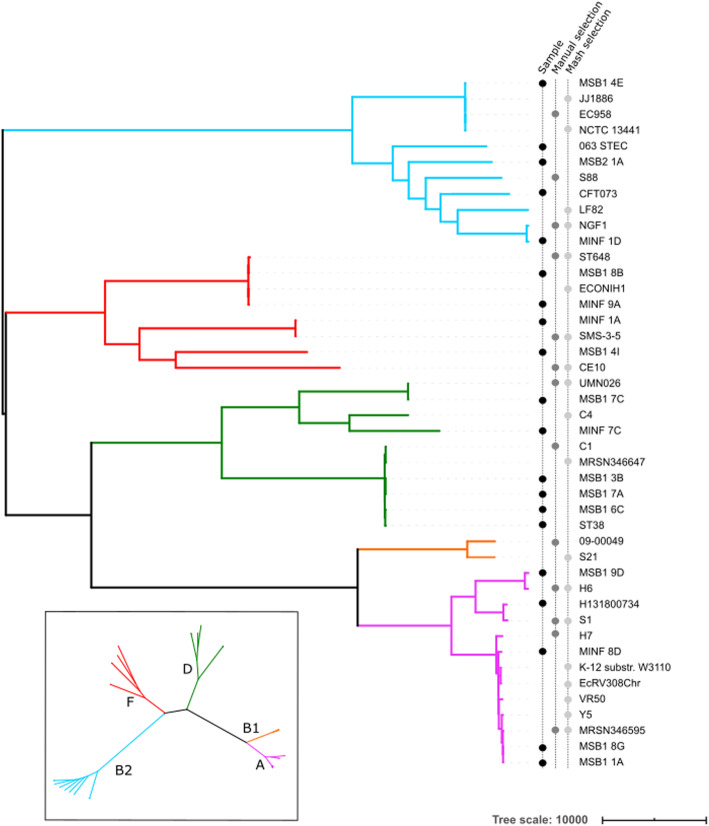
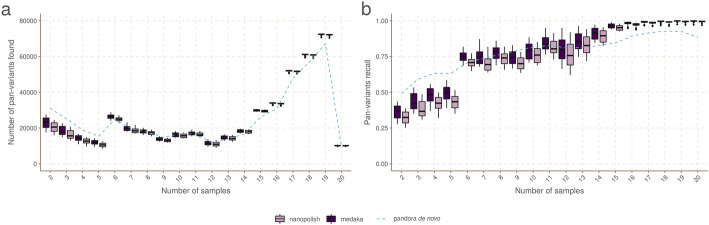
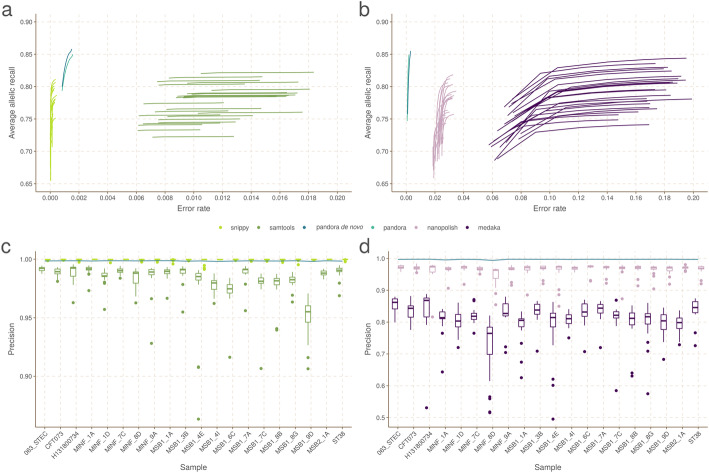
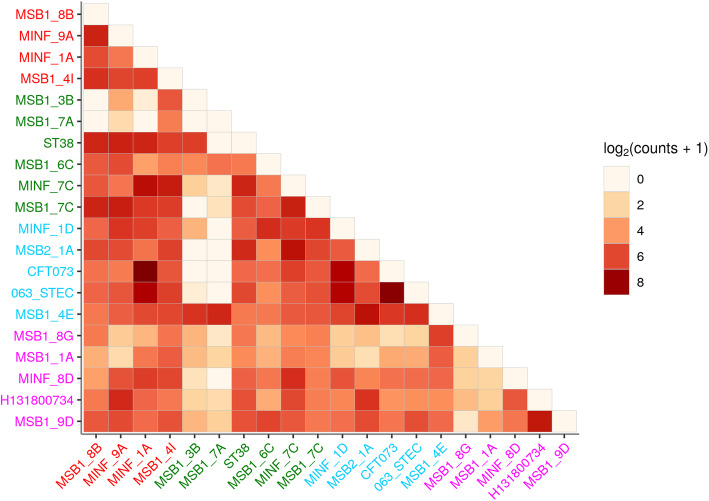
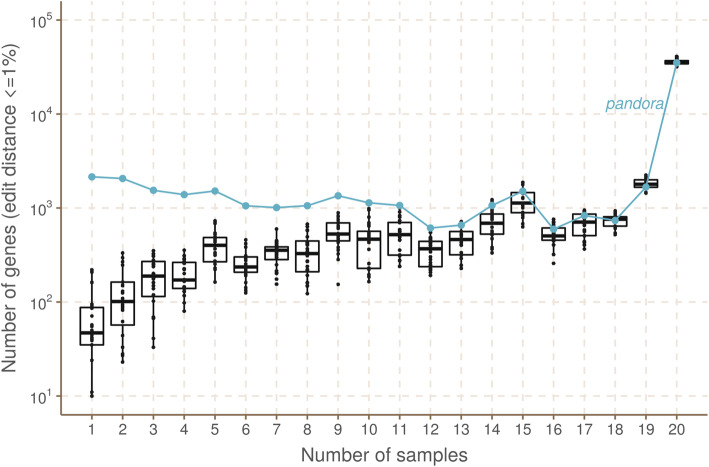
We present pandora, a novel pan-genome graph structure and algorithms for identifying variants across the full bacterial pan-genome. As much bacterial adaptability hinges on the accessory genome, methods which analyze SNPs in just the core genome have unsatisfactory limitations. Pandora approximates a sequenced genome as a recombinant of references, detects novel variation and pan-genotypes multiple samples. Using a reference graph of 578 Escherichia coli genomes, we compare 20 diverse isolates. Pandora recovers more rare SNPs than single-reference-based tools, is significantly better than picking the closest RefSeq reference, and provides a stable framework for analyzing diverse samples without reference bias.

Keywords: Accessory genome; Genome graph; Nanopore; Pan-genome.


Conflict of interest statement

The authors declare that they have no competing interests

Figures

Fig. 1
Fig. 1
Universal gene frequency distribution in bacteria and the single-reference problem. A Frequency distribution of genes in 10 genomes of 6 bacterial species (Escherichia coli, Klebsiella pneumoniae, Pseudomonas aeruginosa, Staphylococcus aureus, Salmonella enterica, and Streptococcus pneumoniae) showing the characteristic U-shaped curve—most genes are rare or common. B Illustrative depiction of the single-reference problem, a consequence of the U-shaped distribution. Each vertical column is a bacterial genome, and each colored bar is a gene. Numbers are identifiers for SNPs—there are 36 in total. For example the dark blue gene has 4 SNPs numbered 1–4. This figure does not detail which genome has which allele. Below each column is the proportion of SNPs that are discoverable when that genome is used as a reference genome. Because no single reference contains all the genes in the population, it can only access a fraction of the SNPs
Fig. 2
Fig. 2
The pandora workflow. A Reference panel of genomes; color signifies locus (gene or intergenic region) identifier, and blobs are SNPs. B The multiple sequence alignment (MSA) for each locus is converted into a directed acyclic graph (termed local graph). C Local graphs constructed from the loci in the reference panel. D Workflow: the collection of local graphs, termed the PanRG, is indexed. Reads from each sample under study are independently quasi-mapped to the graph, and a determination is made as to which loci are present in each sample. In this process, for each locus, a mosaic approximation of the sequence for that sample is inferred, and variants are genotyped. E Regions of low coverage are detected, and local de novo assembly is used to generate candidate novel alleles missing from the graph. Returning to D, the dotted line shows all the candidate alleles from all samples are then gathered and added to the PanRG. Then, reads are quasi-mapped one more time, to the augmented PanRG, generating new mosaic approximations for all samples and storing coverages across the graphs; no de novo assembly is done this time. A pan-genome matrix showing which input loci are present in each sample is created. Finally, all samples are compared, and a VCF file is produced, with a per-locus reference that is inferred by pandora
Fig. 3
Fig. 3
The representation problem. A A local graph with sequence explicitly shown. B, C The same graph with black reference path and alternate alleles in different colors, and the corresponding VCF records. In B, the black reference path is distinct from both alleles. The blue/red SNP then requires flanking sequence in order to allow it to have a coordinate. The SNP is thus represented as two ALT alleles, each 3 bases long, and the user is forced to notice they only differ in one base. C The reference follows the blue path, thus enabling a more succinct and natural representation of the SNP
Fig. 4
Fig. 4
Phylogeny of 20 diverse E. coli along with references used for benchmarking single-reference variant callers. The 20 E. coli under study are labelled as samples in the left-hand of three vertical label-lines. Phylogroups (clades) are labelled by color of branch, with the key in the inset. References were selected from RefSeq as being the closest to one of the 20 samples as measured by Mash, or manually selected from a tree (see “Methods”). Two assemblies from phylogroup B1 are in the set of references, despite there being no sample in that phylogroup
Fig. 5
Fig. 5
Pan-variant recall across the locus frequency spectrum. Every SNP occurs in a locus, which is present in some subset of the full set of 20 genomes. SNPs in the golden truth set are broken down by the number of samples the locus is present in. In panel A, we show the absolute count of pan-variants found and in panel B we show the proportion of pan-variants found (PVR) for pandora (dotted line), nanopolish, and medaka with Nanopore data
Fig. 6
Fig. 6
Benchmarks of recall/error rate and dependence of precision on reference genome, for pandora and other tools on 20-way dataset. A The average allelic recall and error rate curve for pandora, SAMtools, and snippy on 100× of Illumina data. Snippy/SAMtools both run 24 times with the different reference genomes shown in Fig. 4, resulting in multiple lines for each tool (one for each reference). B The average allelic recall and error rate curve for pandora, medaka, and nanopolish on 100× of Nanopore data; multiple lines for medaka/nanopolish, one for each reference genome. Note panels A and B have the same y-axis scale and limits, but different x axes. C The precision of pandora, SAMtools, and snippy on 100× of Illumina data. The boxplots show the distribution of SAMtools’ and snippy’s precision depending on which of the 24 references was used, and the blue line connects pandora’s results. D The precision of pandora (line plot), medaka, and nanopolish (both boxplots) on 100× of Nanopore data. Note different y-axis scale/limits in panels C and D
Fig. 7
Fig. 7
Single-reference callers achieve higher recall for samples in the same phylogroup as the reference genome, but not for rare loci. A Pandora recall (black line) and snippy recall (colored bars) of pan-variants in each of the 20 samples; each histogram corresponds to the use of one of 5 exemplar references, one from each phylogroup. The background color denotes the reference’s phylogroup (see Fig. 4 inset); note that phylogroup B1 (yellow background) is an outgroup, containing no samples in this dataset. B Same as A but restricted to SNPs present in precisely two samples (i.e., where 18 samples have neither allele because the entire locus is missing). Note the differing y-axis limits in the two panels
Fig. 8
Fig. 8
Sharing of variants present in precisely 2 genomes, showing which pairs of genomes they lie in and which phylogroups; darker colors signify higher counts (log scale). Axes are labelled with genome identifiers, colored by their phylogroup (see Fig. 4 inset)
Fig. 9
Fig. 9
How often do references closely approximate a sample? Pandora aims to infer a reference for use in its VCF, which is as close as possible to all samples. We evaluate the success of this here. The x-axis shows the number of genomes in which a locus occurs. The y-axis shows the (log-scaled) count of loci in the 20 samples that are within 1% edit distance (scaled by locus length) of each reference—box plots for the reference genomes, and line plot for the VCF reference inferred by pandora

References

    1. Lynch M, Ackerman MS, Gout J-F, Long H, Sung W, Thomas WK, et al. Genetic drift, selection and the evolution of the mutation rate. Nat Rev Genet. Nature Publishing Group. 2016;17(11):704–14. 10.1038/nrg.2016.104. - PubMed
    1. Didelot X, Maiden MCJ. Impact of recombination on bacterial evolution. Trends Microbiol. 2010;18(7):315–322. doi: 10.1016/j.tim.2010.04.002. - DOI - PMC - PubMed
    1. Rocha EPC. Neutral Theory, Microbial practice: challenges in bacterial population genetics. Mol Biol Evol. Oxford Academic. 2018;35(6):1338–1347. doi: 10.1093/molbev/msy078. - DOI - PubMed
    1. Fraser C, Alm EJ, Polz MF, Spratt BG, Hanage WP. The bacterial species challenge: making sense of genetic and ecological diversity. Science. American Association for the Advancement of Science. 2009;323(5915):741–746. doi: 10.1126/science.1159388. - DOI - PubMed
    1. Mira A, Ochman H, Moran NA. Deletional bias and the evolution of bacterial genomes. Trends Genet. Elsevier. 2001;17(10):589–596. doi: 10.1016/S0168-9525(01)02447-7. - DOI - PubMed

Publication types