. 2021 Sep 28;118(39):e2011411118.
doi: 10.1073/pnas.2011411118.

Tetraspanin 6 is a regulator of carcinogenesis in colorectal cancer

Affiliations

Tetraspanin 6 is a regulator of carcinogenesis in colorectal cancer

Regina Andrijes et al. Proc Natl Acad Sci U S A. .

Abstract

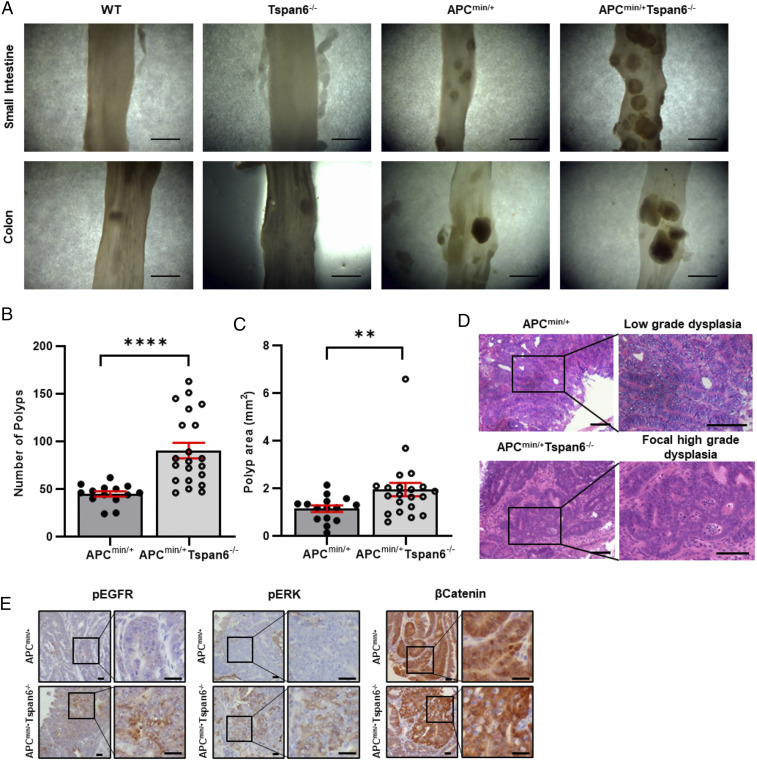
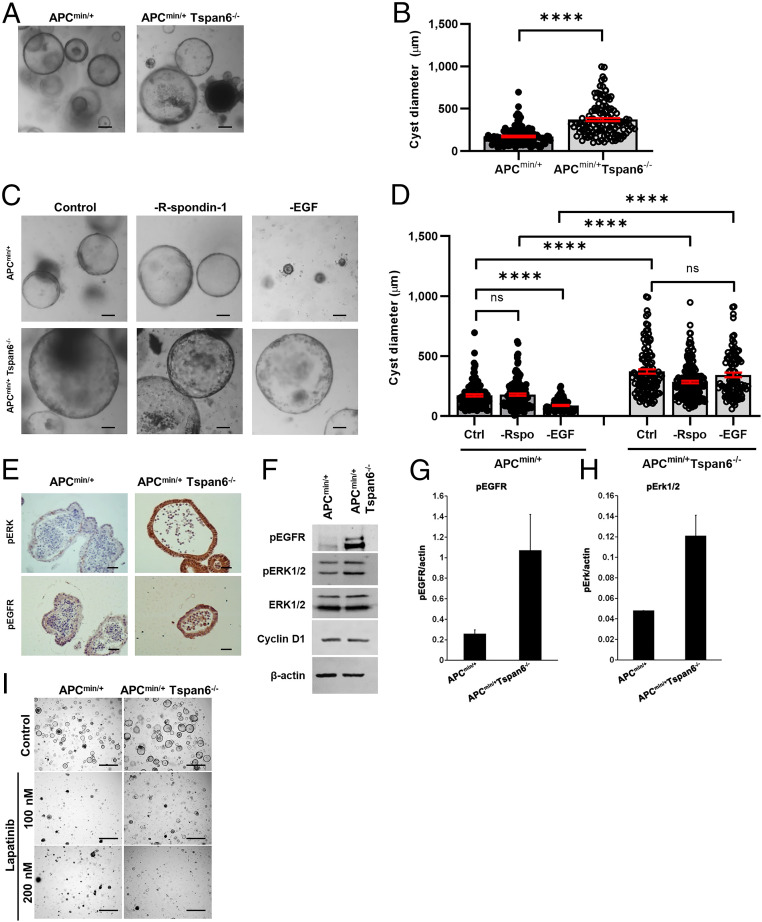
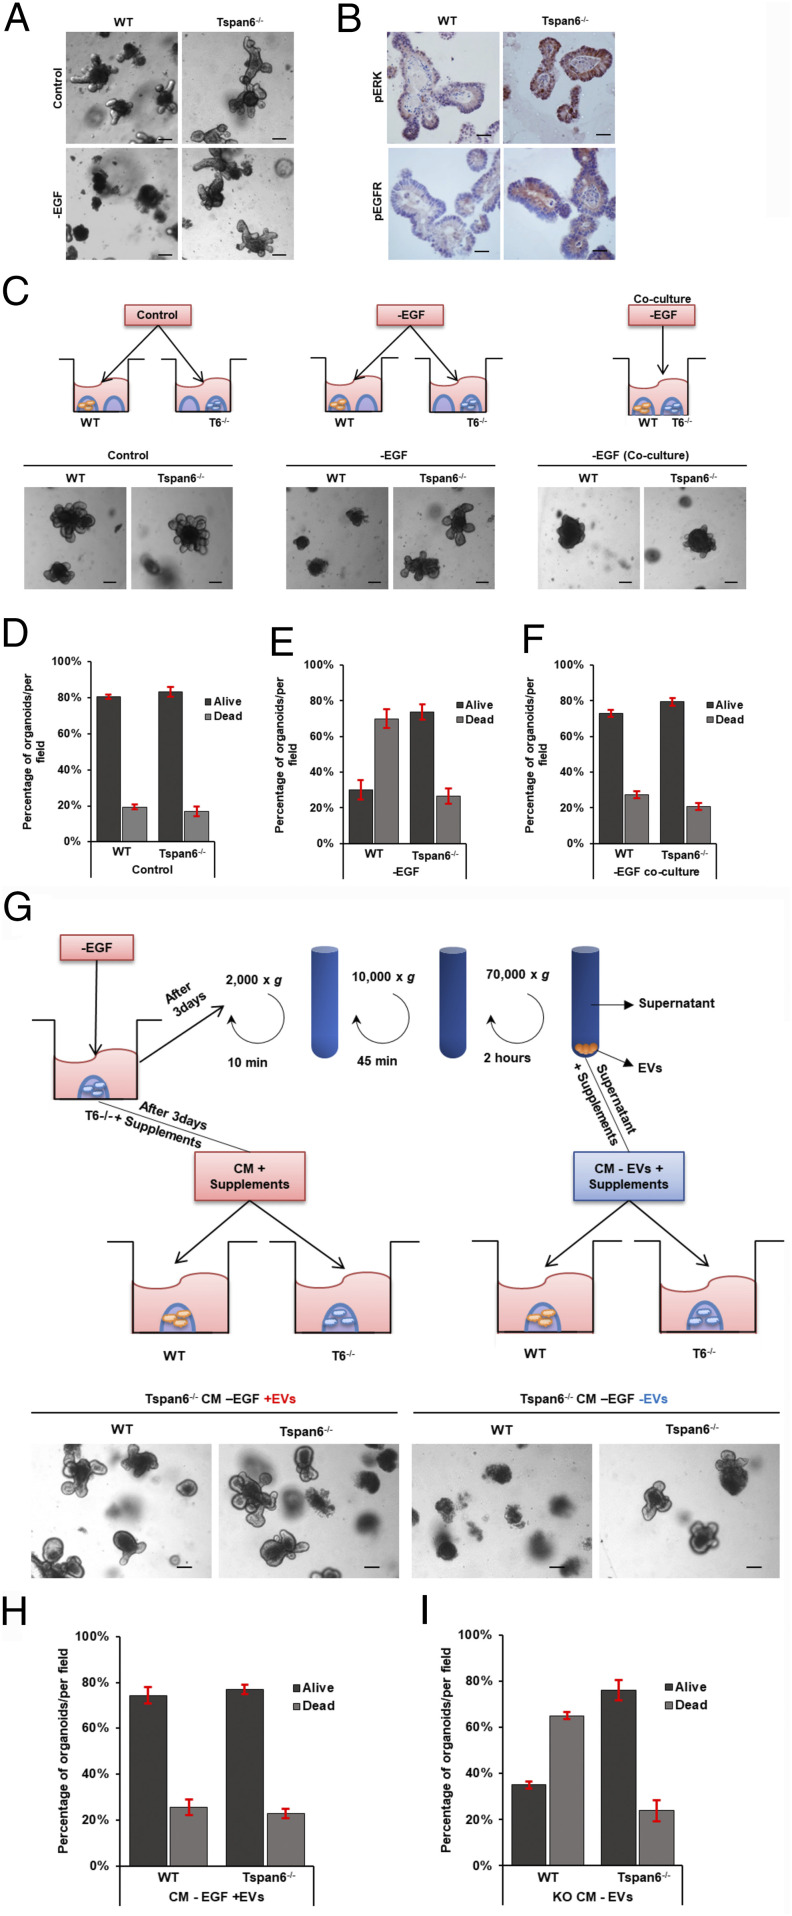
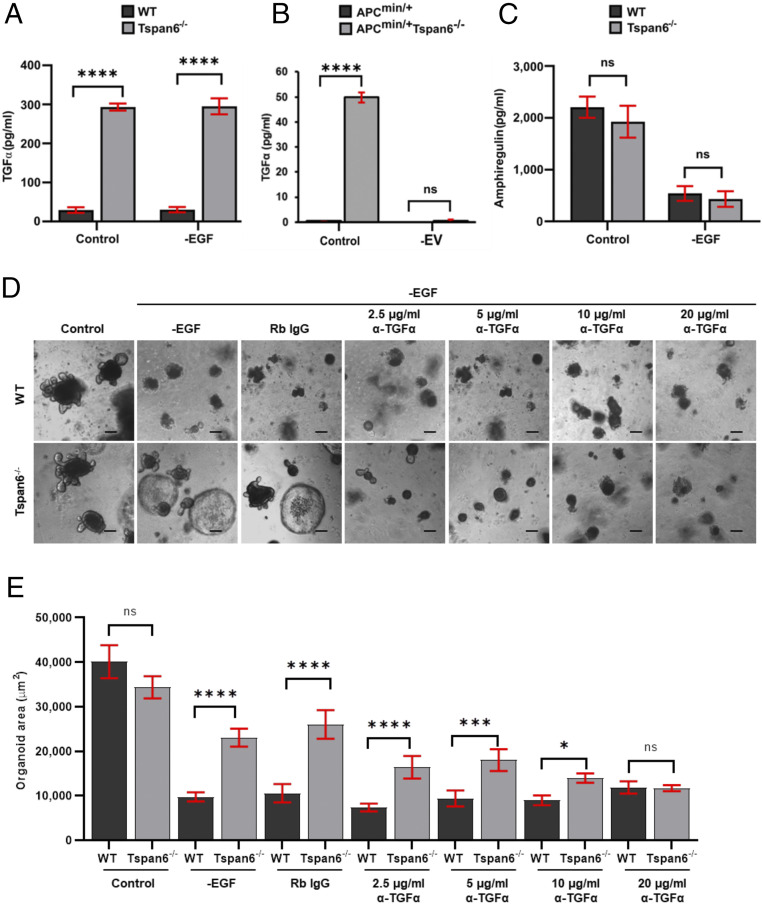
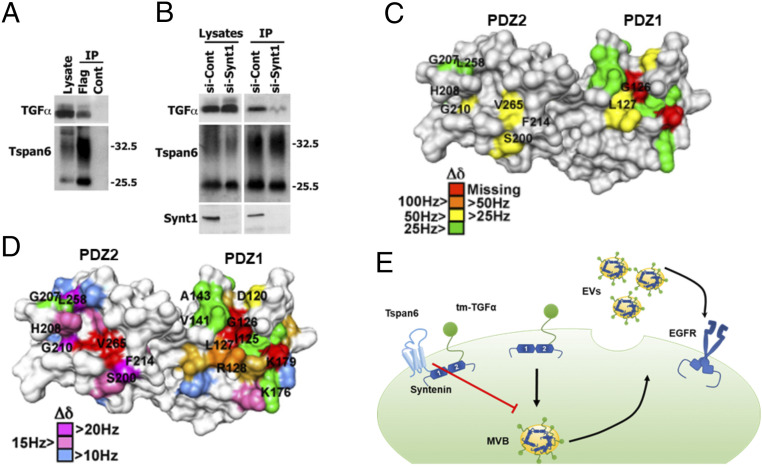
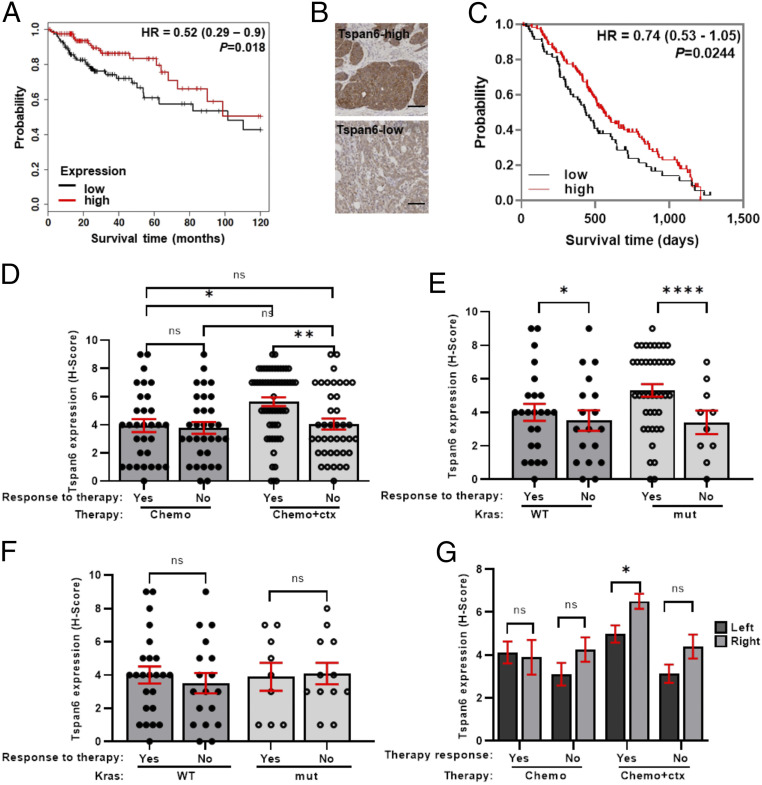
Early stages of colorectal cancer (CRC) development are characterized by a complex rewiring of transcriptional networks resulting in changes in the expression of multiple genes. Here, we demonstrate that the deletion of a poorly studied tetraspanin protein Tspan6 in Apcmin/+ mice, a well-established model for premalignant CRC, resulted in increased incidence of adenoma formation and tumor size. We demonstrate that the effect of Tspan6 deletion results in the activation of EGF-dependent signaling pathways through increased production of the transmembrane form of TGF-α (tmTGF-α) associated with extracellular vesicles. This pathway is modulated by an adaptor protein syntenin-1, which physically links Tspan6 and tmTGF-α. In support of this, the expression of Tspan6 is frequently decreased or lost in CRC, and this correlates with poor survival. Furthermore, the analysis of samples from the epidermal growth factor receptor (EGFR)-targeting clinical trial (COIN trial) has shown that the expression of Tspan6 in CRC correlated with better patient responses to EGFR-targeted therapy involving Cetuximab. Importantly, Tspan6-positive patients with tumors in the proximal colon (right-sided) and those with KRAS mutations had a better response to Cetuximab than the patients that expressed low Tspan6 levels. These results identify Tspan6 as a regulator of CRC development and a potential predictive marker for EGFR-targeted therapies in CRC beyond RAS pathway mutations.

Keywords: APCmin; EGFR; TGF alpha; colorectal cancer; tetraspanin.


Conflict of interest statement

The authors declare no competing interest.

Figures

Fig. 1.
Fig. 1.
Tspan6 deficiency accentuates APCmin/+ phenotype in vivo. (A) Gross appearance of small intestine and colon from wild-type, Tspan6−/−, APCmin/+, and APCmin/+Tspan6−/− mice. (Scale bars: 5 mm.) (B) The graph represents quantifications of polyp burden in APCmin/+ mice (n = 19) and APCmin/+Tspan6−/− mice (n = 23), showing number of polyps per analyzed mouse. Data presented as mean ± SEM, ****P < 0.0001 (Mann–Whitney U nonparametric test). (C) Distribution of intestinal polyps from APCmin/+ (n = 19) and APCmin/+Tspan6−/− (n = 23) age-matched mice expressed as area of polyp (mm2). Data presented as mean ± SEM, **P = 0.0099 (Mann–Whitney U nonparametric test). (D) Representative images of hematoxylin and eosin–stained intestinal lesions in APCmin/+ and APCmin/+Tspan6−/y mice. Polyps of APCmin/+ present with low-grade dysplastic adenomas throughout the small bowel. Loss of Tspan6 in APCmin/+ mice results in the formation of lesions with focal high-grade malignant changes of intestinal mucosa. (Scale bars: 50 µm.) (E) Tspan6 deficiency results in hyper-activated MAPK signaling pathway. Representative images of pEGFR, pERK, and β-Catenin expression in intestinal polyps of APCmin/+ (n = 5) and APCmin/+Tspan6−/− mice (n = 5). (Scale bars: 20 µm.)
Fig. 2.
Fig. 2.
Tspan6 loss results in EGF-independent growth of intestinal organoids derived from APCmin/+ and APCmin/+Tspan6−/− mice. (A) Representative pictures of the APCmin/+ and APCmin/+Tspan6−/− intestinal organoids (n = 3). Mouse intestinal organoids were derived from APCmin/+ and APCmin/+Tspan6−/− mice and cultured in mouse intestinal organoid media for 5 d. (Scale bars: 100 μm.) (B) Quantification of size distribution of intestinal organoids from APCmin/+ (n = 116) and APCmin/+ Tspan6−/−(n = 119) mice. The measurement of diameter of each organoid was carried out using ImageJ; at least 10 fields of view were analyzed (n = 3). Data presented as mean ± SEM, ****P < 0.0001; ns, not significant (Mann–Whitney U nonparametric test). (C) Representative pictures of the APCmin/+ and APCmin/+Tspan6−/− intestinal organoids cultured in complete organoid growth media containing EGF, Noggin, and R-spondin-1 (control) and in media lacking R-spondin-1 (−R-spondin-1) or EGF (−EGF) (n = 3). (Scale bars: 100 μm.) (D) Quantification of size distribution of intestinal organoids from APCmin/+ and APCmin/+Tspan6−/− mice cultured in complete growth media (Ctrl) (n = 116 and n = 119, respectively) in media lacking R-spondin-1 (−Rspo) (n = 144 and n = 195, respectively) or EGF (−EGF) (n = 95 and n = 94, respectively). The measurement of diameter of each organoid was performed using ImageJ; at least 10 fields of view were analyzed (n = 2). Data presented as mean ± SEM, ****P < 0.0001; ns, not significant (one-way ANOVA test). (E) Representative images of pEGFR and pERK IHC staining of FFP-embedded APCmin/+ and APCmin/+Tspan6−/− mouse intestinal organoids (n = 5). (Scale bars: 25 μm.) (F) Western blot showing the increase in pEGFR and pERK expression in APCmin/+ and APCmin/+Tspan6−/− mouse intestinal organoids. (G) Quantification of EGFR activation relative to β-actin expression in APCmin/+ and APCmin/+Tspan6−/− mouse intestinal organoids. Data presented as mean of two independent experiments ± SEM. (H) Quantification of Erk1/2 activation relative to β-actin expression in APCmin/+ and APCmin/+Tspan6−/− mouse intestinal organoids. Data presented as mean of two independent experiments ± SEM. (I) Representative images of APCmin/+ and APCmin/+Tspan6−/− organoids in response to pan-EGFR inhibitor lapatinib after 5 d of culture. (Scale bars: 500 μm.)
Fig. 3.
Fig. 3.
Tspan6 negatively regulates secretion of an EGFR ligand in mouse intestinal organoids. (A) Representative images of wild-type (WT) and Tspan6−/− organoids cultured in complete organoid growth media containing EGF, Noggin, and R-spondin-1 (control) and in media lacking EGF (−EGF) (n = 3). (Scale bars: 100 μm.) (B) Representative images of pEGFR and pERK IHC staining of FFP-embedded WT and Tspan6−/− mouse intestinal organoids (n = 5). (Scale bars: 25 μm.) (C) Schematic diagram outlining the experimental setting to examine the effect of an extracellular EGFR ligand secreted by Tspan6−/− organoids on growth. WT and Tspan6−/− organoids were cultured in separate wells in complete growth media (control) and media lacking EGF (−EGF) or cocultured in the same well in media lacking EGF (coculture-EGF) for 5 d. (Lower) Representative pictures of the indicated treatments. Coculturing with Tspan6−/− organoids rescued WT organoids in –EGF conditions (n = 3). (Scale bars: 100 μm.) (D–F) Quantification of live and dead organoids per field of view cultured in (D) complete growth media (Control), (E) media lacking EGF (−EGF), and (F) cocultured in the same well in media lacking EGF (coculture-EGF). Data presented as mean ± SEM, n = 3. (G) Schematic diagram showing the experimental setting to examine the contribution of EVs secreted by Tspan6−/− organoids on growth. Media conditioned (CM) by Tspan6−/− organoids in EGF-free conditions was collected after 3 d of growth. Media was depleted of EVs by differential centrifugation in three steps followed by supplementing with essential organoid media components (without growth factors) and used to culture WT organoids (−EVs). Nonprocessed conditioned media was also supplemented with essential organoid media components and used to culture WT organoids as control (+EVs). (Lower) Representative pictures of the indicated treatments. Culturing WT organoids in Tspan6−/− CM nondepleted of EVs supported growth of WT organoids, and depletion of EVs in media resulted in cellular death of WT organoids (n = 3). (Scale bars: 100 μm.) (H and I) Quantification of live and dead organoids per field of view cultured in nondepleted (H) or depleted of EVs media (I), which was conditioned (CM) by Tspan6−/− organoids in EGF-free conditions. Data presented as mean ± SEM, n = 3.
Fig. 4.
Fig. 4.
Tspan6 negatively regulates secretion of TGF-α. (A) Enzyme-linked immunosorbent assay (ELISA) analysis of TGF-α present in media collected from wild-type (WT) and Tspan6−/− intestinal organoids after culturing in complete growth media (control) or in EGF-free media (−EGF) for 5 d (n = 2). Data presented as mean ± SEM, ****P < 0.0001, ns, not significant (two-way ANOVA test). (B) ELISA analysis of TGF-α in media collected from APCmin/+ and APCmin/+Tspan6−/− intestinal organoids after depletion of EVs (n = 2). Data presented as mean ± SEM, ****P < 0.0001, ns, not significant (two-way ANOVA test). (C) ELISA analysis of amphiregulin present in media collected from WT and Tspan6−/− intestinal organoids after 5 d of culture. Data presented as mean ± SEM, ****P < 0.0001, ns, not significant (n = 3) (two-way ANOVA test). (D) Representative images of WT and Tspan6−/− organoids cultured in control media in media lacking EGF (−EGF) supplemented with rabbit IgG (Rb IgG) or increasing concentrations of anti-mouse TGF-α antibody (α-TGF-α) (2.5 μg/mL – 20 μg/mL). (Scale bars: 100 µm.) (E) Distribution of organoid size cultured in –EGF conditions in the presence or absence of anti–TGF-α neutralizing antibody. The organoid size was measured using ImageJ and presented as area in square micrometers. For statistical analysis for each condition, 10 fields were captured and >50 organoids were analyzed. Data presented as mean ± SEM, ****P < 0.0001, ***P = 0.0003, *P = 0.0166, ns, not significant (one-way ANOVA test).
Fig. 5.
Fig. 5.
Tspan6 is associated with transmembrane form of TGF-α (tmTGF-α). (A) Coimmunoprecipitation (IP) of Tspan6 and tmTGF-α. IP studies were carried out with lysates prepared from HEK293T cells expressing the Flag-Tspan6 (Flag) or empty vector (control). Flag-Tspan6 protein was immunoprecipitated with Flag-agarose beads and then immunoblotted using a polyclonal Tspan6 antibody and polyclonal TGF-α antibody. (B) IP of Tspan6 and TGF-α in cells after syntenin-1 depletion. IP studies were carried out with lysates prepared from HEK293T cells expressing the Flag-Tspan6 (Flag) or empty vector (control) treated with syntenin-1 small interfering (siRNA) (si-synt1) or nontargeting siRNA (si-cont). (C) NMR analysis of syntenin-1 interaction with the C-terminal peptide of tmTGF-α. Syntenin-1 PDZ domain residues involved in binding to the C-terminal peptide of tmTGF-α, based on NMR chemical shift perturbation, are indicated on the surface of syntenin-1 PDZ1-2 monomer (1N99.pdb). The residues displaying chemical shift changes (Δδ) greater than the mean value plus one (55 Hz) are color-coded as indicated. (D) NMR analysis of syntenin-1 interaction with C-terminal peptides of Tspan6 and tmTGF-α. Syntenin-1 PDZ domain residues involved in binding to the C-terminal peptide of Tspan6 (Top), based on NMR chemical shift perturbation, are indicated on the surface of syntenin-1 PDZ1-2 monomer (1N99.pdb). The residues displaying combined chemical shift changes (Δδ) greater than the mean value plus one (55 Hz) are color-coded as indicated. Syntenin-1 residues displaying Δδ greater than 25 Hz upon interaction with a mixture of Tspan6 and tmTGF-α peptides are indicated (Bottom), with red and green indicating proximal and distal, respectively, to the C-terminal peptide–binding pocket. (E) Proposed model describing how Tspan6 regulates activation of EGFR-dependent by regulating secretion of EV-associated tmTGF-α. When expressed, Tspan6 forms a molecular complex with tmTGF-α via syntenin-1, thus inhibiting the recruitment of tmTGF-α into multivesicular bodies (MVBs) and subsequent secretion into extracellular space. The loss of Tspan6 favors syntenin-1–mediated recruitment of tmTGF-α into EVs and subsequent activation of EGFR.
Fig. 6.
Fig. 6.
The decreased expression of Tspan6 correlates with poor survival prognosis in patients with colorectal adenocarcinomas. (A) Kaplan–Meier survival curves for 10-y overall survival of CRC patients with Tspan6-high and Tspan6-low expression of CRC patients with adenocarcinomas (n = 252). P values were determined by log-rank test and are shown for comparisons of Tspan6-high expression (n = 125) and Tspan6-low expression (n = 127) in adenocarcinomas. (B) Representative images of Tspan6-high and Tspan6-low protein expression in CRC tumors from patients of COIN clinical trial cohort. (C) Kaplan–Meier survival curves for overall survival of CRC patients with Tspan6-high and Tspan6-low expression of the COIN cohort (n = 182). P value was determined by Gehan–Breslow–Wilcoxon test and are shown for comparisons of Tspan6-high (n = 112) and Tspan6-low (n = 70) expression in the whole cohort. (D–G) The correlation of Tspan6 expression with responses of CRC patients treated with chemotherapy alone or chemotherapy in combination with Cetuximab (COIN study). (D) Responses in the whole cohort of patients treated with chemotherapy (response n = 31, no response n = 31) and patients treated with chemotherapy combined with cetuximab (response n = 40, no response n = 58). Data presented as mean ± SEM, **P = 0.0043, *P = 0.0106, ns: not significant (two-way ANOVA test). (E) Responses of the patients with mutated K-Ras (n = 46) or WT K-Ras (n = 52) to the chemo + Cetuximab therapy. Data presented as mean ± SEM, ****P < 0.0001, *P = 0.0415, ns: not significant (two-way ANOVA test). (F) Responses of the patients with mutated K-Ras (n = 21) or WT K-Ras (n = 42) to the chemotherapy only. Data presented as mean ± SEM, ns: not significant (two-way ANOVA test). (G) The expression of Tspan6 in tumors that have responded to the therapy (chemotherapy only or chemotherapy combined with cetuximab) in left-sided (n = 111) or right-sided (n = 72) colorectal adenocarcinomas. Data presented as mean ± SEM, *P = 0.0125 (two-way ANOVA test).

References

    1. Kaprio T., Hagström J., Andersson L. C., Haglund C., Tetraspanin CD63 independently predicts poor prognosis in colorectal cancer. Histol. Histopathol. 35, 887–892 (2020). - PubMed
    1. Liu J., Chen C., Li G., Chen D., Zhou Q., Upregulation of TSPAN12 is associated with the colorectal cancer growth and metastasis. Am. J. Transl. Res. 9, 812–822 (2017). - PMC - PubMed
    1. Greco C., et al. ., E-cadherin/p120-catenin and tetraspanin Co-029 cooperate for cell motility control in human colon carcinoma. Cancer Res. 70, 7674–7683 (2010). - PubMed
    1. Romanska H. M., Berditchevski F., Tetraspanins in human epithelial malignancies. J. Pathol. 223, 4–14 (2011). - PubMed
    1. Xu L., et al. ., Transcriptome analysis of human colorectal cancer biopsies reveals extensive expression correlations among genes related to cell proliferation, lipid metabolism, immune response and collagen catabolism. Oncotarget 8, 74703–74719 (2017). - PMC - PubMed

Publication types

MeSH terms